
[After reading two congressional hearings, one in 2008, and another in 2013, about how the inland waterway system was falling apart, and had been for 30 years, I was curious to know why such an important asset would be allowed to fall apart. In the testimony, it was said that more money was collected in fees by the government than doled back out in capital and maintenance expenses (true from 1991 to 2006 (NAS 2015). It was said at the 2013 hearing that the U.S. Army Corps of Engineers (USACE) has a set budget, so if the money put into the Inland Waterway Trust Fund was actually given to port and river projects, other USACE projects would not be funded.
So the selection of waterways projects for authorization has a long history of being driven largely by political and local concerns (NAS 2015). Many states got a lot more money than they put in. The NAS report explains in gory detail what an irrational, byzantine mess the approval and funding process is.
National energy policy is not based on energy efficiency–there were no café standards for decades. Instead, massive, polluting gas guzzling vehicles have pummeled the hell out of our bridge and road infrastructure, wasting decades of oil that future generations will be angry about when the permanent oil crisis arrives.
Now that we’re at peak oil, a lot more attention and funding ought to go to the waterway system.
Alice Friedemann www.energyskeptic.com]
Energy Intensity of Barges and other transport
Barges are the second most energy efficient form of transport, next to large container and bulk ships.
Barges being towed down a river will get 953 net ton-miles, but being towed against the flow of the current will drop to 243 (Tolliver) with an overall average of 576 ton-miles, with rail 413, truck 155.
Barge versus rail
Davis reports that rail (294 Btu/ton-mile in 2012) is 40% more energy intensive than barge (210 Btu/ton-mile in 2012), nearly the same percentage difference as reported by Kruse (2013) who found 311 Btu/ton-mile for rail and 223 Btu/ton-mile for inland towing.
Dager (2013) reports even lower energy intensity for inland barge transport on the basis of independent data and fuel use modeling, corresponding to about 196 Btu/ton-mile, or about 60 percent better energy intensity than average rail.
Commodity-specific configurations can do even better. Dager reports towboats on the Mississippi River between the mouth of the Missouri and Baton Rouge, Louisiana, averaged 867 ton-miles per gallon in 2011 versus the system average of 656. Baumel (2008) reported that unit grain trains moving from Iowa to New Orleans, Louisiana, had route-specific fuel efficiency of 640 ton-miles per gallon, 54% better than energy intensity for an average train.
“24th Annual State of Logistics Report: Is This the New Normal”, by Roz Wilson
Drought effect on barges
There were numerous times when sections of the particularly that Mississippi could travel only in one direction at a time because of the width of the channel would not support a bridge to, despite the fact that the Army Corps of Engineers was providing emergency dredging. Barges were often backed up for days at a time awaiting passage. I one point there were close to 100 vessels run aground and the lower Mississippi.
Shallower channels meant lighter loads, lower speeds and fewer barges, any of which would run up costs. Several harbors were closed at the height of the drought. It is estimated that every inch of drought loss represents thousands of potential products that cannot be moved. And 11 mile stretch of the Mississippi was closed intermittently and August causing queues up to 100 tows. Every single day a towboat is idle, it cost the owners $10,000. No surprise that shipping rates increase close to 25% during that period.
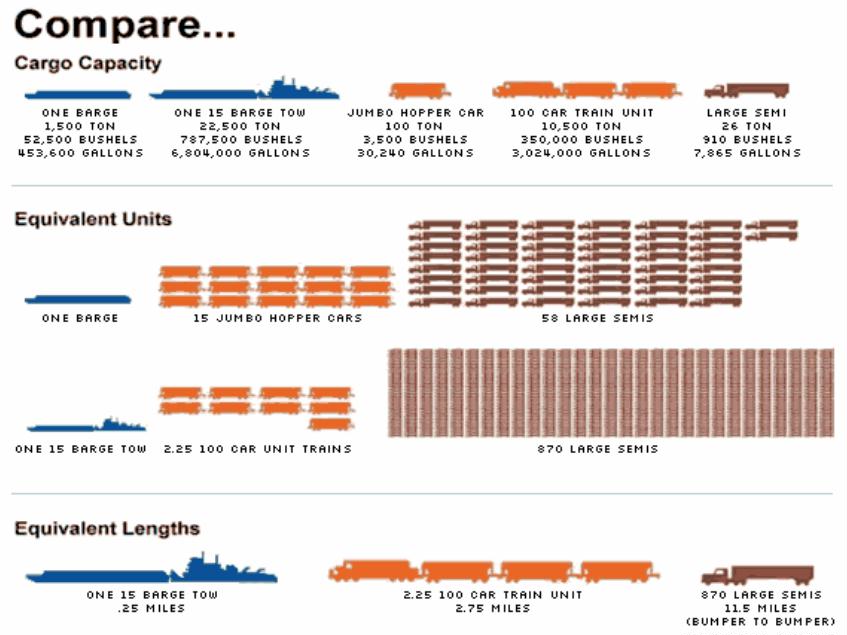
Just to show you how important the waterways really are, take a look at this model comparison chart and look at what you can move on one barge compared to what you can move on railroad, cars or trucks, or in one barge tow.
We should be using the water part of our system a lot more efficiency, I think, than we are. Just to bring it home, look at the time the miles traveled per gallon of fuel based on various modes. Looking at this really makes you want to understand or figure out ways that we can use our waterways more effectively.
most of the lock infrastructure has already exceeded its expected life. We need to fix the aging infrastructure. And then we need to build more landside infrastructure to support containers on barges and for translating the other modes.
Nicholas Kehoe. Oct 17, 2012. An Update on America’s Marine Highway Program
The infrastructure for seaports in our country was developed- much of it goes back to the 1930s, or some of it down in the South goes even later than that- but, the majority of the infrastructure in the country dates back to the 1950s, 60s and 70s. When it was built, it had an expected life cycle of about 50 years.
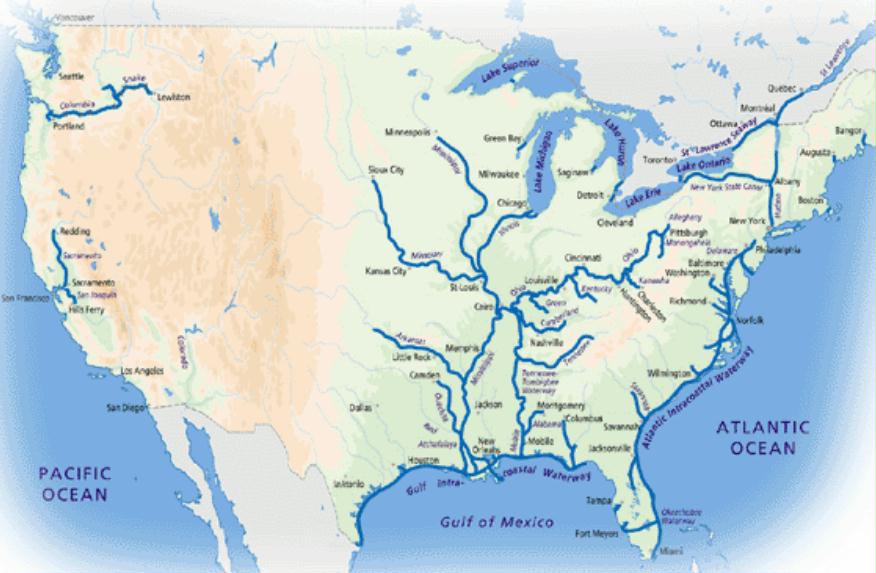
If you look at the freight network map that we have that has been used now for almost 5 years, not all of those highways connect to all of those ports. A prime section of ports that are missing are the Great Lakes. Look at the map and look at Duluth, which generates a significant amount of tonnage. Duluth supports one of the last US steelmaking plants and does not even have any highways connecting to it on that map. So, we need to work together to make sure that our freight highway system connects to the ports that the freight is flowing to, so that we can have that intermodal connectivity.
The purpose of the Marine Highway program, as legislated, is to mitigate landside congestion. And, we are to encourage the use of short sea or Marine Highway transportation through development and expansion of designated corridors, similar to the highway corridors, but for waterways. We use documented vessels and services, which means US flagged vessels. And, we have to encourage shipper utilization of the program. If the market is not establishing a program on its own, there is reason for that. There are policy disincentives to using marine highways, we are discovering. The system is not made right now to make water very easy. We are lacking purpose-built vessels to carry the freight on the water on the routes that we are identifying.
Baumel, C. P. 2008. The Mississippi River System Shallow Draft Barge Market—Perfectly Competitive or Oligopolistic? Journal of the Transportation Research Forum, Vol. 47, No. 4, pp. 5–18.
Dager, C. A. 2013. Fuel Tax Report, 2011. Center for Transportation Research, University of Tennessee, Knoxville.
Davis, S. C., S. W. Diegel, and R. G. Boundy. 2014. Transportation Energy Data Book, 33rd ed. Oak Ridge National Laboratory, Oak Ridge, Tenn.
Kruse, C. J., D. Ellis, A. Protopapas, and N. Norboge. 2013. New Approaches for U.S. Lock and Dam Maintenance and Funding. Texas A&M Transportation Institute, Texas A&M University, College Station.
NAS. 2015. TRB special report 315: funding and managing the U.S. inland waterways system: what policy makers need to know. Transportation research board, National Academy of Sciences. 157 pages.
Tolliver, D, et al. October 2013. Comparing rail fuel efficiency with truck and waterway. Transportation Research Part D: Transport and environment. volume 24 pp69-75.
2 Responses to Barges are more energy efficient than rail and truck