
Morgan, M., et al. (Pacific Northwest National Laboratory, University of Wisconsin-Madison, Electric Power Research Institute, BACV Solutions, Southern Company, CIEE, University of Alaska – Fairbanks, and KEMA). 2011. Extreme Events. California Energy Commission. Publication number: CEC-500- 2013-031.
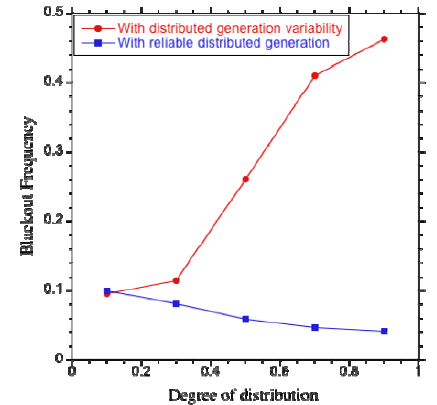
Figure 18: BLACKOUT FREQUENCY and SIZE (figure 19, not shown, similar to above) Increases Greatly With Highly Variable Distributed Generation, decreases with Reliable Distributed Generation
Summary
This study showed that in some cases, increasing the proportion of variable distributed generation could actually increase the long-term frequency of the largest blackouts. If the decentralized generation is highly variable, as is the case with wind and solar power, the operation of the grid can be severely degraded. This may increase the probability of large blackouts and a higher frequency of failures.
One potentially problematic scenario is that as the early penetration of distributed generation comes on line, it will actually make the system more reliable and robust since it will effectively be adding to the capacity margin. However, as new distributed generation is added, the system could become much less reliable as the demand grows, the fraction of distributed generation grows, and the capacity margin falls back to historical, mandated levels.
Possible trigger events that can lead to a blackout include short circuits due to lightning, tree contacts, or animals, severe weather, earthquakes, operational or planning errors, equipment failure, or vandalism.
The worst case occurs when highly centralized high-variability generation, such as large wind farms, are added without the necessary increase in generation margins.
Large blackouts pose a substantial risk that must be mitigated to maintain the high overall reliability of an electric power grid. As the control of the power grid becomes far more complex with the increasing penetration of new generation sources such as wind and solar power and new electric loads such as electric cars, maintaining high reliability of the electric grid becomes even more critical.
Generator capacity margin or generation variability leveling mechanisms are critical to reducing the degradation that can be caused by the increased penetration of sustainable distributed generation.
The backbone of electric power supply is the high-voltage transmission grid. The grid serving California is part of the larger Western Interconnection, administered by the Western Electricity Coordinating Council (WECC), which extends from the Mexican border well into Canada and from the Pacific coast to the Rocky Mountains.
The western power grid is an impressively large and complex structure. The full WECC interconnection system comprises 37 balancing authorities (BAs), 14,324 high-and medium-voltage transmission lines, 6,533 transformers, 16,157 buses (8,230 are load buses), and 3,307 generating units. The grid has 62 major transmission paths between different areas.
While the extent of this grid provides it with certain reliability benefits, it also adds vulnerabilities because it provides multiple paths for any local disturbance to propagate. This is the problem of cascading failure; a series of failures occur, each weakening the system further, making subsequent failures more likely.
System cascading failures may occur due to the loss of several important elements, such as multiple generating units within a power plant, parallel transmission lines or transformers and common right-of-way circuit outages. The failure of these elements may widely propagate through the interconnected power network and result in a local or wide-area blackout. These kinds of failures that cause severe consequences are initiating events to a cascading failure.
The electrical transmission system of California, like all interconnected transmission systems, is vulnerable to extreme events in which complicated chains of exceptional events cascade to cause a widespread blackout across the state and beyond.
A reliable transmission grid is essential for enabling transition to renewable energy sources and electric cars, especially as the grid itself evolves toward a “smart” infrastructure.
The high voltage transmission grid for California is part of the larger western power grid, a complicated and intricately coordinated structure with hundreds of thousands of components that support the electrical supply and hence the way of life for California citizens, business, and government.
Although the transmission grid is normally very reliable, extreme events in which disturbances cascade across the grid and cause large blackouts do occasionally occur and result in direct costs to society amounting to billions of dollars.
There is an evident need to expand the list of initiating events to reflect the complexities of modern power systems as well as new factors such as the increasing penetration of variable renewable generation resources, demand-side load management, virtual and actual consolidation of balancing authorities, new performance standards, and other factors.
Excerpts:
These large blackouts always have a substantial impact on citizens, business and government. Although these are rare events, they pose a substantial risk. Much is known about avoiding the first few failures near the beginning of a cascade event series, but there are no established methods for directly analyzing the risks of the subsequent long chains of events. The project objective is to find ways to assess, manage, and reduce the risk of extreme blackout events. Since this is a difficult and complex problem, multiple approaches are pursued, including examining historical blackout data, making detailed models of the grid, processing simulated data from advanced simulations, and developing and testing new ideas and methods. The methods include finding critical elements and system vulnerabilities, modeling and simulation, quantifying cascade propagation, and applying statistical analyses in complex systems. The project team combines leading experts from industry, a national laboratory, and universities.
Although such extreme events are infrequent, statistics show that they will occur. The electric power industry has always worked hard to avoid blackouts, and there are many practical methods to maintain reliability. However, the cascading- failure problem is so complex that there are no established methods that directly analyze the risk of the large blackouts. The overall project objective is to assess the risk of extreme-blackout events and find ways to manage and reduce this risk. Managing the risk of extreme events such as this is particularly important as society moves toward environmental sustainability.
From the area of operations, the researchers found that the average fractional load (the load divided by the limit) of the transmission lines is a good representation for the risk of large failures. If this average is kept below about 50%, the probability of large failures appears to decrease. This in turn has major implications for the ratepayer; operating at less than 50% of line capacity would lead to improved reliability for the users but would probably require investment in both the transmission capacity and demand-side control.
Researchers found that decentralized generation can greatly improve the reliability of the power transmission grid. However, if the decentralized generation is highly variable, as is the case with wind and solar power, the operation of the grid can be severely degraded. This may increase the probability of large blackouts and a higher frequency of failures. The project results suggest that one of the critical factors is the generation margin. If high-variability non-centralized generation is brought on-line as an increase in the generation capacity margin, it is likely to improve the network robustness; however, if over time that margin declines again (as the demand increases) to the standard value, the grid could undergo a distinct decline in reliability characteristics. This suggests a need for care in planning and regulation as this decentralization increases. The worst case occurs when highly centralized high-variability generation, such as large wind farms, are added without the necessary increase in generation margins. Increased use of de-centralized generation in the system has numerous effects on the ratepayer, from decreased electricity costs and increased reliability, if implemented carefully, to decreased reliability and an accompanying increase in costs, if not.
CHAPTER 1: Introduction
On August 10, 1996, a blackout started in the northwestern United States and cascaded to disconnect power to about 7,500,000 customers over the West Coast, including millions of customers in both northern and southern California. Power remained out for as much as 9 hours, snarling traffic, shutting down airports and leaving millions in triple- digit heat. An initially small power-system disturbance, a sagging power line, cascaded into a complicated chain of subsequent failures leading to a widespread blackout. Although such extreme events are infrequent, historical statistics show they will occur. The resulting direct cost is estimated to be in the billions of dollars, not including indirect costs resulting from social and economic disruptions and the propagation of failures into other infrastructures such as transportation, water supply, natural gas, and communications.
Line-Trip Data. The transmission line outage data set consists of 8864 automatic line outages recorded by a WECC utility over a period of ten years. This is an example of the standard utility data reported to NERC for the Transmission Availability Data System (TADS). The data for each transmission line outage include the trip time. More than 96% of the outages are of lines rated 115 k V or above. Processing identified 5227 cascading sequences in the data. Some of these cascades are long sequences of events, but most are short.
CHAPTER 4: Extreme Event Risk. Anatomy of Cascading Failure
Cascading failure can be defined as a sequence of dependent events that successively weakens the power system. The events are often some individual power system component being outaged or damaged or mis-operating, but can also include a device functioning as designed but nevertheless contributing to the cascade, or actions by operators, software, or automatic controls. As shown in Figure 6, cascading failure starts with a trigger event and proceeds with further events. All the events interact with the system state as the cascade proceeds. The occurrence of each event depends on the system state, and the system state is affected by every event that has already occurred, and thus the system state changes throughout the cascade. The progressive weakening of the system as the cascade propagates is characteristic of cascading failure.
Possible trigger events include short circuits due to lightning, tree contacts, or animals, severe weather, earthquakes, operational or planning errors, equipment failure, or vandalism. The system state includes factors such as component loadings, which components are in service, generation margin, hidden failures, situational awareness, and weather.
The triggers and the subsequent propagation of events have different mechanisms, so that different approaches are needed to mitigate the triggers or mitigate the propagation. Moreover, the triggers and the propagation have different effects on the risks of small, medium, and large blackouts, so that managing these risks may require different combinations of mitigations for triggers and/or propagation. Limiting the triggers and initiating events reduces the frequency of all blackouts, but can in some cases actually increase the occurrence of the largest blackouts, whereas limiting the propagation tends to reduce the larger blackouts, but may have no effect on the frequency of the smaller events.
The notions of causes (and blame) often can become murky in complicated cascades. For example, it is possible that automatic or manual control decisions that are advantageous in many standard system operational states and are overall beneficial may occasionally be deleterious.
Probabilistic Approach to Simulation of Rare Events Cascading
Failure in power systems is inherently probabilistic. There are significant uncertainties in the initial state of the power system, in the triggering events, and in the way that the cascading events propagate or stop. The initial state of the power transmission system is always varying and includes factors such as patterns of generation and loading, equipment in service, weather, and situational awareness. Examples of trigger events are lightning, earthquakes, shorts involving trees and animals, equipment failure, and operational errors. The progress of cascading events depends on exact conditions and thresholds, can be very complicated, and can involve combinations drawn from dozens of intricate mechanisms, some of which involve unusual or rare interactions, that span a full range of physical and operation al factors. It is appropriate to understand all these uncertainties probabilistically. Large black outs are particular samples from an astronomically large set of possible but unusual combinations of failures. From a modeling perspective, the underlying probabilistic view is driven by several factors. It is impossible to enumerate all the possible large blackouts because of the combinatorial explosion of possibilities. While some selected mechanisms of cascading failure can be usefully approximated in a simulation, it is well beyond the current state of the art to represent all or even only the physics- based) mechanisms in great detail in one simulation. The full range of power system phenomena involved in cascading failure occur on diverse time-scales, and obtaining the full data (such as fast dynamical data) is difficult for the large-network cases needed to study large cascading blackouts. Most important, such a simulation, even if otherwise feasible, would be too slow.
In WECC, one could consider small blackouts to be less than 100 MW load shed, medium blackouts to be between 100 MW and 1000 MW load shed, and large blackouts to be more than 1000 MW load shed. The historical data implies that large blackouts are rarer than medium blackouts, but that the large blackouts are more risky than the medium blackouts because their cost is so much higher.
Based on these cost assumptions, a rough calculation of large and medium blackout risk can be made. The NERC WECC blackouts are divided into small (<100 MW) medium (100 – 1000 MW) and large blackouts (>1000 MW). The largest recorded blackout is 30,390 MW. Small blackouts are not systematically covered by the reported data and are put aside. According to the data, the large blackouts have about 1/3 the probability of the medium blackouts. The average large blackout is roughly 8 times the size of the average medium blackout, so its cost is roughly 20 times larger. Since risk is probability times cost, the risk of an average large blackout is roughly 7 times the risk of an average medium blackout.
CHAPTER 5: Results, Analysis, and Application to California and the Western Interconnection
Selection of Initiating Events Power
System cascading failures may occur due to the loss of several important elements, such as multiple generating units within a power plant, parallel transmission lines or transformers and common right-of-way circuit outages. The failure of these elements may widely propagate through the interconnected power network and result in a local or wide-area blackout. These kinds of failures that cause severe consequences are initiating events to a cascading failure.
Some of the selected initialing events are in NERC Category D. Such events are not routinely analyzed by system planners and operators due to the complexity of such events. The selection of initiating events is a critical step in accurately simulating and analyzing large-scale cascading failures. Successful identification of initiating events can help effectively identify the most severe disturbances and help system planners propose preemptive system reinforcements that will improve both the security and the reliability of the system.
Analyzing too few initiating events may not be sufficient to reveal critical system problems. At the other extreme, scanning all combinations of initiating events in a bulk power system is computationally impossible. As an example, the Western Interconnection contains approximately 20,000 transmission lines. Screening all combinations of N-2 contingencies requires approximately 199,990,000 simulation runs, which is beyond the capability of available simulation tools; for example, if time per run were 90 seconds, the total run time would be about 570 years. Currently, only 5-50 contingencies are selected annually to perform extreme event analysis to comply with NERC requirements in the WECC system. The selections of these contingencies are based on the experience of power grid operators and planners, that is, knowing critical elements in their systems. This limited set of events is included in the list created in this study. In this study, eight categories of initiating events were collected for the entire WECC system from multiple sources such as historical disturbance information, known vulnerable system elements, engineering judgment, transmission sensitivity analysis methods and others. A large list with more than 35,000 initiating events was created for the full WECC model. The different types of initiating events are summarized below.
Substation Outage. This type of initiating event considers the complete loss of a substation (bus) in the WECC model. It is used to simulate extreme events that result in a complete outage of all elements within a substation. 8,000 initiating events in this category were generated considering all substations with voltage levels higher than 115 kV.
The Loss of Two Transmission Lines Based on Contingency Sensitivity Study
Parallel Circuits Transmission Line Outage. Many of the higher-kV lines are made of two or more circuits on a common tower to increase their transmission capacity. However, during catastrophic events such as thunderstorms, lightning strikes or tornadoes, all the circuits of a multi- circuit transmission line can be out of service leading to huge power- transfer capacity loss. This contingency list considers all the transmission lines that have two or more parallel circuits originating and ending on the same buses. 996 initiating events in this category were collected.
Common Right of Way and Line Crossings Outage. This outage list contains common corridors or common right-of-way (ROW) lines. Common ROW is defined by WECC as “Contiguous ROW or two parallel ROWs with structure center-line separation less than the longest span of the two transmission circuits at the point of separation or 500 feet, whichever is greatest, between the two circuits” events is very important since the right-of- way lines generally fall within similar geographical areas and any natural calamity can easily cause the outage of these transmission lines.
Flow Gates between Balancing Authorities. The flow gates between various balancing authorities represent important transmission-path gateways transporting large amounts of power. Loss of a flow gate can cause major problems for a balancing authority, especially if the BA is normally a power importer without sufficient local generation to meet demand. 54 initiating events in this category were collected.
Major Transmission Interfaces in the WECC System. This event considers outages of major transmission interfaces or paths between different major load and/or generation areas as identified in WECC power-flow base planning case. These interfaces are the backbone of the WECC power grid, and the loss of any of these paths can have large impact. 62 initiating events in this category were collected
Critical Events Corridors Analysis. Although no two blackouts follow the same sequence of events, similar partial sequences of cascading outages may exist in a particular power system. Partial patterns in which transmission lines, generators or buses are forced out in a certain order can repeatedly appear across a variety of initiating events and system conditions. These patterns can result from multiple different initiating events, and therefore are seen as parts of different cascading processes. Figure 9 illustrates the hypothesis of these “critical event corridors.” Critical-corridor identification can be used to recommend transmission-system enhancements, protection-system modification, and remedial actions to help eliminate these most frequently observed, and therefore most probable, critical sequences that lead to severe consequences.
Selection of optimal locations for high penetration of renewables to minimize effects on system reliability; if location choice is not under control of the BA, results can point out potential extreme events due to the concentration of renewable resources in few locations
Finding Line Clusters That Are Critical During Propagation Finding
The triggers for a large blackout is only the first step. Most large blackouts have 2 distinct parts, the triggers/initiating event followed by the cascading failure. The cascade can be made up of as few as one subsequent stage or as many as dozens or even hundreds of stages. The cascading part of the extreme event is critically dependent on the “state” of the system: how heavily the lines are loaded, how much generation margin exists, and where the generation exists relative to the load. However, during large cascading events there are some lines whose probability of overloading is higher than the others. Statistical studies of blackouts using the OPA code allow the identification of such lines or groups of lines for a given network model, thereby providing a technique for identifying at risk (or critical) clusters. These lines play a critical role in the propagation of large events because they are likely to fail during the propagation of the cascade, making it more likely that the cascade will propagate further and turn into an extreme event. Therefore, it is clearly very important to identify them.
System State Parameters That Correlate With Large Blackouts. In a complex system, extreme events may be triggered by a random event. However, the much- higher-than-Gaussian probability of extreme events (the heavy tail) is a consequence of the correlations induced by operating near the operational limits of the system and has little to do with the triggering events. The result is that the extreme-event distribution is independent of the triggering events. Therefore, trying to control the triggering events does not lead to a change of the power-tail distribution. A careful reduction of triggering events may reduce the frequency of blackouts but will not change the functional form of the size distribution. The process of trying to plan for and mitigate the triggering events can in fact lead to a false sense of security since one might think one is having an effect on risk by doing so when in reality, the unexpected triggers which will certainly occur will lead to the same distribution of blackout sizes.
In these complex systems, an initiating event cannot be identified by just the random trigger event, but by the combination of the triggering event and the state of the system. This “state of the system” can be characterized by different measurements of the parameters of the system. In the case of power systems, for example, the system state includes the distribution and amounts of loads and power flows in the network. A simulation model like OPA is continually changing the network loading and power flows. This, importantly, gives a large sample of initiating events. The statistics of the results reflect many combinations of initial events and system states. It is also important to distinguish between blackout initiating events and general cascade initiating events. In power systems, a cascade, in particular a very short cascade, does not always lead to a blackout. Therefore, those two sets of initiating events are different. Within the OPA simulations, a blackout is defined as any event in which the fraction of load shed is greater than 0.00001. However, for comparison with the reported data we use fraction of load shed being greater than 0.002, which is consistent with the NERC reporting requirements from emergency operations planning standard EOP-004-1.
In calculating the probability of a blackout occurring, good measures include the number of lines overloaded in the first iteration, the average fractional line loading every day, the variance of the fractional line loading every day, and the number of lines with a fractional line loading greater than 0.9. They all show strong positive correlation with the probability of a blackout. When a blackout occurs, the size of the blackout correlates strongly with the number of lines overloaded in the initiating state. This is a very clear correlation. The size also has a positive correlation with the average fractional line loading every day, variance of the fractional line loading every day, and the number of lines with a fractional line loading greater than 0.9 (Figure 16).
Having found a number of system parameters that strongly correlate with blackout probability, and even more importantly with extreme event size, it is possible to consider monitoring these quantities in the real system. The goal there would be to see (1) whether they show variations that are meaningful and the same correlations exist, and (2) if so, whether the noise level is low enough to make any of them useful as a precursor measure- the ultimate objective of the work in this section.
Impact of Distributed Generation
The increased utilization of local, often renewable, power sources coupled with a drive for decentralization, the fraction of electric power generation that is “distributed” is growing and set to grow even faster. It is often held that moving toward more distributed generation would have a generally positive impact on the robustness of the transmission grid. This intuited improvement comes simply from the realization that less power would need to be moved long distances, and the local mismatch between power supply and demand would be reduced.
The project approached the issues of system dynamics and robustness with this intuitive understanding in mind and with the underlying question to be answered, “is there an optimal balance of distributed versus central generation for network robustness?” In the interest of understanding the effects of different factors, the investigation was initiated by intentionally ignoring the differences in the economics of centralized vs. distributed generation and trying to approach the question in a hierarchical manner, starting from the simplest model of distributed generation and then adding more complexity.
Using OPA to investigate the effects of increased distributed generation on the system, it was found that:
- Increased distributed generation can greatly improve the overall “reliability and robustness” of the system.
- Increased distributed generation with high variability (such as Wind and Solar) can greatly reduce overall “reliability and robustness” of the system, causing increased frequency and size of blackouts.
- Generator capacity margin or generation variability leveling mechanisms are critical to reducing the degradation that can be caused by the increased penetration of sustainable distributed generation.
Figure 18 shows the blackout frequency as the degree of distribution (a surrogate for the amount of distributed generation) is increased. It can be clearly seen that with reliable distributed generation (same variability as with central generation) the overall blackout frequency decreases, while Figure 19 shows a concomitant decrease in the load-shed sizes as the degree of distribution increases. However, Figures 18 and 19 show a large increase in both the frequency and size of the blackouts when using distributed generation with realistic variability. In some cases, the distributed generation can make the system less robust, with the risk of a large blackouts becoming larger. It is clear that distributed generation can have a range of effects on the system robustness and reliability, coming from the reliability of the generation (wind, solar, and so forth), the fraction that is distributed and the generation capacity margin.
Figure 18: Blackout Frequency Decreases with Increased Reliable Distributed Generation but Increases Greatly With Increased Highly Variable Distributed Generation
One potentially problematic scenario is that as the early penetration of distributed generation comes online, it will actually make the system more reliable and robust since it will effectively be adding to the capacity margin. However, as new distributed generation is added, the system could become much less reliable as the demand grows, the fraction of distributed generation grows, and the capacity margin falls back to historical, mandated levels.
Predicting Extent of Blackout Triggered by an Earthquake
This section summarizes the project results about the size of blackouts triggered by earthquakes. Chapter 6.5.5 of the Phase 1 report gives details. If there is a large initial shock to the power system such as from an earthquake, what is the risk of the failure cascading to other regions of the WECC? This is an important question because the time required to restore electric power and other infrastructure in the region that experienced damaging ground motion depends on how far the blackout extends. Long restoration times would multiply the consequences of the direct devastation not only to conventional measures such as load loss but also to restoration of lifeline services. Since earthquakes can produce orders of magnitude more costly damage than a blackout, any prolongation of earthquake restoration due to the blackout cascading beyond the shaken region has a significant effect.
The project made an illustrative calculation of the blackout extent as measured by number of lines tripped as a result of a large shock to the system in which initially 26 lines outaged based on a real earthquake scenario. The calculations assumed and applied the branching-process model and observed propagation. (Figure 22) shows an initial estimate of the distribution of the total number of lines tripped due to the combined effect of the earthquake and subsequent cascading. The most likely extent is about 90 lines tripped, but there is a one-in-ten chance that more than 150 lines would trip. This initial estimate is illustrative of probable outage scenarios. A detailed examination of actual earthquake initiating failures and line-trip propagation data would be required to improve it. Similar calculations would be feasible for other large disturbances such as extreme weather events, wildfires or floods.
Additional Types of Initiating Events. There is an evident need to expand the list of initiating events to reflect the complexities of modern power systems as well as new factors such as the increasing penetration of variable renewable generation resources, demand-side load management, virtual and actual consolidation of balancing authorities, new performance standards, and other factors.
Impact of Distributed Generation. The project studied the impact of increased distributed generation on cascading failure risk with the OPA simulation. The results of this work suggest that a higher fraction of distributed generation with no generation variability improves the system characteristics. However, if the distributed generation has variability in the power produced (and this is typical of distributed generation sources such as wind or solar), the system can become significantly less robust with the risk of a large blackouts becoming much larger. It is possible to find an optimal value of the fraction of distributed generation that maximizes the system robustness. Further investigations with different models of the reduced reliability of the distributed generation power and different distributions of the distributed generation would be worthwhile, as would the extension of this work to the larger WECC models.
Historical Data
North American Electric Reliability Corporation (NERC) has made public data for reportable blackouts in North America. Blackouts in the WECC for the 23 years from 1984 to 2006 have been analyzed. The 298 blackouts in the WECC data occur at an average frequency of 13 per year. The main measures of blackout size in the NERC data that are used in the project are load shed (MW) and number of customers affected. Blackout duration information is also available, but the data quality is less certain.
The NERC data follows from government reporting requirements. The thresholds for the report of an incident include uncontrolled loss of 300 MW or more of firm system load for more than 15 minutes from a single incident, load shedding of 100 MW or more implemented under emergency operational policy, loss of electric service to more than 50,000 customers for 1 hour or more, and other criteria detailed in the U.S. Department of Energy forms EIA-417 and OE-417.