
DOE 2014 Wind vision a new era for wind power in the United States
Many potential sites with high quality wind energy resources have minimal or no access to electrical transmission facilities.
From the perspective of planning reserves, wind power’s aggregated capacity value in the Study Scenario was about 10–15% in 2050 (with lower marginal capacity value), thereby reducing the ability of wind compared to other generators to contribute to increases in peak planning reserve requirements. In addition, the uncertainty introduced by wind in the Study Scenario increased the level of operating reserves that must be maintained by the system.
Transmission constraints result in average curtailment of 2–3% of wind generation,
With wind penetration increasing to the levels envisioned under the Study Scenario, the fossil fleet’s role to provide energy declines while its role to provide reserves increases.
At the end of 2013, out of a global 318 GW wind power capacity, offshore wind was 2.2% (7 GW), mainly in Europe, with a small amount installed in Asia.
Wind power is capital intensive, which makes costs for wind highly sensitive to the cost of capital. In the United States, the weighted average cost of capital available to wind project sponsors is artificially inflated by the fact that federal incentives for wind power development are delivered through the tax code.
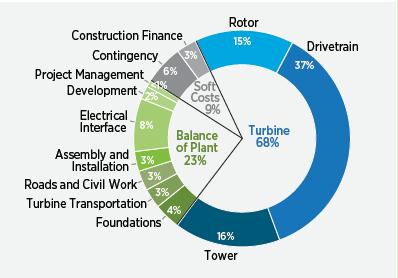
Figure 2-8. Components of installed capital cost for a land-based, utility-scale reference wind turbine. Source: Tegen, S.et al. 2013. Cost of Wind Energy Review. National Renewable Energy Laboratory
Operations and Maintenance (O&M) Costs
Market data on actual project-level O&M costs are not widely available. [My translation of what that means? This is why it’s hard to know the real EROI and cost of wind projects, since these are kept secret so that wind subsidies and investment money can be found].
O&M costs are an important component of the overall cost of wind power and can vary substantially among projects. Anecdotal evidence and analysis suggest that unscheduled maintenance and premature component failure in particular challenge the wind power industry. O&M costs generally increase as projects age.
a recent report found U.S. wind O&M costs comprise scheduled maintenance (20.5%), unscheduled maintenance (47.7%), and balance of system (31.9%).
O&M is around 25% of lifetime turbine costs and levelized replacement costs are 30% of O&M.
Low Natural Gas prices have pushed demand for wind power down
The increase in natural gas reserves enabled by advances in horizontal drilling and hydraulic fracturing has been among the more important energy supply-side developments impacting wind power. In response to this new supply (along with tepid demand from a sluggish economy), natural gas prices have fallen dramatically from their peak in mid-2008, prompting a considerable amount of fuel-switching in the power sector. The share of natural gas-fired generation in the U.S. power mix increased from 21% in 2008 to 27% in 2013, while coal-fired generation declined from 48% to 37% over this same period. Though coal prices have remained relatively steady, these developments with natural gas have pushed wholesale power prices down from the highs seen in 2008, resulting in increased competitive pressures for wind power.