
NREL. July 2012. U.S. Renewable Energy Technical Potentials: A GIS-Based Analysis. National Renewable Energy Laboratory.
This document is a thought experiment that uses GIS mapping to estimate how much renewable power could possibly be generated in each state regardless of cost, distance from transmission infrastructure, reliability or time-of-dispatch, current or future electricity loads, etc.
Solar and wind are the largest renewable resource base in the United States and not surprisingly would need to contribute about 90% of renewable power in a world without fossil fuels, since geothermal, hydropower, and biomass are extremely limited by both location and potential power generation.
But wind and solar both have very low capacities and are very seasonal. The EIA only has 4 months of data on Solar PV, but so far it’s ranged from a capacity of 23.3% in November 2014 to 33.1% in September 2014, and solar CSP has ranged from 13.1% in November 2014 to 25.9% in September 2014 (EIA).
Wind capacity has ranged from 21.8% in August 2013 to 43% in April 2014, when power is least needed in states with hydropower, because this is when hydroelectric power is at its best from rain and snow-melt due to it’s need to be released from full reservoirs so they don’t overflow dams. Wind blows mainly in the winter so for the rest of the year wind will not be able to provide much power, especially in the summer.
In contrast, nuclear power was up 99.2% of the time in January 2014, and other fossil plants also had high capacities – it’s hard to imagine how the electric grid can run 24 x 7 in the future on 90% wind and solar without storage.
Clearly most of the potential power identified could never be built because of cost, being too far from cities and towns, a lack of transmission lines, inability of enough flexible generation to balance uncertain, unreliable, and unpredictable wind and solar power, and at over 50 percent renewables, additional generation would be difficult without enough energy storage and the geothermal, hydropower, or biomass power to balance wind and solar (when supply and demand don’t match within 1% or less, the electric grid comes down).
Locations were restricted somewhat by areas such as national parks and marine sanctuaries, onshore wind net capacity factor must be 25.5% or more, solar PV and CSP on slopes 3% or less, and other factors were used to restrict the areas.
In the real world, most of these resources would not be built because their capacity isn’t high enough (class 3 or higher wind), or they’re too far from the transmission grid. It costs an average of $3 million dollars per mile to build transmission lines, which lose 3 to 10% of power the longer the distance traveled or the lower the generation power of the wind or solar farm.
In a resource-constrained world it is likely that states will not want to share their power with other states. This is manifested already by how hard it is to get transmission lines to cross state borders. States prefer to keep their power within-state.
States east of the Rockies don’t have enough renewable power for 100% fossil-free electricity generation
What’s of interest in the maps below is the paucity of wind and solar resources the states east of the Rockies have. All of the states east of the Rockies (36 states) except for Texas are in the eastern interconnection part of the electric grid, where 70% of the population lives. The Midwest has wind power, but expanding the grid to send it to the east coast would cost hundreds of billions of dollars. States tend to keep power generation within their borders, and it can take ten years to overcome opposition to transmission lines and towers, especially if they’re going to cross state lines to deliver power elsewhere.
The 11 western states (WECC) don’t have enough prime and non-prime resources to replace existing fossil fuel and nuclear plants despite having more energy resources than the eastern connection, so it’s very unlikely that even if a super-grid were built they’d send electricity to the Eastern connection. Yet 7 of these western states are the only place that solar CSP can be built, and without solar CSP WITH THERMAL STORAGE, there is no way tobalance wind and solar PV with renewable power, since there’s not enough pumped hydro or compressed air energy storage locations in the United States.
Only Texas (ERCOT), its own island of power, has much wind and solar power, but whether there’s enough and if it can be balanced with hydropower or solar CSP and energy storage is unclear.
Below are maps of the USA with 89% of their potential from the three main sources of renewable power: Rural utility-scale PV (58%), Concentrating Solar Power (24%), and onshore wind (7%). Not shown are energy resources with less than 1% contributions (urban utility-scale PV .5%, Rooftop PV .2%, Biopower .1%, hydrothermal .1%, or hydropower .1%). Enhanced geothermal was stated as contributing 6%, but it’s commercial yet and may never be. Offshore wind was put at 4%, but corrosion, a short 15-year-lifespan, enormous cost, extreme intermittency, and other factors make offshore wind unlikely to contribute 4% of power.
In the real world, only the best resources are likely to be developed at a few locations in the darkest colored states.
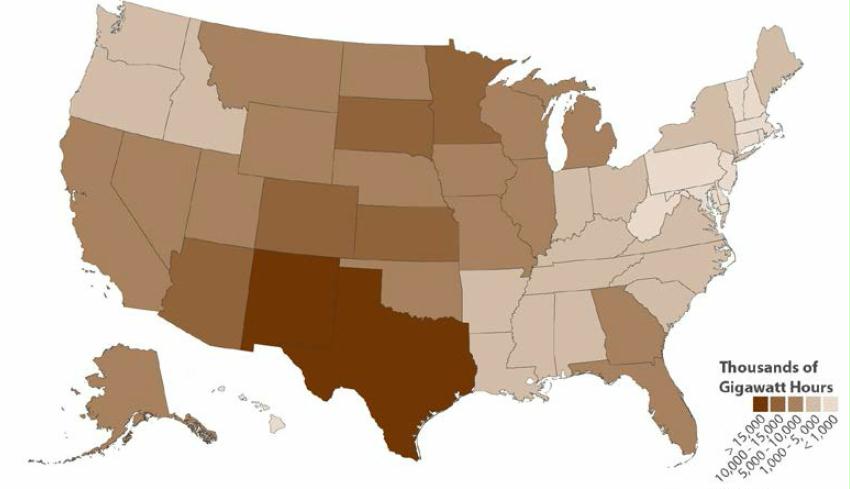
58.2% Figure 3. Total estimated technical potential for rural utility-scale SOLAR PV in the United States
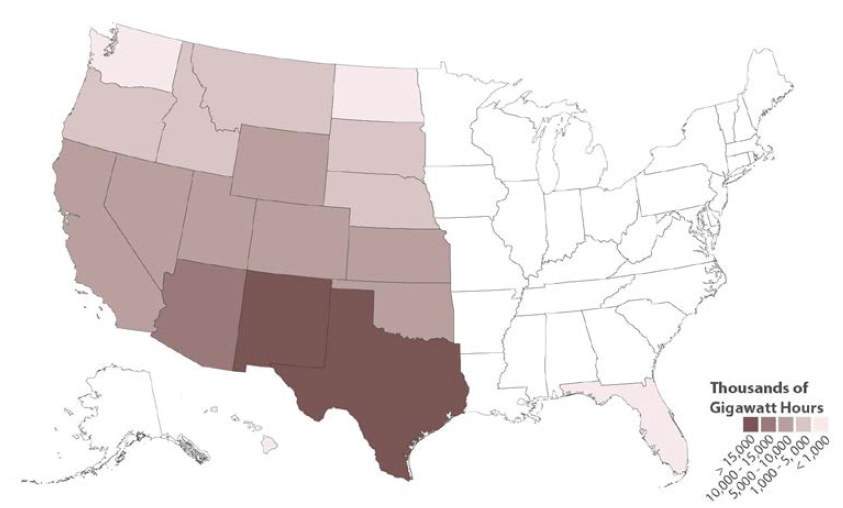
24.1% Figure 5. Total estimated technical potential for concentrating solar power (CSP) in the United States. NOTE THE LACK OF CSP in most of the eastern half of the USA. In a grid with mostly renewable power, CSP with thermal storage is the only renewable energy that can balance intermittent wind power/ solar and fill in for solar PV when the sun goes down or wind dies, aside from very limited amounts of biomass (which at best can contribute .1% of overall TWh assuming it all goes to generating electricity and not for biofuels or chemicals). How can Jacobson possibly claim that solar CSP can contribute 10% of renewable power in New York?
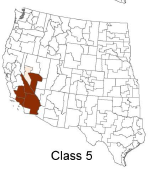
The only likely CSP plants to be built are in areas with at least class 5 potential because they are incredibly expensive (i.e. Ivanpah which cost $2.2 billion but only produces 100 MW and has NO STORAGE because there’s so little water in the desert — this document does not address the water issue with CSP in the 6 states with the best CSP potential).
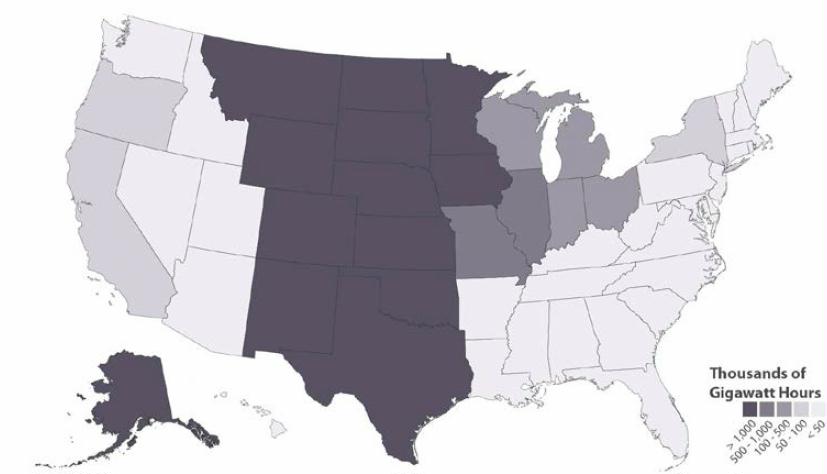
6.8% of total TWh. Figure 6. Total estimated technical potential for onshore wind power in the United States. 4 of these states are in the WESTERN (WECC) connection and Texas is on its own, so these 5 states are not going to be sending their wind to the eastern connection, which is severely lacking in wind (and solar) power.
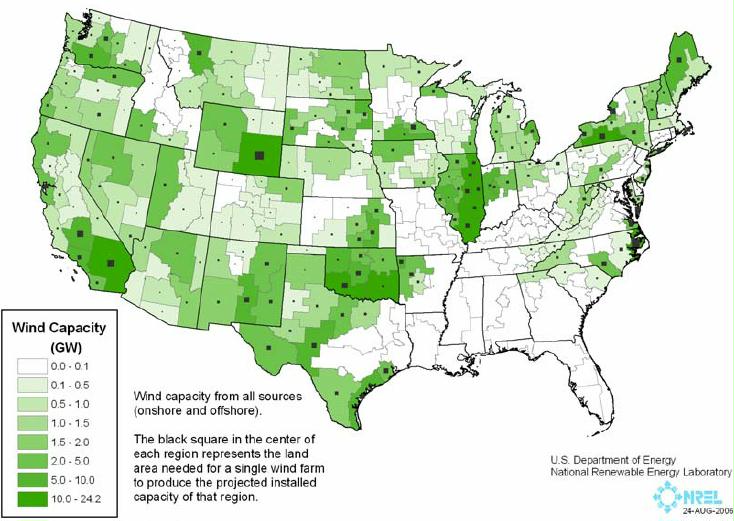
Figure 13. Wind capacity installed by region representing a total installed wind capacity of 284 GW, which corresponds to about 20% of projected electricity demand.
This figure is not realistic. For example, Northern California only has offshore wind power, but it is far from the transmission grid, and the depth of the ocean offshore is so deep, that offshore wind isn’t being built along the entire west coast. Much of norther California is off limits because the size of coastal sanctuaries was doubled in March of 2015.
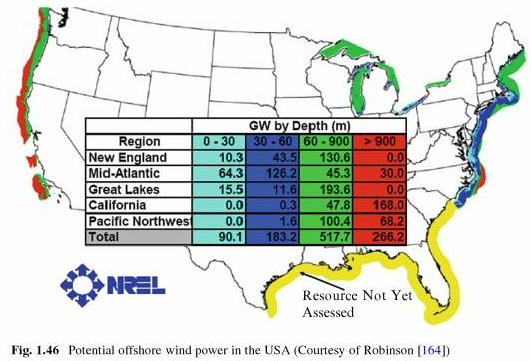
In the USA, the wind resource increases significantly if the depth of the water is extended to 900 m (~3,000 feet or more deep). In May 2008, the U.S. Department of Energy (DOE) released a report detailing a deployment scenario by which the United States could achieve 20% of its electric energy supply from wind energy (U.S. Department of Energy 2008). Under this scenario, offshore wind was an essential contributor, providing 54 gigawatts of installed electric capacity to the grid. To achieve the deployment levels described in the 20% wind report, many technical and economic challenges must be faced. Many coastal areas in the United States have large electricity demand but have limited access to a high-quality land-based wind resource, and these areas are typically limited in their access to interstate grid transmission. Most offshore wind is 6.2 miles offshore, so the green 60-900 m areas may not always be potential sites (NREL 2010).
Over 80% of California’s potential offshore 587.8 GW of power is 13.8 to 57.5 miles offshore in water over 60 m (197 feet) deep over 36,400 square miles (most of which not unavailable due to protected marine areas, in marine vessel lanes, too far from grid to develop, and water too deep to build offshore windmills). The other 17% is in water over 197 feet deep 3.5 to 13.8 miles offshore.
It gets better. The windmill is going to rise another 300 feet above the surface. The world’s tallest building is the 2,700 foot Burj Khalifa in Dubai, United Arab Emirates. These windmills would be 3,300 feet tall, or taller.
Figure 13 above shows that much of the east is a wind desert. Plans for a national grid appear to have been abandoned for many reasons, this is why energy storage is the new “in thing”. One of the main reasons is that states control power generation and they are not going to cede that to the Federal government, nor are states going to build transmission across state lines and export their in-state generated power to other states, especially not when oil and other fossil fuels decline! Another sign that a national transmission grid has been abandoned is that NREL is now proposing.
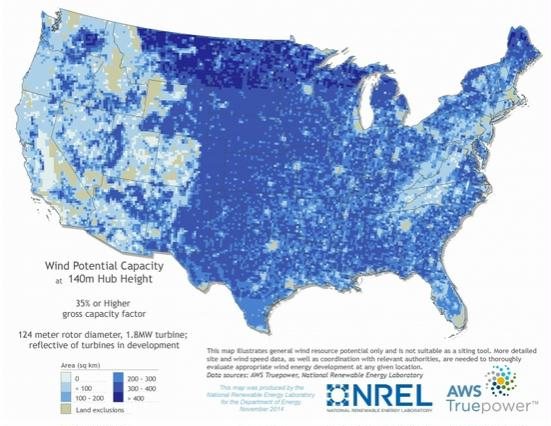
Now that a national transmission grid appears to be out of the picture, EERE has gotten so desperate to overcome the wind desert in the southeast and most of the east coast (except for offshore) that they’re proposing monster “tower of Babel” sized wind turbines 459 feet high (140 meters) with blades over 200 feet long to get what little wind does move high above these states.
These 140 meter turbines would cost 4 times as much as a 100 meter tower and the trucking cost would be more as well.
There are 85 cranes in the U.S. capable of lifting a 140 meter hub 600 metric ton turbine, but only 10 capable of lifting the 1,250 to 1,6000 metric tons if a 150-160 meter hub turbine, and these cranes are nearly 41 feet wide, more than a 2-lane interstate highway including shoulders and requires more than 100 semi-tractor trailers to transport it between projects making transportation between turbines difficult and costly (DOE 2014 figure 2-39 and table 2-6 page 82).
“It is estimated that enabling cost-effective deployment of next generation wind turbines with hub heights of 140 meters will unlock additional wind power resource potential across 1,137,565 square miles of the United States, nearly tripling the amount of developable land area for U.S. wind when compared with 2008 turbine technology.” Some of the research and development money being offered will go towards figuring out how to transport them to their sites – this is already a challenge for turbines half this height. And also funds to figure out how to make them this large, and assemble them.
Despite Jacobson and other cornucopians (*) proposing hydrogen storage and power, about 3/4 of the power generated would be needed just to break the bonds of hydrogen and oxygen in water, leaving little power to compress hydrogen (the only way to give it power since it has none itself), store, and deliver it, all of which require a massive infrastructure that doesn’t exist.
(*) A cornucopian is a futurist who believes that continued progress and provision of material items for mankind can be met by similarly continued advances in technology. Fundamentally they believe that there is enough matter and energy on the Earth to provide for the ever-rising population of the world, and that there are no limits to growth.
NREL. 2010. Assessment of Offshore Wind Energy Resources for the United States. National Renewable Energy Lab.
U.S. Department of Energy, Energy Efficiency and Renewable Energy. 2008. 20% Wind Energy by 2030, Increasing Wind Energy’s Contribution to U.S. Electricity Supply. Executive Summary.
========================
In a world without fossil fuels, concentrated solar power WITH THERMAL STORAGE is ESSENTIAL
CSP with storage is essential to keeping the electric grid up 24 hours and to balance intermittent wind and solar since there’s not enough geothermal, hydropower, biomass, or utility-scale energy storage to do that. Solar PV peaks at noon, but the highest demand is morning and late afternoon/early evening. The wind may not be blowing at all. The power will have to come from CSP with storage. The United States is distant enough from the equator that the amount of CSP generated in the winter is not so great. So even if the West shares CSP with the East, where peak demand is in the winter, it is not going to be as much power as needed. There is also a limit to the amount of pure salts from Peru which will limit the number of CSP plants that can be built. CSP is also limited by cost – it is very expensive, takes up enormous amounts of land with less than 3% slopes to provide relatively little power.
As penetration of wind and solar PV increases, grid flexibility requirements also increase. Wind and PV begin to displace less valuable energy sources, and curtailment of these sources may increase (Denholm and Margolis 2007). Capacity value falls, particularly for PV where the demand peak is shifted to the early evening. Under these conditions, the dispatchability of CSP becomes more important, as the grid needs generation sources that can meet demand during the late afternoon and evening.
These results show that large-scale deployment of CSP (.10 GW) is dependent on some combination of substantially reduced costs and the use of its ability to provide grid flexibility. In cases where CSP shows little performance improvement and the grid uses small amounts of variable generation, CSP faces a challenging economic environment, and ReEDS shows relatively little deployment.
The need for new transmission and the remote locations of CSP resources are key challenges for large-scale deployment of CSP. One important issue is the limited demand for electricity in states with good DNI resources. While states like California are large, the overall demand in the six states with excellent DNI resources (with at least some class 3 and above) is only about 12% of total U.S. demand in 2010 (EIA 2011). This requires increasing the use of CSP in regions with lower-quality resources or building long-distance transmission to send CSP generation to surrounding regions. This will likely require building greater connection between the Western and Eastern Interconnections as the Western Interconnection as a whole represents only about 18% of total U.S. demand. Furthermore, within the Western Interconnection, CSP obviously competes with high-quality PV resources, but it also competes with good-quality wind resources, the nation’s highest-quality geothermal resources, and existing hydro.
Concentrating Solar Power: Prospects and Challenges By Michele Boyd
CSP requires a high level of clear-sky solar radiation, called Direct Normal Irradiance (DNI), in order to produce electricity at the lowest price. In the US, high DNI can be found in Arizona, California, Colorado, Nevada, New Mexico, Texas and Utah. Outside of the US, this type of intense sun can be found in the Middle East, North Africa, South Africa, Spain, Chile, China, India, Australia and Mexico.
Within areas of high DNI, there are three requirements for building CSP plants: suitable land, transmission lines, and financing. CSP requires large tracts of relatively flat land with minimal environmental or cultural conflicts, such as endangered species or native artifacts. The Department of Interior has identified 17 solar energy zones (SEZs), totaling approximately 285,000 acres on public lands in six Southwestern states. Most of the identified SEZs, however, do not have available transmission lines or capacity to move the electricity to cities or other demand centers. Purchasing and building on private land remains an option, but in some states, large tracts of contiguous private land appropriate for CSP plants are difficult to find.
Large CSP projects are capital-intensive. Thus long-term, low-interest loans are necessary in order to make these projects financially viable. Since the global banking system collapsed in 2008, banks are only offering short-term loans for very limited amounts per loan, which is insufficient to finance these large power projects. The cost of CSP is coming down, but it is less developed than PV and has not yet come as far down the learning curve. Research and development can help bring down the cost of CSP, but it is also necessary to build new plants to decrease costs through improving construction methods, cultivating a trained workforce, and developing a competitive supply chain.
Transmission is one of the most complex challenges to developing CSP projects in the US. Numerous federal, state and tribal agencies are involved in permitting transmission lines, which often cross multiple jurisdictions, including private lands.
DOE. 2014. Wind vision a new era for wind power in the United States. Department of Energy.
EIA. 2015. Table 6.7.B. Capacity Factors for Utility Scale Generators Not Primarily Using Fossil Fuels, January 2008-November 2014. U.S. Energy Information Administration.
4 Responses to Is there enough renewable energy to replace fossil fuel electricity generation?