
This paper (excerpts below) shows that there are limits to growth — there simply aren’t enough minerals in the world that can be produced physically and/or at a reasonable cost for the many of the most common kinds of PV being made now. The authors suggest that research ought to focus on solar PV technologies for which enough cheap, non-toxic physical material in the world is available.
Cheaper materials could be key to low-cost solar cells
By Robert Sanders, Media Relations | 17 February 2009
BERKELEY — Unconventional solar cell materials that are as abundant but much less costly than silicon and other semiconductors in use today could substantially reduce the cost of solar photovoltaics, according to a new study from the Energy and Resources Group and the Department of Chemistry at the University of California, Berkeley, and the Lawrence Berkeley National Laboratory (LBNL).
These materials, some of which are highly abundant, could expand the potential for solar cells to become a globally significant source of low-carbon energy, the study authors said.
The analysis, which appeared online Feb. 13 in Environmental Science & Technology, examines the two most pressing challenges to large-scale deployment of solar photovoltaics as the world moves toward a carbon neutral future: cost per kilowatt hour and total resource abundance. The UC Berkeley study evaluated 23 promising semiconducting materials and discovered that 12 are abundant enough to meet or exceed annual worldwide energy demand. Of those 12, nine have a significant raw material cost reduction over traditional crystalline silicon (x-Si in chart), the most widely used photovoltaic material in mass production today.
The most popular solar materials in use today are silicon and thin films made of CdTe (cadmium telluride) and CIGS (copper indium gallium selenide). While these materials have helped elevate solar to a major player in renewable energy markets, they are still limited by manufacturing challenges. Silicon is expensive to process and mass produce. Furthermore, it has become increasingly difficult to mine enough silicon to meet ever-growing consumer demand.
Thin films, while significantly less costly than silicon and easier to mass produce, would rapidly deplete our natural resources if these technologies were to scale to terawatt hours of annual manufacturing production. A terawatt hour is a billion kilowatt hours.
Kammen said. “… what we’ve found is that some leading thin films may be difficult to scale as high as global electricity consumption.”
Wadia added “ if our objective is to supply the majority of electricity in this way, we must quickly consider alternative materials that are Earth-abundant, non-toxic and cheap. These are the materials that can get us to our goals more rapidly.”
The team identified a large material extraction cost (cents/watt) gap between leading thin film materials and a number of unconventional solar cell candidates, including iron pyrite, copper sulfide, and copper oxide. They showed that iron pyrite is several orders of magnitude better than any alternative on important metrics of both cost and abundance. In the report, the team referenced some recent advances in nanoscale science to argue that the modest efficiency losses of unconventional solar cell materials would be offset by the potential for scaling up while saving significantly on materials costs.
The availability of some rare elements may limit the growth of some PV technologies. Of particular concern is tellurium used for cadmium telluride, and indium used for copper indium gallium diselenide. Tellurium is primarily extracted as a byproduct of electrolytic copper refining, and global supply is estimated at approximately 630 MT/yr. Tellurium supply is expected to increase over time based on increasing global copper demand. Indium is primarily extracted as a byproduct of zinc refining, and global supply is estimated at about 1,300 MT/yr. Nearly all of the indium supply is used to make transparent conductive oxide coatings, such as those used for flat-panel liquid crystal displays. Global indium supply is projected to increase to meet demand for non-PV applications, and potentially for PV applications as well. Currently, it takes approximately 60–90 MT of tellurium to make 1 GW of cadmium telluride, and approximately 25–50 MT of indium to make 1 GW of copper indium gallium diselenide. Competition with non-PV applications for rare materials could significantly restrict supply, particularly for indium, and could increase both material prices and price volatilities. Material feedstocks for crystalline silicon PV are virtually unlimited, and supply constraints are not likely to limit growth. However, crystalline silicon cells typically use silver for electrical contacts, which could be subject to price spikes if there are supply shortages. Source: 2014. Renewable Electricity Futures Study Exploration of High-Penetration Renewable Electricity Futures. National Renewable Energy Laboratory.
Wadia, C. et al. 2009. Materials Availability Expands the Opportunity for Large-Scale Photovoltaics Deployment. Environ. Sci. Technol. 43 2072-2077
Our analysis highlights a photovoltaic future that may not be dependent on either silicon technologies or currently popular thin films.
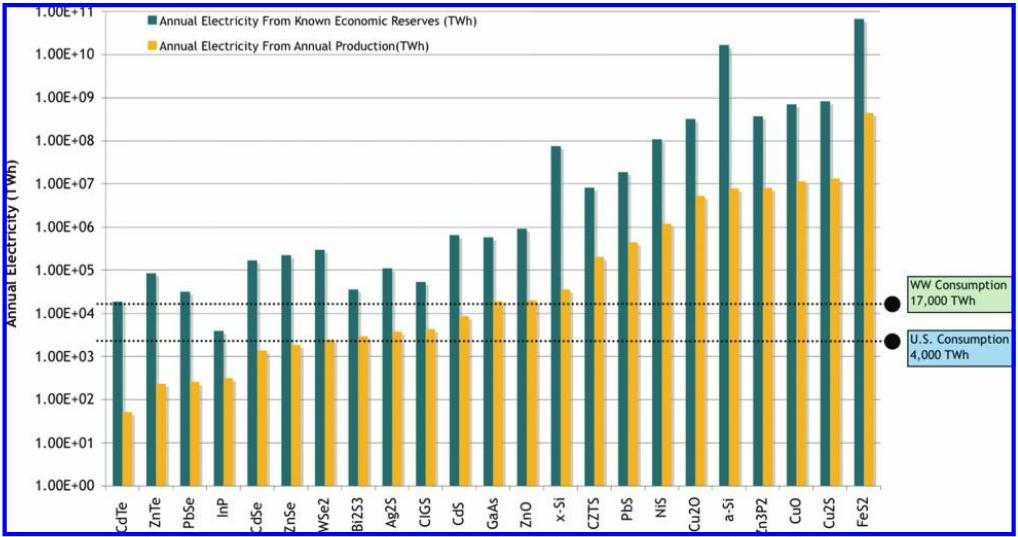
FIGURE 1. Annual electricity production potential for 23 inorganic photovoltaic materials. Known economic reserves (also known as Reserve Base) and annual production are taken from the U.S. Geological Survey studies 21 . Total U.S. and worldwide annual electricity consumption are labeled on the figure for comparison.
Forecasts of the future costs of vital materials have a high-profile history. In 1980, Paul Ehrlich and Julian Simon made a public wager on the future price change of chrome, copper, nickel, tin, and tungsten. Ehrlich and his colleagues waged a total of $1000, or $200/metal. In 1990, as Simon had predicted, the inflation-normalized price of all five metals had dropped to ~$430 because cheaper plastics and ceramics replaced more costly metals, lowering demand and subsequently the price of those metals (14).
Today that basket of 5 metals is now worth over $1500. Continued demands for higher-purity and thus valued materials have been the driver of this reversal of the initial Ehrlich-Simon wager (15–19).
For example, the average quality of copper ore has gone from 2.4% to 1% in the last 100 years.
Indium, a secondary metal byproduct of zinc mining, has shot up 400% the past 5 years due to an increase in demand from the digital display market (20, 21).
We explore the material limits for PV expansion by examining both material supply and least cost per watt for the most promising semiconductors as active photogenerating materials across 23 potential photovoltaic technologies were evaluated. Low-efficiency cell types were not significantly investigated, regardless of cost.
Conclusion
We estimated the electricity contribution and cost impact of material extraction to a finished solar module by calculating the maximum TWh and minimum ¢/W of each of the 23 compounds evaluated (Figures 1 and 2).
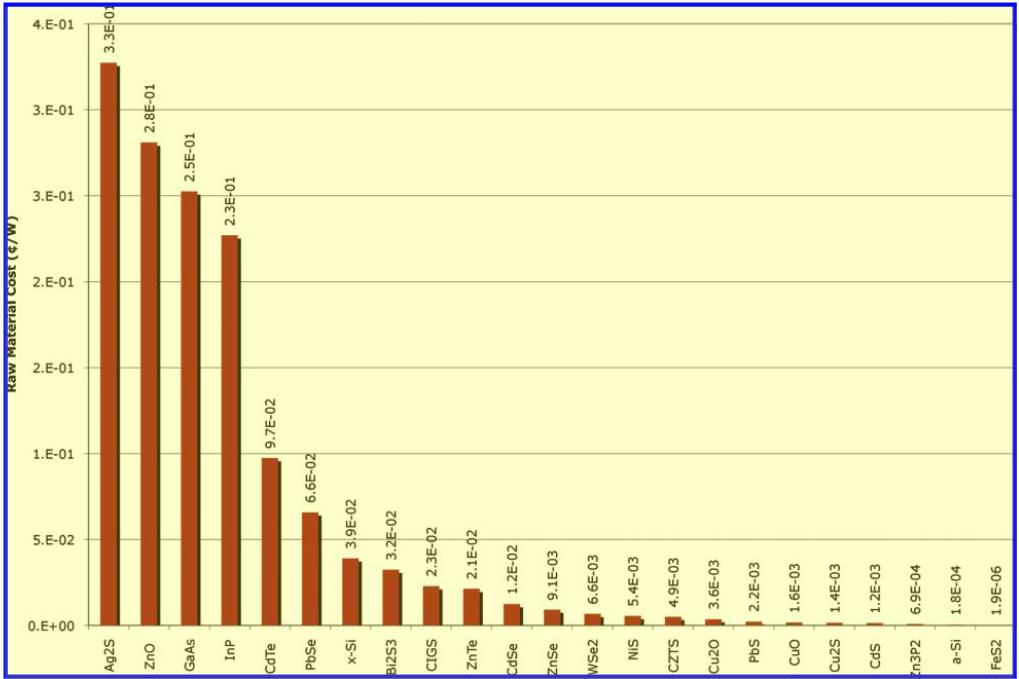
FIGURE 2. Minimum ¢/W for 23 inorganic photovoltaic materials. Component cost contribution in ¢/W is a strong indicator of value for future deployment. Calculated values for all 23 compounds evaluated are shown. The range of costs are between 0.327¢/W for Ag2S and 0.000002¢/W for FeS2 . While the actual dollar figure per watt for material extraction will appear small compared to the entire cost of an installed PV system, the cost of processing the material for PV grade applications is a larger cost contributor and should be evaluated further.
PV materials that could achieve extraction costs lower than x-Si at 0.039¢/W and demonstrate equal or greater electricity production potential versus x-Si include FeS2, Zn3P2, and a-Si. Iron pyrite (FeS2) is significantly more attractive in both cost and availability than all other compounds, whereas several of the leading thin-film technologies like CdTe are not able to meet the large-scale needs. The two materials PbS and NiS are both promising, but outside of a quantum confined system, they will be hampered by disproportionately higher Balance of system and installation costs due to low power conversion efficiencies. Furthermore, some unusual candidate compounds, like ZnO, have a high abundance but fail to meet an acceptable limit on cost, and some compounds, like CdS, show favorable cost but a low production potential, making them candidate technologies primarily for niche markets.
Silicon Comparison. It is important to compare results of these novel material systems to silicon, the second most abundant element in the earth’s crust at 28% of the lithosphere by mass. Despite its abundance, silicon has an annual production that trails that of copper by 145,000 metric tons and a cost of extraction of ~$1.70/kg, as compared to the $0.03/kg for iron (21). This disparity in costs is traced to the energy input of 24 kWh/kg for useable metallurgical-grade silicon from silica (SiO2) as opposed to the 2 kWh/kg for converting hematite (Fe2O3) to iron (31, 32). While both processes are already quite efficient, the Gibbs free energy of processing silica is a fixed thermodynamic barrier that will always be present. Crystalline silicon is further disadvantaged by a weighted photon flux absorption coefficient two orders of magnitude smaller than that for FeS2, thereby requiring a much larger material input to achieve the same absorption properties.
(14) Tierney, J. Betting on the Planet. The New York Times, 1990.
(15) Solow, R. M. Economics of Resources or Resources of Economics. Am. Econ. Rev. 1974
(16) Slade, M. E. Trends in natural-resource commodity prices – An analysis of the time domain. J. Environ. Econ. Manage. 1982
(17) Nordhaus, W. D. Allocation of Energy Resources. Brookings Pap. Econ. Activity 1973 , (3), 529–570.
(18) Hotelling, H. The Economics of Exhaustible Resources (Re- printed from Journal of Political-Economy, Vol 39, Pg 137-175, 1931). Bull. Math. Biol. 1991,53 1-2), 281–312.
(19) Withagen, C. Untested hypotheses in non-renewable resource economics. Environ. Resour. Econ. 1998,11 3-4), 623–634.
(20) Gordon, R. B.; Bertram, M.; Graedel, T. E. Metal stocks and sustainability. Proc. Natl. Acad. Sci. U. S. A. 2006, 103 (5), 1209– 1214.
(21) U.S. Geological Survey: Mineral commodity summaries 2007; U.S. Geological Survey: Washington, DC, 2007.
(31) Green, M. A. Solar cells: operating principles, technology, and system applications ; Prentice-Hall: Englewood Cliffs, NJ, 1982.
(32) Chapman, P. F.; Roberts, F. Metal resources and energy; Butterworths: London, 1983.