
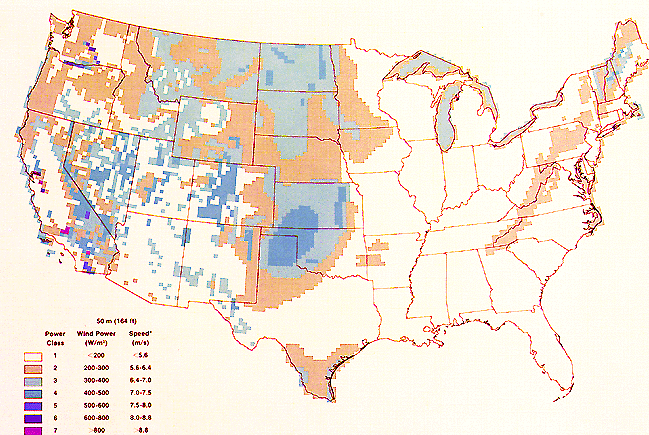
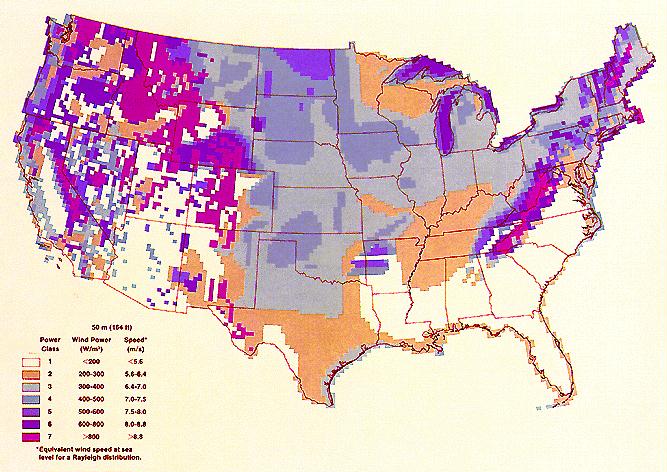
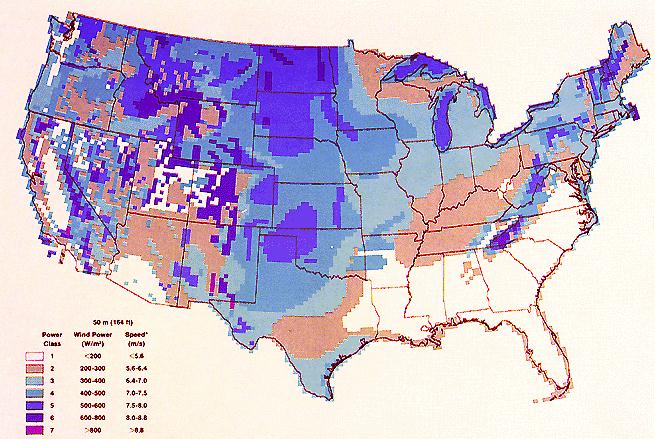
Figure 1. Summer wind across the USA is barely to not economically viable Class 3 (light blue), or not at all economically viable Class 2 (orange) and class 1 (blank) (NREL), with very limited darker blue (class 4) and tiny dots of higher class 5+ to provide power for the entire US.
Someday wind and solar will need to contribute over 50% of power due to declining fossil fuels and uranium
Is this possible?
Wind (and solar) have to contribute the majority of renewable power, because there isn’t enough potential power from biomass, geothermal, hydropower, or energy storage for reasons discussed further below.
Wind is unpredictable, uncertain, unreliable — off at the pub like a Dickensian father drinking his paycheck anywhere from 57.0% to 78.2% of the time in the United States (EIA), barely blowing in the summer.
Wind power is on vacation all year in the South East
Wind is not available all year at commercially viable speeds (class 3 or above) in the South Eastern United States, where no power is wind-generated now.
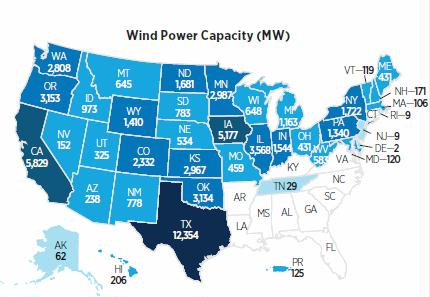
Figure 2-4. U.S. utility-scale wind power capacity year-end 2013. Source: AWEA. 2014. U.S. Wind Industry Annual Market Report, Year Ending 2013. American Wind Energy Association. http://www.awea.org/amr2013
Across the entire continental United States, wind blows the most and the hardest in winter, mainly in remote states far from dense coastal population centers where the energy is most needed. Will windy states share their wind? Even if they were willing, there’s not a national transmission grid and not likely to ever be one given the cost, 10-12 years to get permits and buy right-of-way, and risk of a national grid outage.
California’s peak demand is in the summer, when wind blows the least, so the state of California looked at importing Wyoming wind power. But this would require adding 957 MW of natural gas plants since Wyoming wind isn’t blowing much in the summer either (NREL 2014).
Are there any banks willing to lend utilities, governments, or private businesses trillions of dollars to build tens of thousands of miles of transmission lines costing $5.5 million dollars per mile (BG) to build a national grid first, and then enough wind farms to move winter wind power from windy states to the rest of the nation? Will states be willing to send power across state lines that they won’t benefit from (which they are already reluctant to do) at a time when they need all the power they can get as fossil fuels decline?
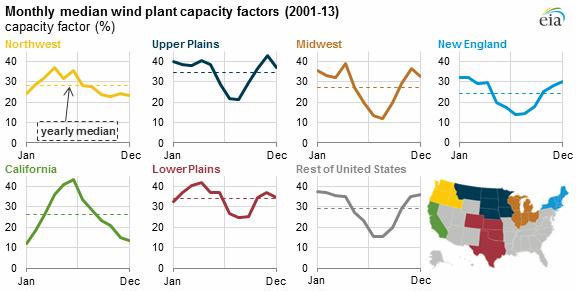
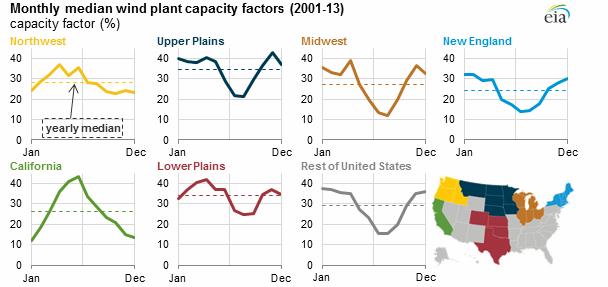
Nearly all wind maps show the yearly average, which is meaningless and misleading. What matters is how much wind there is every hour, every day, every week, every month, every season. Notice below how much wind varies over seasons (EIA 2015b). A tremendous amount of energy storage would be needed to compensate for lack of wind energy over the summer.
Grid operators care about wind at even smaller time intervals — 10 minutes or less — so that they can quickly curtail wind power when supply exceeds demand or ramp up natural gas plants when wind dies down. The electric grid needs to balance supply and demand within a few percent of 60 Hz, or there’s a black out.
Summer demand in Texas versus wind availability (Lesser)
As you can see below, on average the demand in the summer in Texas is far higher than the wind available.
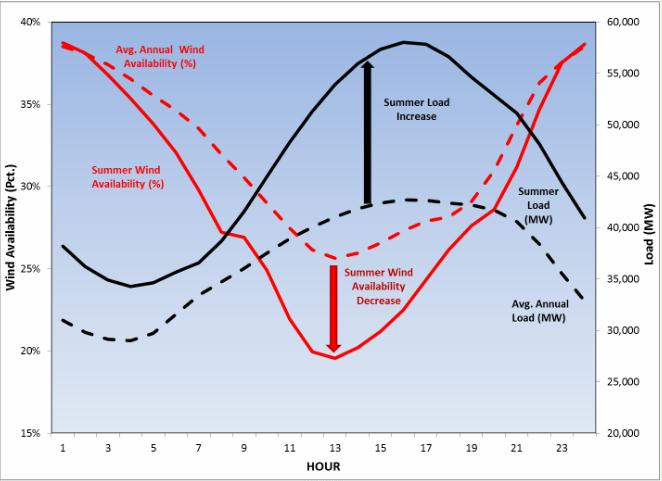
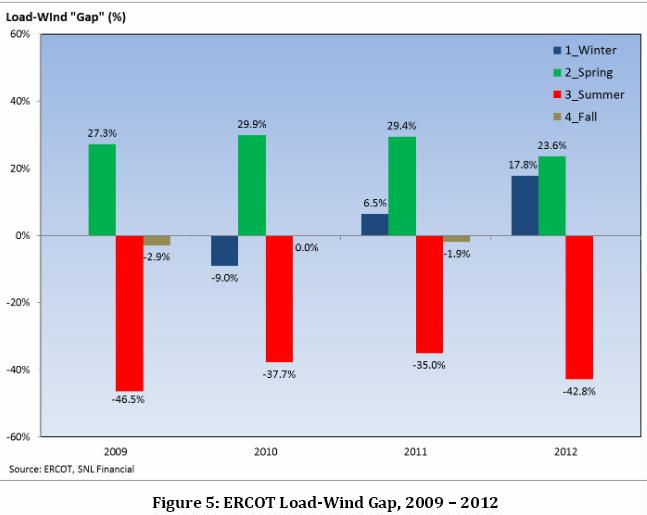
2009-12, Summer and Annual Load and Wind Availability-ERCOT
The load-wind gap(Lesser)
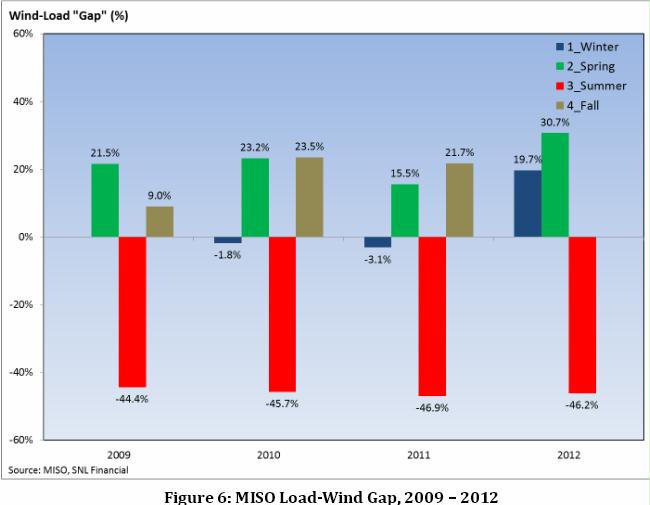
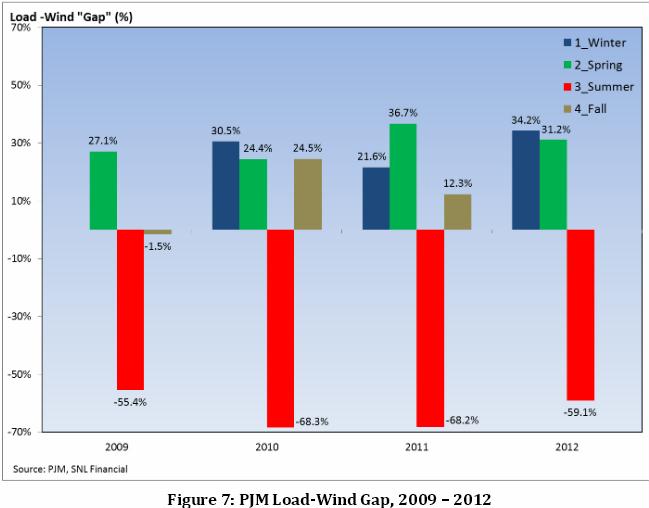
We can also evaluate the load-wind “gap” in each season. We define this load-wind “gap” as the difference between the seasonal wind availability ratio and the seasonal load ratio. The seasonal wind availability ratio is defined as the average seasonal wind availability relative to average annual wind availability. Similarly, the seasonal load ratio is defined as the average load during the specific season relative to average annual load. For example, suppose the seasonal load in spring equals 90% of annual average load, but that seasonal wind generation is 120% of annual average wind generation. Then the load-wind “gap” equals 120%-90%, or +30%. A positive load-wind gap value means there is relatively more wind generation available to serve load; a negative load-wind gap value means there is relatively less wind generation available to serve load. Below you can see the seasonal load-wind “gap” for ERCOT, MISO, and PJM over the 2009-2012 period.
As these three figures demonstrate , the relative lack of wind generation in each region during the last four Summers is pronounced. In all three regions, the highest relative amount of wind generation occurred when loads were lowest, and the smallest amounts of wind were available when loads were greatest in Summer. In PJM, the effect has been particularly pronounced, with a summer load-wind gap of almost -70% in summer 2010 and 2011, and -59% in summer 2012. Chicago’s experience during Summer 2012’s searing heat wave provides a compelling local example of wind failure to provide power on the hottest days. During this heat wave, Illinois wind generated less than 5% of its capacity during the record breaking heat, producing only an average of 120 MW of electricity from the over 2,700 MW installed. On July 6, 2012, when the demand for electricity in northern Illinois and Chicago averaged 22,000MW, the average amount of wind power available during the day was a virtually nonexistent 4 MW (J. Lesser, “Wind Power in the Windy City: Not There When Needed” Energy Tribune op-ed, July 25, 2012).
It’s not okay for wind to disappear 68% of the time, because the electric grid needs to be up 24 x 7 for computers, finance, credit cards, banks, cash registers, refrigeration; to pump sewage, drinking and irrigation water; for agriculture, food processing and packaging, radios, cellphones, refineries, heat and air conditioning, hospitals, pharmacies, police, fire, etc. Vehicles depend on electricity to pump fuel and make gas or diesel at refineries.
The more wind energy contributes to overall power, the less it can be counted on. This is counter intuitive, but consider that if wind provides only 1% of all power, it’s pretty easy for nuclear and fossil plants to compensate for a lack of wind.
But if wind had to provide 50% of all power because oil, natural gas, coal, and uranium were declining, with half as many fossil and nuclear power plants as exist now, these plants would have a hard time (due to lack of fuel) to compensate for a lack of wind power.
The kind of power matters a great deal — the grid depends on resources that can ramp up and down quickly to keep the grid from blacking out if a large coal or nuclear power plant unexpectedly shuts down (mainly natural gas plants). In a renewable electric system, when wind (or solar) surges or dies, the only renewable energy resources that can ramp up or down are:
- Solar CSP with thermal storage. Only 7 southwestern states have enough sun/lack of humidity for CSP plants to be built, but solar CSP with thermal storage plants need water, which is limited in these 7 states.
- Biomass is very limited because photosynthesis is inefficient and produces little renewable biomass per year. Most biomass will be needed for transportation fuel since heavy freight transportation relies nearly completely on diesel, and to make the 500,000 products that use fossil fuels as a feedstock (asphalt in roads, plastics, fertilizer, etc).
- Pumped Hydro Storage and Compressed Air Energy Storage are very limited geographically and also very expensive
- Battery energy storage is far from being commercial, most types reach material limits before being able to store enough power for 4-12 hours (Barnhart), and too expensive
Geothermal is base load power which can’t be used to ramp power up or down.
Wind can only add to the blaze of power from coal, natural gas, and nuclear power plants. It can not replace them.
Great Britain’s office of science and technology estimated that if the proportion of generation from wind ever reached 50%, reliability would fall to 7-9% (GBHP).
So if 25 gigawatts (GW) of wind capacity were built to replace 25 GW of retiring fossil and nuclear plants, and the amount of wind power that could be depended on at peak demand was 5 GW (the capacity credit), you’d need to build an 20 GW of nuclear and fossil plants to back up the wind farms or 45 GW to replace 25 GW of power, nearly double as much power (GBHL).
Plan B would be to over-build wind power to compensate. 625 GW of wind farms might have a 25 GW capacity credit, and if transmission wires spanned the United States, even more than that in the winter, but perhaps less than 25 GW in the summer.
If wind is mostly missing over an entire season across a continent, how can wind be a renewable “solution”?
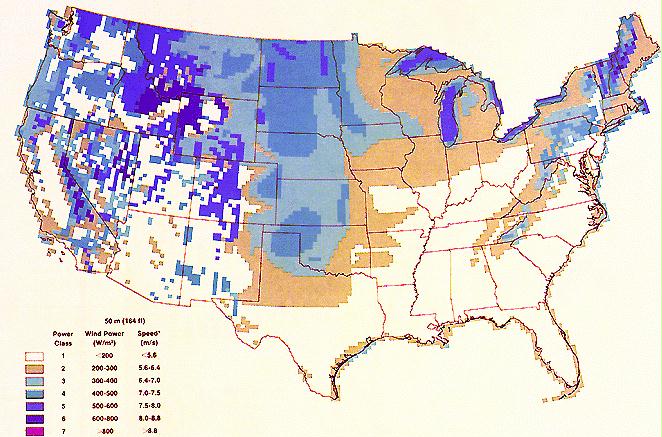
In the USA maps below, areas that are blank (class 1) or orange (class 2) are not commercially viable. Most class 3 aren’t either, unless near a city and existing transmission lines with enough extra capacity.
Wind Energy Resource Atlas of the United States Winter, Spring, Summer, Autumn (NREL)
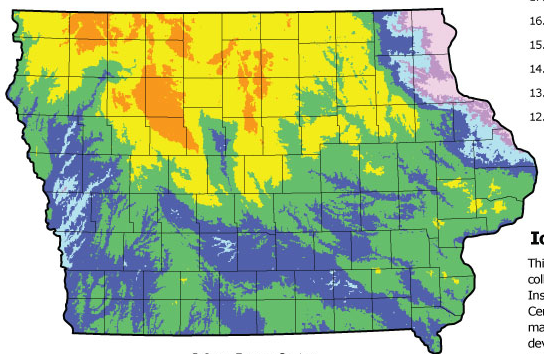
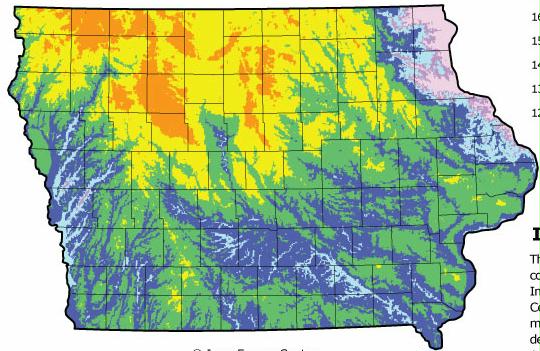
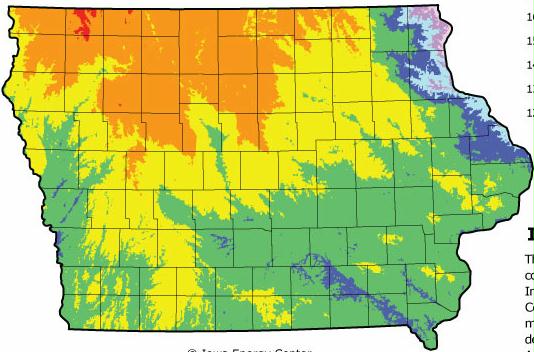
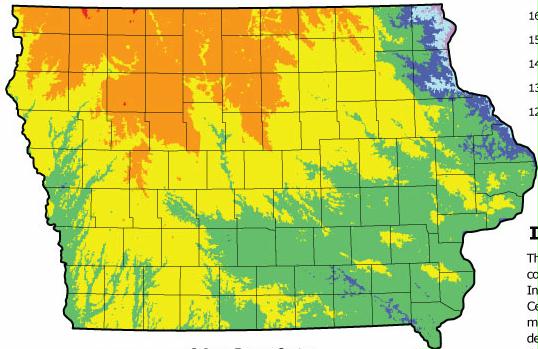
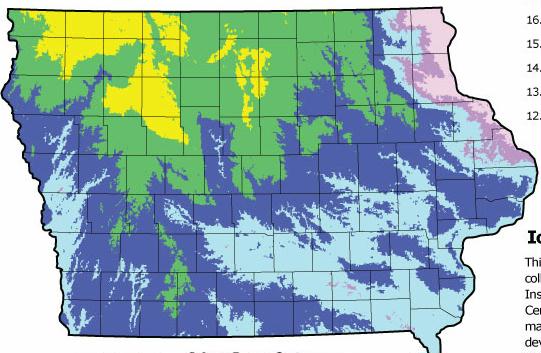
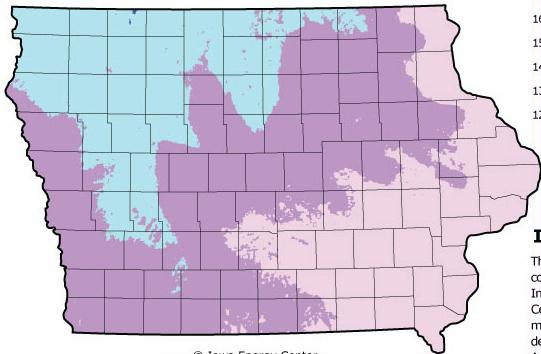
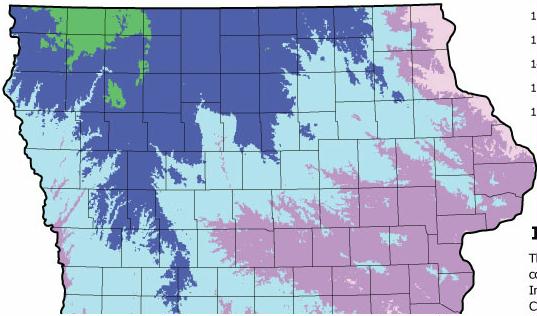
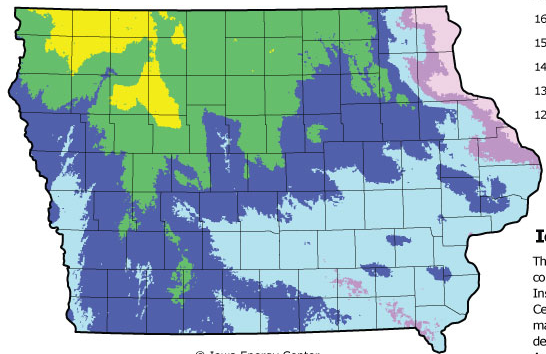
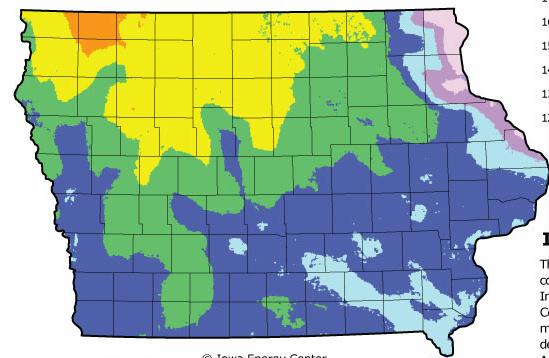
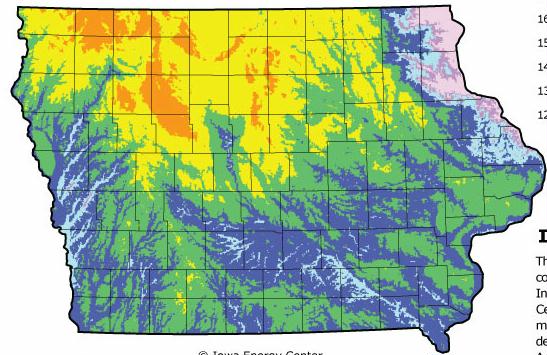
Iowa Wind maps by month 50 meters high
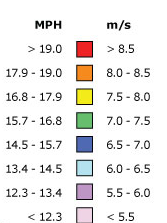
Only Red, Orange, Yellow, and Green are economically viable. In July & August, wind is class 1 and 2
January
February
March
April
May
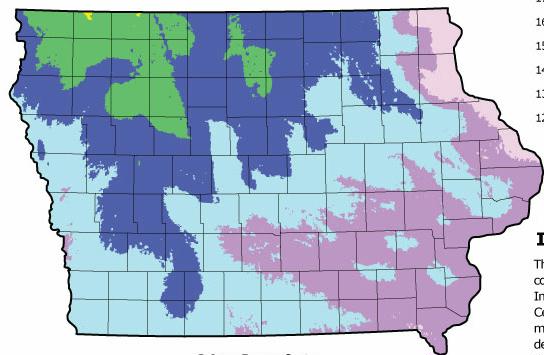
June
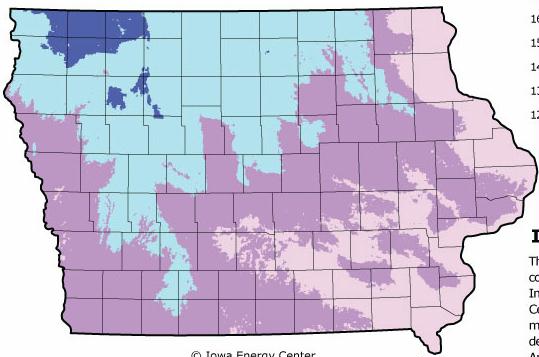
July
August
September
October
November
December
When you drill down to hourly wind capacity by month wind looks totally crazy:
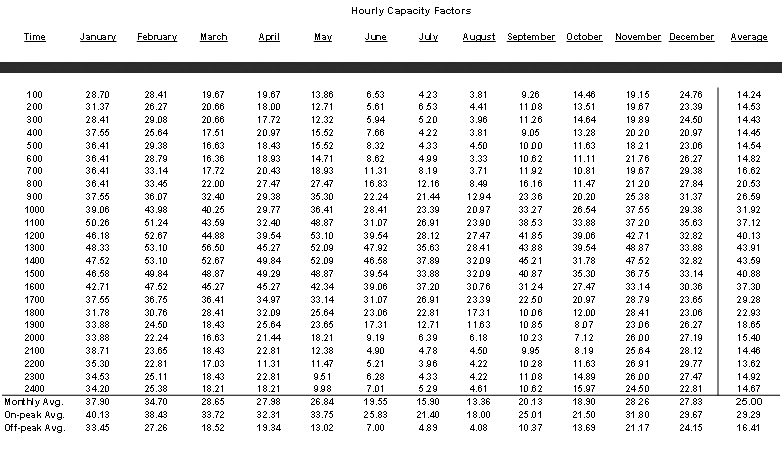
Projected Monthly Capacity Factor Distribution for an Average Annual Capacity Factor of 25% Muskegon, MI Airport Figures from 1997, 2000, and 2003
There are many other reasons why wind power will not save us as well.
References
AWEO. 2009. Areas of industrial wind facilities. aweo.org/windarea.html. I averaged the 107 acres/MW (and averaged the few with ranges). This site also says the number of acres may over twice as large: “That may still not be enough for maximum efficiency. More recent research at Johns Hopkins University by Charles Meneveau suggests that large turbines in an array need to be spaced 15 rotor diameters apart, increasing the above examples to 185-250 acres required per installed megawatt. Remember that capacity is different from actual output. Typical average output is only 25% of capacity, so the area required for a megawatt of actual output is 4 times the area listed here for a megawatt of capacity. And because 60% of the time wind turbines produce power at a rate far below average, even more (2.5×, perhaps, for a total of 10×) — dispersed across a wide geographic area — would be needed for any hope of a steady supply”.
Barnhart, C. 30 Jan 2013. On the importance of reducing the energetic and material demands of electrical energy storage Energy Environ. Sci., 2013,6, 1083-1092
BG. 2008. Transforming America’s power: The Investment Challenge 2010-2030. Brattle Group. Table 4-1 costs per mile: $5,452,900 (avg of 765 kV $6,577,600 & 500 kV $4,328,200. High kV transmission lines are required to prevent losses over long distances).
DOE. June 1980. Standby Gasoline Rationing Plan. U.S. Department of Energy
EIA. 2015. Table 6.7.B. Capacity Factors for Utility Scale Generators Not Primarily Using Fossil Fuels, January 2008-November 2014. U.S. Energy Information Administration.
EIA. 2015b. Wind generation seasonal patterns vary across the United States. U.S. Energy Information Administration.
| 2012 | 2013 | 2014 | Max Percent difference | |
| January | 39.0 | 33.2 | 40.1 | 20.8 |
| February | 33.5 | 34.9 | 34.3 | 4.2 |
| March | 39.0 | 35.5 | 39.4 | 11.0 |
| April | 36.5 | 40.4 | 43.0 | 17.8 |
| May | 34.5 | 36.9 | 34.3 | 7.6 |
| June | 33.6 | 32.3 | 35.8 | 10.8 |
| July | 23.6 | 25.3 | 26.5 | 12.3 |
| August | 22.4 | 21.8 | 22.4 | 2.8 |
| Sept | 23.8 | 27.5 | 26.0 | 15.5 |
| October | 32.6 | 31.2 | 31.5 | 4.5 |
| November | 30.0 | 37.1 | 42.3 | 41.0 |
| December | 34.1 | 31.6 | 0.0 | 8.3 |
| 382.6 | 387.7 | 375.6 | ||
| Average | 31.9 | 32.3 | 34.1 | |
| Overall average | 32.8 |
Elsam Engineering. 2004. “Life Cycle Assessment of Offshore and Onshore Sited Wind Farms. Vestas Wind System. (235 tons steel, 887 tons concrete, 39 tons iron, 3.6 tons copper (Elsam) and 296 tons steel, 1164 tons reinforced concrete, 39.35 tons iron, 2.4 tons copper, (Guezuraga)
GBHL. 2007-2008. The Economics of Renewable Energy. House of Lords Select Committee on Economic Affairs 4th Report, Great Britain.
GBHP. May 2014. Intermittent Electricity Generation. Great Britain Houses of Parliament, office of science & technology PostNote number 464.
Guezuraga, B. 2012. Life Cycle Assessment of two different 2 MW class wind turbines. Renewable Energy 37: 37-44.
Lesser, J.A. October 2012. Wind intermittency and the production tax credit: A high cost subsidy for low value power. Continental Economics.
NREL. Wind Energy Resource Atlas of the United States. Maps: 2-12 Winter, 2-13 Spring, 2-14 Summer, 2-15 Autumn. National Renewable Energy Laboratory.
NREL. March 2014. California-Wyoming Grid Integration Study Phase 1-Economic Analysis. National Renewable Energy Laboratory.
Stover, D. Nov 22, 2011. The myth of renewable energy. Bulletin of Atomic Scientists.