
Preface. Charles Hall, one of the founders of EROI methodology, initially thought an EROI of 3 was enough to run modern civilization, which is like investing $1 and getting $3 back. But after decades of research, Hall concluded an EROI of 12 to 14 might be needed as illustrated in the figure below (Lambert and Hall 2014).
This will give you a good idea of what Hall means by EROI (Hall 2011):
- If you’ve got an EROI of 1.1:1, you can pump the oil out of the ground and look at it.
- If you’ve got 1.2:1, you can refine it and look at it.
- At 1.3:1, you can move it to where you want it and look at it.
- We looked at the minimum EROI you need to drive a truck, and you need at least 3:1 at the wellhead.
- Now, if you want to put anything in the truck, like grain, you need to have an EROI of 5:1. And that includes the depreciation for the truck.
- But if you want to include the depreciation for the truck driver and the oil worker and the farmer, then you’ve got to support the families. And then you need an EROI of 7:1
- And if you want education, you need 8:1 or 9:1
- And if you want health care, you need 10:1 or 11:1
We begin to go over the net energy cliff as soon around 14 if you consider the arts to be an essential component of civilization. Twelve is needed for healthy care, 9 or 10 for education, and 7 or 8 to support a family, so somewhere between 7 and 14 according to how you define civilization (Fig. 12).
Murphy (2013) found that society needed at least an EROI of 11. So much net energy is provided by any energy resource with an EROI of 11 or higher, that the difference between an EROI of 11 and 100 makes little difference. But once you go below 11, there is such a large, exponential difference in the net energy provided to society by an EROI of 10 versus 5, that the net energy available to civilization appears to fall off a cliff when EROI dips below 10 (Mearns 2008).
Weissbach (2013) found that it is not economic to build an electricity generating power source with an EROI of less than 7.
The EROI of Oil (Ahmed 2017)
The debate over the precise point of peak production of an energy resource can be ultimately misleading. Production levels do not reflect the quality of the energy being produced as measured by EROI. An analysis focusing only on rates and levels of production can mask the accelerating production costs, which rise due to the decline in resource quality, so that rising production is unable to meet the energy requirements of society due to plummeting EROI values.
This is shown in a major Royal Society study focusing on the declining EROI for global oil and gas production, which calculated that the latter’s EROI is roughly 15:1 and declining, and the U.S. EROI of oil and gas production is about 11:1 and declining. Most unconventional oil and biofuels is less than 10:1. It concludes: “… as the EROI of the average barrel of oil declines, long-term economic growth will become harder to achieve and come at an increasingly higher financial, energetic and environmental cost” (Murphy 2014).
Since the 1960s, EROI has declined, even as production increased, though its rate of increase declined and appears to be approaching plateaus on a number of fronts. This highlights the often overlooked relationship between EROI and production that underscores the extent to which seemingly accelerating production in the short-term, can itself be symptomatic of a geophysically catabolic process in the long-term.
As EROI declines, increasing costs are required to maintain production. As demand rises due to economic growth, production must increase to meet demand, therefore requiring further financial, energetic and environmental inputs. But to increase production to a level sufficient to meet demand while EROI is declining, means that even more quantities of energy are required simply to maintain production, and even higher quantities required to increase it. Accelerating inputs drive up the cost which causes a further decrease in EROI even while driving increased production. The trajectory of increasing production conventionally hailed by the industry as prima facie evidence of its barometer of health is in fact the prime indicator of the catabolic depletion of the resource in question (Murphy and Hall 2011).
This is why it is perhaps more useful to speak of the peak and decline of EROI as a measure of the health of the global energy system, and indication of its future trajectory. According to this measure, EROI for global oil and gas production peaked in 1999 and has since entered terminal decline (Gagnon et al. 2009). In this same period, although oil and gas production increased, the rate of increase dramatically slowed compared to previous decades. At the same time capital expenditures (capex) by the world’s oil majors increased over 10% every year, directly illustrating the self-catabolic process at play, consisting of heightening efforts to exploit the resource base resulting in declining EROI and flattening production (Brandt et al. 2015).
According to Jancovici, since the 1960s—which is when the EROI of the global fossil fuel system as a whole was at its highest according to most studies: “…the growth rate of the GDP per capita (world average) has been slowly—and constantly—decreasing…” (Jancovici 2013 ). In the decade after 1960, he calculates, GDP was increasing at +3.5% per year. For the decade after 1970, this rate of increase dropped to +2% per year. Over the last three decades, the rate of GDP growth dropped to +1.5% per year. And in the period following the 2007–8 financial crash up to 2012, it has dropped even further to 0.4% per year on average.
The steady decline in the rate of GDP growth thus correlates directly with the steady decline in EROI of production from the global fossil fuel resource base, even as energy production has continued to increase. However, as energy production has slowed down over the last decade since 2005—accompanying the shift to lower quality unconventional liquids—now approaching an undulating plateau, so too has GDP growth.
Keep in mind that it takes a HUGE amount of energy to make the exponentially increasing amounts of the following materials from increasingly lower grades of ores that are so essential for civilization as we know it today:
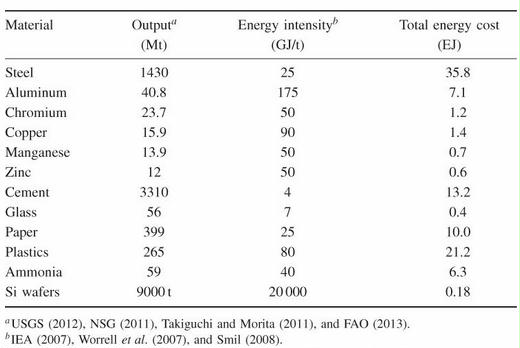 Global energy cost of major materials in 2010. Source: Vaclav Smil. 2013. Making the Modern World: Materials and Dematerialization. Wiley.
Excerpts from the Lambert and Hall (2014) paper follow.
Alice Friedemann www.energyskeptic.com Women in ecology author of 2021 Life After Fossil Fuels: A Reality Check on Alternative Energy best price here; 2015 When Trucks Stop Running: Energy and the Future of Transportation”, Barriers to Making Algal Biofuels, & “Crunch! Whole Grain Artisan Chips and Crackers”. Podcasts: Crazy Town, Collapse Chronicles, Derrick Jensen, Practical Prepping, KunstlerCast 253, KunstlerCast278, Peak Prosperity
***
Lambert, Jessica G., Hall Charles A. S. et al. 2014. Energy, EROI and quality of life. Energy Policy 64:153–167
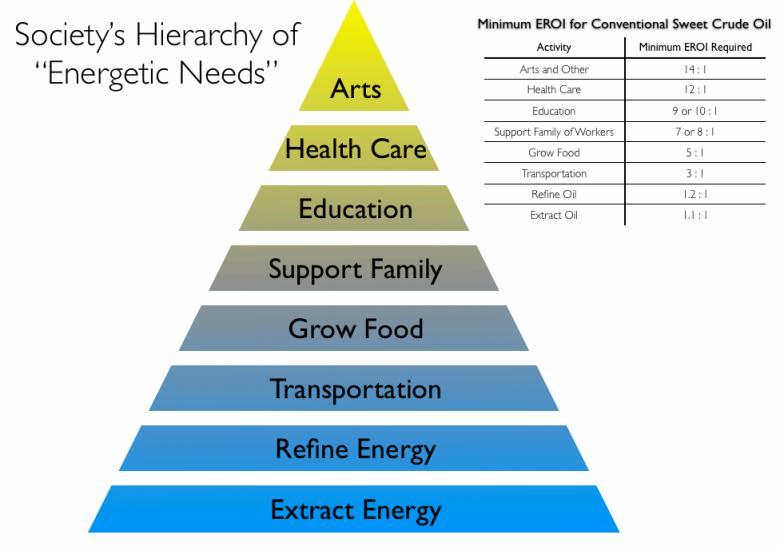
Fig. 12. “Pyramid of Energetic Needs” representing the minimum EROI required for conventional oil, at the well-head, to be able to perform various tasks required for civilization. The blue values are published values, the yellow values increasingly speculative. Each increment in EROI allows more and more work to be done. EROI chart from “EROI of Global Energy Resources Preliminary Status and Trends” Jessica Lambert, Charles Hall, Steve Balogh, Alex Poisson, and Ajay Gupta State University of New York, College of Environmental Science and Forestry
Abstract. The near- and long-term societal effects of declining EROI are uncertain, but probably adverse. To evaluate the possible linkages between societal well-being and net energy availability, we compare these preliminary estimates of energy availability: (1) EROI at a societal level, (2) energy use per capita, (3) multiple regression analyses and (4) a new composite energy index (Lambert Energy Index), to select indicators of quality of life (HDI, percent children under weight, health expenditures, Gender Inequality Index, literacy rate and access to improved water). Our results suggest that energy indices are highly correlated with a higher standard of living.
1. Introduction
Humans, as well as our complex societies, require food energy and now massive amounts of external energy to survive and reproduce. For all organisms it is the net energy, or the energy available to an organism or a society after investments to obtain that energy, that is important, indeed that may be the most important factor in determining the long-term survival and wellbeing of humans and society. The history of human cultural advancement can be examined from the perspective of the development of energy resources and the evolution of energy conversion technologies. Energy provided by the burning of fossil fuels has fostered the expansion of economic, social and environmental development. The availability of energy and the increased efficacy with which it is used has enabled humans to enhance their comfort, live longer and increase their numbers.
Because energy is used directly and indirectly in the production of all goods and services, energy prices have a significant impact on nearly every facet of economic performance. Economic analyses indicate that decline in the rate of increase in energy availability is likely to have serious effects. There is a strong correlation between per capita energy use and social indicators such as the UN’s Human Development Index.
1. 1. Quality of energy. The quality of a unit of energy is the usefulness of that energy unit to society. The amount of work that can be performed by an available unit of energy (not used directly or indirectly in the acquisition of the next unit of energy) influences the perception of quality but is not the only factor in ascertaining that unit of energy’s usefulness. For example, hydropower creates electricity that has greater economic utility than a similar amount of heat energy. However, electricity is less useful for smelting ore as it would need to be translated into thermal energy for this task and would lose a good deal of its special properties in this process. Energy return on investment (EROI) is one measure for establishing the quality,
We use EROI as a gauge of the effectiveness of human activity intended to satisfy fundamental physical needs, assist in achieving a sense of mental and psychological well-being, and accomplish the higher aspirations associated with the best of what the human species has to offer. Studies of early human culture suggest that hunter gatherers have a relatively large energy surplus (i.e. an EROI of 10:1), which allowed them to spend a great deal of time in leisure activities. Just as with the !Kung, the larger the surplus, i.e. the higher the EROI, the greater the societal welfare that can be generated. Hence the higher the EROI of a society, the greater the contributions possible to quality of life.
Anthropologist White (1959) was among the first to recognize the importance of surplus energy for art, culture, progress and indeed all the trappings of modern civilization.
Modern humans invest their own energy plus an enormously larger quantity of fossil fuel to produce food, to generate leisure and to do the plethora of activities and attributes we associate with modern society. Whether increased GDP is required is implicit but not proven: one can imagine a causative chain: higher EROI –> higher GDP –> higher social well-being.
An economy without sufficient domestic fuels of a type that it needs, such as oil for transport, must import these fuels and pay for them using an externally-accepted currency via some kind of surplus economic activity. This is especially the case if and as the nation develops industrially. Oil is usually the fuel of choice. The ability to purchase the oil used to maintain or grow an economy depends upon what an economy can generate to sell to the world, the oil required to grow or produce those products and their relative prices. Assume an economy that depends 100% on imported oil (e.g. for agriculture and transportation).
Costa Rica is an example. It has no domestic fossil fuels (although considerable hydroelectric power) but has a fairly energy-intensive economy, and to a large degree pays for its imported oil with exported agricultural products e.g. bananas and coffee. These are commodities highly valued in the world and hence readily sold. They are also quite energy-intensive to produce, especially when produced of the quality that sells in rich countries. Costa Rica’s bananas require an amount of money equivalent to about half of their dockside purchase price to pay for the oil and petrochemicals required for their production and cosmetic quality. These production expenses consume a large portion of the economic “surplus” necessary to generate hard currency to pay for imported petroleum.
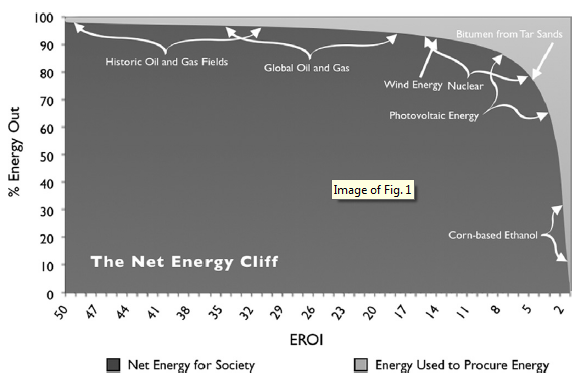
1.4. EROI and the net energy cliff
Fig. 1 below illustrates the possible distribution of energy employed to produce energy (light grey) and the outcome of this process, the energy available to society (dark grey) for various fuel sources ranked according to their EROI values. As EROI approaches 1:1 the ratio of the energy gained (dark gray) to the energy used (light gray) from various energy sources decreases exponentially. High EROI fuels allow a greater proportion of that fuel’s energy to be delivered to society, e.g. a fuel with an EROI of 100:1 (horizontal axis) will deliver 99% of the useful energy (vertical axis) from that fuel to society. Conversely, lower EROI fuels delivers substantially less useful energy to society (e.g. a fuel with an EROI of 2:1 will deliver only 50% of the energy from that fuel to society). Therefore, large shifts in high EROI values (e.g. from 100 to 50:1) may have little or no impact on society while small variations in low EROI values (e.g. from 5 to 2.5:1) may have a far greater and potentially more “negative” impact on society.
The oil, gas and coal that dominate energy use today probably had EROI values greater than 30:1 to 100:1 in the past. Therefore, we did not need to be concerned with their EROIs or the potential political, economic and social ramifications of decreasing EROI values. Recently, we have become aware that the EROI and hence the amount of net energy available to society are in a general decline as the highest grade fossil fuel deposits are depleted .
“New” energy sources must be sufficiently abundant and have a large enough EROI value to power society, or much more time, effort, and attention must be paid to securing the next year’s supply of energy, leaving less money, energy, and labor available for discretionary purposes. The general decline in EROI for our most important fuels implies that depletion is a more powerful force than technological innovation
Carbon capture and sequestration (CCS) and the use of hydrogen fuel cells are topics of interest to the energy community but are not considered within this discussion as neither are methods of source energy production.
If the EROI values of traditional fossil fuel energy sources (e.g. oil) continue to decline and non-conventional energy resources fail to provide sufficient quantities of high EROI alternatives, we may be moving toward the “net energy cliff.” If EROI continues to decline over time, the surplus wealth that is used to perform valuable but perhaps less essential activities in a society (e.g. higher education, the arts, technologically advanced health care, etc.) will probably decline. Given this, we believe that declining EROI will play an increasingly important role in our future economy and quality of life.
1. 5. Quality of life indices. We hypothesize that access to cheap and abundant fuel is related to an individual’s and a society’s ability to attain a “higher quality of life, using some commonly used indicators of a society’s performance—the Human Development Index (HDI), percent of children under weight, average health expenditures per capita, percent of female literacy, Gender Inequality Index (GII), and improved access to clean water for rural communities. These values impart an array of environmental and social features that assist in defining the “quality of life” of the citizens of a nation.
The human development index (HDI) is a commonly used composite index of well-being and is calculated using four measures of societal well-being: life expectancy at birth, adult literacy, combined educational enrollment, and per capita GDP. It has a possible range of 0 to 1. The world’s most affluent countries in 2009 had HDI values above 0.7; these include Norway (.876), with the highest value, followed by Australia (.864), Sweden (.824), the Netherlands (.818), and Germany (.814). The lowest HDI values, below.35, tend to belong to the world’s least affluent countries (e.g. Ethiopia (.216), Malawi (.261), Mozambique (.155)).
Some scientists believe that energy scarcity is associated with constrained food production, poverty, limited production and conveyance of essential goods and services, and also generates strain on other limited environmental resources.
Results: Energy availability and quality of life
We find that many indices of human social well-being are well correlated with indices of energy availability and, as expected, GDP per capita. We also find that these quality of life indices are as well correlated with a composite index of energy use and distribution. Hence it appears that the quantity, quality and distribution of energy are key issues that influence quality of life.
3. 4. EROI for imported oil for developing countries. Developing nations, defined in this paper as those with an EROISOC of 20:1 or less, are also countries characterized as having high, and sometimes very high, population growth rates. As these populations grow and as the bulk of these people become increasingly located within cities, the task of feeding these urban dwellers becomes impossible without industrialized agriculture. Agricultural products, grown with high yield, tend to be especially energy-intensive whether grown for internal consumption or for export.
In addition, most of these emergent countries are developing their industries; exportation of agricultural and industrial products is often how they obtain foreign exchange to obtain needed industrial inputs. In general, as the GDP of a developing nation increases so does its energy use (or perhaps the converse). Consequently, for these and many other reasons fuel use in developing nations tends to increase rapidly. Most developing countries, however, do not have their own energy supplies, especially oil, which is needed to run their economic machine.
The implications for all nations
Traditionally, economists have viewed quality of life indices as a consequence of economic input and well-being. However we find that EROISOC and per capita energy use are as strong a statistical predictor as traditional economic indices. Both energy per capita and EROISOC are independent measures of the influence of energy availability on the ability of an economy to do work, which includes the generation of economic well-being and “quality of life.
The process of developing fuel-intensive domestic industries to generate exports has worked reasonably well for many developing nations in the past when the price of oil was low compared to the prices of exports. However, the trends suggested by our data imply that the increasing oil prices observed over the past decade, if they continue, will impact developing nations and their ability to produce goods substantially. When oil prices increase, these oil importing nations are “stuck” with the industrial investments that the people of that nation have become dependent upon. For a nation without domestic sources of fossil fuels, an environment of rising imported energy prices relative to price of exports obligates that nation to dedicate more and more of its production (and therefore energy use) to obtain the next unit of energy needed to run the economy. Large and increasing populations, mechanized agriculture and industrialization all are making developing nations increasingly dependent on foreign fuels. When the ratio of the price of oil to exports is low, times are good. When, inevitably, the relative price of oil increases things become much tougher. Once a developing nation steps on to this “fossil fuel treadmill,” it becomes difficult to step off. If the price of oil continues to increase and hence the EROIIO declines, this is likely to correspond to lower quality of life indices for the citizens of these nations. Specifically, health expenditures per capita, HDI and GII are likely to decline.
Certainly history is littered with cities and entire civilizations that could not maintain a sufficient net energy flow, showing us that certain thresholds of surplus energy must be met in order for a society to exist and flourish. As a civilization flourishes and grows it tends to generate more and more infrastructure which requires additional flows of energy for its maintenance metabolism. The concept of a hierarchy of “energetic needs” required for the maintenance and perhaps growth of a typical “western” society is somewhat analogous to Maslow’s “pyramid of (human) needs”. Humans must first meet their physiological and reproductive needs and then progressively less immediate but still important psychological needs. Like Maslow’s vision of a system of human hierarchical needs, a society’s energy needs are hierarchically structured. In this theory, needs perceived as “lower” in the hierarchy, e.g. extraction and refining of fossil fuels, must be satisfied before needs “higher” in the hierarchy become important at a societal level. For example, the need to first extract and then refine fuels must be met in order to meet the need for transport of that energy to its point of use. In Western society, the energy required to e.g. grow and transport sufficient food cannot be met without first fulfilling these first 3 needs (i.e. extraction, refining and transport of those fuels to their point of use). Energy for the support required for the maintenance of a family, the provision of basic education for the next generation of citizens, and healthcare for all citizens follows the hierarchical structure; each progressive level of energy needs requires a higher EROI and must be fulfilled before the next can be met. Discretionary use of energy e.g. the performing arts and other social amenities can be perceived as a societal energetic necessity only once all levels beneath this are fulfilled. The rating of importance of “the arts” probably is related to the socio-economic position that individuals or societal groups hold and may be operative only for those at the top of that society. A society’s pyramidal hierarchy of energetic needs represents the relative importance of various components of a society, ranked by importance to human survival and well-being, and the quality of energy devoted to the production and maintenance of infrastructure required to support those components of society. The specific and concrete nature of the lower levels may appear increasingly obscure and ambiguous to those at “higher” levels but is absolutely essential for their support.
As we use up our best fossil fuels and the EROI of traditional fossil fuels continues to decline countries with currently high EROISOC and energy use per capita values may find themselves in a deteriorating position, one with lower EROI SOC and energy use per capita. Policy decisions that focus on improving energy infrastructure, energy efficiency and provide additional non-fossil fuel energy sources (e.g. nuclear) within these nations may stem the tide of declining energy quality.
Most alternatives to oil have a very low EROI and are not likely to generate as much net economic or social benefit. Improving the efficiency at which their economies convert energy (and materials) into marketable goods and services is one means of improving energy security.
There is evidence too that once payments for energy rise above a certain threshold at the national level (e.g. approximately 10 percent in the United States) that economic recessions follow.
References
Brandt, Adam R., Yuchi Sun, Sharad Bharadwaj, David Livingston, Eugene Tan, and Deborah Gordon. 2015. Energy Return on Investment (EROI) for Forty Global Oilfields Using a Detailed Engineering-Based Model of Oil Production. PLOS ONE 10(12): e0144141.
Gagnon, Nathan, Charles A.S. Hall, and Lysle Brinker. 2009. A Preliminary Investigation of Energy Return on Energy Investment for Global Oil and Gas Production. Energies 2(3): 490– 503.
Hall, C.A.S. 2011. Introduction to special issue: Sustainability: special issue on EROI. pp 1773-1777 (also see Hall’s new book: 2017. Energy Return on Investment: A Unifying Principle for Biology, Economics, and Sustainability. Springer.)
Jancovici, Jean-Marc. 2013. A Couple of Thoughts in the Energy Transition. Manicore. http:// www.manicore.com/anglais/documentation_a/transition_energy.html
Murphy, David J., and Charles A.S. Hall. 2011. Energy Return on Investment, Peak Oil, and the End of Economic Growth. Annals of the New York Academy of Sciences 1219(1): 52–72.
Murphy, David J. 2014. The Implications of the Declining Energy Return on Investment of Oil Production. Philosophical Transactions of the Royal Society of London A: Mathematical, Physical and Engineering Sciences 372(2006): 20130126.