
[ I’m far more interested in the energy returned on invested than money since that’s what really matters. So I often stopped taking notes, and didn’t organize them. But the tables and figures give you an idea of subsidies and costs, but I left many out. Read the report if you want to know more.
Alice Friedemann www.energyskeptic.com author of “When Trucks Stop Running: Energy and the Future of Transportation”, 2015, Springer and “Crunch! Whole Grain Artisan Chips and Crackers”]
USGAO. October 20, 2014 ENERGY POLICY. Information on Federal and Other Factors Influencing U.S. Energy Production and Consumption from 2000. 120 pages.
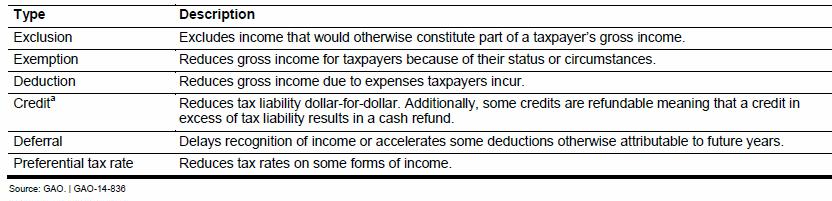
Table 1 shows the various ways businesses are subsidized by the government
Table 1 shows the various ways businesses are subsidized by the government


Figure 13: Revenue from Federal Excise Taxes Targeting or Related to Fossil Energy, Fiscal Year 2000 – 2012

Figure 14: Revenue from Royalty and Other Payments for Federal Oil, Gas, and Coal Leases, Fiscal Year 2003-2013


Why GAO Did This Study
Federal energy policy since the 1970s has focused primarily on ensuring a secure supply of energy while protecting the environment. The federal government supports and intervenes in U.S. energy production and consumption in various ways, such as providing tax incentives, grants, and other support to promote domestic production of energy, as well as setting standards and requirements. GAO was asked to provide information on federal activities and their influence on U.S. energy production and consumption over the past decade. This report provides information on U.S. production and consumption of fossil, nuclear, and renewable energy from 2000 through 2013 and major factors, including federal activities, that influenced energy production and consumption levels. It also provides information on other federal activities that may have influenced aspects of U.S. energy production and consumption from 2000 through 2013 but were not targeted at a specific energy source, as well as information on federal research and development. GAO analyzed DOE historical data on energy production and consumption, reviewed studies and reports from federal agencies and governmental organizations on federal energy-related activities, and analyzed data on federal spending programs and tax incentives, among other things.
Several major factors, including federal activities, influenced U.S. production and consumption of fossil, nuclear, and renewable energy from 2000 through 2013. Examples of these factors include the following:
Advances in drilling technologies enabled economic production of natural gas and crude oil from shale and similar geological formations. These advances led to increases in domestic production of natural gas and crude oil beginning around 2008 and contributed to declines in domestic prices of natural gas, as well as lower prices for crude oil in some regions of the United States.
The federal government limited oil producers’ liability associated with some oil spills, lowering the producers’ costs for liability insurance.
In addition, the federal government provided tax incentives encouraging production for oil and gas producers, resulting in billions of dollars in estimated federal revenue losses. Moreover, partly because of lower natural gas prices, domestic coal production decreased in recent years as utilities switched from coal to natural gas for electricity generation.
Nuclear energy. Declining prices for a competing energy source—natural gas—may have led to decreases in the production and consumption of nuclear energy in recent years. Federal activities may have also influenced this trend. For example, the Department of Energy (DOE) announced plans to terminate its work to license a disposal facility for certain nuclear power plant waste in 2009, creating uncertainty about how this waste would be managed. This uncertainty may have provided a disincentive for some nuclear power operators to stay in the market or expand capacity because of the cost of storing nuclear waste.
Renewable energy. Federal tax credits for ethanol and federal policies requiring the use of ethanol in transportation fuels were major factors influencing an 8-fold increase in the production and consumption of ethanol from 2000 to 2013.
State policies requiring the use of renewable energy in electricity production, as well as federal outlays and tax credits for renewable energy producers, were major factors influencing a 30-fold increase and a 19-fold increase in production and consumption of electricity from wind and solar energy, respectively, from 2000 to 2013
The federal government strengthened energy efficiency standards for vehicle fuel economy and consumer products such as appliances and lighting, provided electricity and transmission services to customers through its power marketing administrations and the Tennessee Valley Authority, and spent billions of dollars helping low-income households cover heating and cooling costs. In addition, the federal government supported research and development targeting a wide range of energy-related technologies at government- owned laboratories and through funding to universities and other research entities.
In pursuing the goals of a secure energy supply and a healthy environment, the federal government subsidizes or otherwise provides support to energy companies and consumers.2 For example, the federal government provides tax incentives and other support to promote the domestic production of energy (including the extraction of coal, oil, and natural gas) and the development of renewable energy (including wind and solar power). The federal government also intervenes in energy markets in other ways, such as setting standards and requirements (through laws and regulations) that may not be directed at specific sources of energy but that nonetheless may influence the types and quantities of energy that are produced or consumed. For example, the federal government promotes energy efficiency through appliance efficiency standards that are written into law and regulates pollutants that are created in the production and consumption of energy. See CRS, Energy Tax Policy: Historical Perspectives on and Current Status of Energy Tax Expenditures (Washington, D.C.: May 2, 2011) and Tax-Favored Financing for Renewable Energy Resources and Energy Efficiency (Washington, D.C.: Jan. 10, 2011).
The federal government has established a number of important energy policies over the past decade, and several federal organizations have studied some of the costs associated with these policies. For example, Congress passed several key laws affecting energy producers and consumers over the past 10 years, including the Energy Policy Act of 2005 (EPAct), the Energy Independence and Security Act of 2007 (EISA), and the American Recovery and Reinvestment Act of 2009 (Recovery Act). Several federal organizations, including the Department of Energy’s (DOE) Energy Information Administration (EIA), CRS, and the Congressional Budget Office (CBO), have published reports identifying and quantifying aspects of federal support for energy production and consumption associated with these policies. In general, these reports focused on costs associated with federal energy-related tax incentives, outlays, or loan or loan guarantee programs.
We also reviewed reports and studies from federal agencies and government organizations, including CBO, CRS, DOE, Department of the Treasury (Treasury), EIA, congressional Joint Committee on Taxation (JCT), Office of Management and Budget (OMB), and U.S. Department of Agriculture (USDA). To identify these reports and studies, we conducted searches of various databases, such as ProQuest and PolicyFile, and asked agency officials to recommend studies. In addition, we reviewed and analyzed data and documentation on outlays, royalties collected, excise taxes collected, tax expenditures, forgone royalties, and federal credit programs collected from DOE, Department of the Interior (Interior), JCT, OMB, and Treasury.
The United States consumes energy from three major categories of Energy fossil, nuclear, and renewable.
In 2013, the United States consumed over 97 quadrillion British thermal units (Btu)7 of energy, including over 12 quadrillion Btus of imported energy, according to EIA data. As shown in figure 1, most of this energy (or about 82 percent) came from fossil energy sources. The rest came from renewable and nuclear energy sources.
Btus are used to measure and compare the energy content of different energy sources. A Btu can be defined as the quantity of heat required to raise the temperature of one pound of water by one degree Fahrenheit. One quadrillion is equal to one thousand trillion. In physical terms, one quadrillion Btus is equivalent to the energy contained in 172 million barrels of crude oil, which is about how much petroleum the United States consumes in 9 days.
There are four major sectors of the U.S. economy that consume energy at the point of end use: • the industrial sector, which includes facilities and equipment used for manufacturing, agriculture, mining, and construction; • the transportation sector, which generally comprises vehicles (such as cars, trucks, buses, trains, aircraft, and boats, among others) that transport people or goods; • the residential sector, which consists of homes and apartments; and • the commercial sector, which includes buildings such as offices, malls, stores, schools, hospitals, hotels, warehouses, restaurants, and places of worship, among others, as well as federal, state, and local facilities and equipment.
End-use sectors obtain energy from different combinations of sources. The industrial sector mainly consumes natural gas and electricity but also uses some petroleum products as feedstock. The transportation sector mainly consumes gasoline, diesel, and jet fuel; it also consumes biofuels and natural gas, as well as small amounts of electricity. The residential and commercial sectors mainly consume energy from electricity and natural gas but also use some petroleum products. As described above, every sector consumes electricity produced by the electric power sector, which takes electricity generated from fossil, nuclear, or renewable energy and delivers it to the end-use sectors through transmission and distribution lines. As shown in figure 2, the industrial sector consumed the largest share of energy (32 percent or 31.3 quadrillion Btus) in 2013, followed by the transportation, residential, and commercial sectors.
Not all of the energy produced is available for consumption at the point of end use, mainly because energy losses occur whenever energy is converted from one form to another. For example, coal-fueled power plants produce electricity by burning coal in a boiler to heat water and produce steam. The steam, at tremendous pressure and temperature, flows into a turbine, which spins a generator to produce electricity. During this process, the burning of coal produces heat energy, some of which converts water into steam. In turn, some of the energy in the steam is converted into electrical energy. At each point in this process, some of the original energy contained in the coal is lost.9 According to EIA, about twothirds of the energy consumed to generate electricity is lost in conversion, and most of these losses occur in fossil-fueled and nuclear power plants that generate steam to turn turbines.
In addition to conversion losses, other losses include power plant use of electricity, as well as transmission and distribution of electricity from power plants to end-use consumers (also called “line losses”). See EIA, Monthly Energy Review (Washington, D.C.: November 2013).
The federal government supports or intervenes in U.S. energy production and consumption through a number of key methods, including (1) setting standards and requirements, (2) directly providing goods and services, (3) assuming risk, (4) providing funds, and (5) collecting or forgoing revenue from taxes or fees. The federal government also conducts and provides funding for energy-related R&D.
The federal government provides some goods or services directly—that is, through a government agency—rather than providing funds to another entity to provide these goods or services. For example, the federal government may produce and sell electricity generated at federally owned facilities and produce reports and information on energy markets, among other things. Government provision of goods or services may be deemed necessary to address certain circumstances, such as economic inequalities among segments of the public or a need for a good or service considered unlikely to be met by the private sector. Such activities may affect energy producers and consumers in different ways. For example, production and sales of electricity generated at federally-owned facilities may involve energy sources and prices that differ from those of electricity produced and sold by private market participants.
The federal government assumes risk (and potential costs associated with risk) in a number of ways, such as • making direct loans—disbursing funds to nonfederal borrowers under contracts requiring the repayment of such funds either with or without interest; • guaranteeing loans—providing a guarantee, insurance, or other pledge regarding the payment of all or a part of the principal or interest on any debt obligation of a nonfederal borrower to a nonfederal lender; • limiting liability; and • providing or subsidizing insurance.
By assuming some or all of the costs associated with risks for certain energy activities, the government may make those activities relatively less expensive, thus providing an incentive to pursue those activities. For example, if the federal government assumes the risk of default on a loan to a manufacturer of turbines (that generate electricity from wind energy), nonfederal lenders may offer a lower interest rate to the manufacturer than they would in the absence of the federal guarantee. Lowering the costs of capital for developers could result in certain projects being financed that would otherwise not be built.
The federal government directly provides (or outlays) funds for different purposes. For example, federal agencies purchase energy for their buildings, as well as vehicles and fuel for these vehicles.
Collecting or Forgoing Revenues
The federal government collects revenues using different methods. One prominent method is through the tax system, which includes personal income taxes, corporate income taxes, and excise taxes based on the value of goods and services sold, among other types of taxes.19 The primary purpose of the federal tax system is to collect the revenue needed to fund the operations of the federal government.
The federal government also collects revenues associated with its management of federal lands. The federal government owns and manages roughly 30 percent of the nation’s total surface area (or about 700 million acres onshore). It also has jurisdiction and control over the outer continental shelf, which includes about 1.8 billion acres of submerged lands in federal waters off the coast of Alaska, in the Gulf of Mexico, and off the Atlantic and Pacific coasts.20 The federal government leases federal lands for the production of oil, gas, minerals such as coal, or other resources. In exchange, the government generally collects revenues, including payments in the form of rents and bonuses, which are required to secure and maintain a lease, and royalties, which are based on the value of the minerals that are extracted.
However, the federal government may choose to forgo certain revenues. Tax expenditures are tax provisions that are exceptions to the “normal structure” of individual and corporate income tax necessary to collect federal revenue. These preferences can have the same effects as government spending programs; hence the name tax expenditures.2The Congressional Budget and Impoundment Control Act of 197423 identified six types of tax provisions that are considered tax expenditures when they are exceptions to the normal tax, as described in table 1. Tax expenditures may affect the behavior of energy producers and consumers by providing an incentive to engage in certain types of activities. For some tax expenditures, forgone revenues can be of the same magnitude or larger than related federal spending for some mission areas.
The outer continental shelf consists of submerged federal lands, generally extending seaward between 3 and 200 nautical miles off the coastline. EIA estimated that 28 percent of all fossil energy produced in the United States in 2012 was obtained on federal lands (including submerged lands in the outer continental shelf).
In addition to forgoing tax revenues, the federal government may choose to forgo revenues associated with its leases of federal lands and waters. “Royalty relief” is a waiver or reduction of royalties that companies would otherwise be obligated to pay for their leases of federal lands or waters. For example, the Outer Continental Shelf Deep Water Royalty Relief Act of 199525 mandated royalty relief for oil and gas leases issued in the deep waters of the Gulf of Mexico from 1996 to 2000.
The federal government plays a critical role in supporting energy-related R&D, which may involve conducting R&D at government-owned laboratories or funding another entity to conduct R&D. For example, as one of the largest research agencies in the federal government, DOE spends billions of dollars every year on R&D to support its diverse missions, including advancing scientific research and technology development and ensuring efficient and secure energy, among other things. However, because long time lags may occur between basic research activities and activities related to commercialization and deployment, it is often difficult to link government-funded R&D to specific effects on energy production, consumption, and prices in the future. DOE’s R&D covers a broad range of activities, and DOE program offices manage 17 national laboratories.
The following DOE program offices and laboratories primarily support energy-related R&D: • The Office of Science oversees six national laboratories with research areas focusing on energy: Ames Laboratory in Iowa, Argonne National Laboratory in Illinois, Brookhaven National Laboratory in New York, Oak Ridge National Laboratory in Tennessee, Pacific Northwest National Laboratory in Washington, and Princeton Plasma Physics Laboratory in New Jersey. The Office of Science is the nation’s single largest funding source for supporting research in energy sciences. For purposes of this report, we included activities related to technology demonstration as part of R&D and excluded activities related to commercialization and deployment. Commercialization includes efforts to transition technologies to commercial applications by bridging the gap between research and demonstration activities and venture capital funding and marketing activities. Deployment includes efforts that facilitate or achieve widespread use of technologies in the commercial market.
- The Office of Nuclear Energy oversees the Idaho National Laboratory in Idaho. The office’s primary mission is to advance nuclear power as a resource capable of meeting the nation’s energy, environmental, and national security needs by resolving technical, cost, safety, proliferation resistance, and security barriers. • The Office of Fossil Energy oversees the National Energy Technology Laboratory in Pennsylvania. The office’s primary mission is to ensure reliable fossil energy resources for clean, secure, and affordable energy while enhancing environmental protection. • The Office of Energy Efficiency and Renewable Energy oversees the National Renewable Energy Laboratory in Colorado. The office’s mission is to develop solutions for energy-saving homes, buildings, and manufacturing; sustainable transportation; and renewable electricity generation
Federal agencies other than DOE also provide funding for energy-related R&D. For example, as we found in February 2012, the Department of Defense and USDA implemented numerous initiatives to help develop renewable energy technologies.28 In addition, as we found in August 2012, the National Aeronautics and Space Administration, National Science Foundation, EPA, and National Institute of Standards and Technology implemented a number of energy initiatives related to batteries and energy storage.29 28GAO, Renewable Energy: Federal Agencies Implement Hundreds of Initiatives, GAO-12-260 (Washington, D.C.: Feb. 27, 2012). 29GAO, Batteries and Energy Storage: Federal Initiatives Supported Similar Technologies and Goals but Had Key Differences, GAO-12-842 (Washington, D.C.: Aug. 30, 2012).
U.S. Production and Consumption of Fossil Energy
several major factors influenced U.S. production and consumption of fossil energy from 2000 through 2013: • Advances in drilling technologies enabled economic production of natural gas from shale and other tight formations. These advances led to increases in domestic production of natural gas starting around 2008 and contributed to declines in domestic prices of natural gas starting around 2009. As domestic production rose and prices declined, domestic consumption increased, imports of natural gas decreased, and companies began taking steps to gain approval to export liquefied natural gas. • The same advances in drilling technologies also enabled the economic production of crude oil from shale formations. These advances led to increases in the domestic production of crude oil beginning around 2009, reversing a decades-long trend of decreasing production. Global crude oil prices generally increased between 2000 and 2013, the largest, sustained price increase since comparable data were available. Increased domestic production contributed to lower prices for some regions of the country; however, the impact of increased domestic crude oil production on global crude oil prices was likely small. Imports of crude oil decreased beginning around 2008 as domestic production displaced imported crude oil to U.S. petroleum refiners. Around 2010, U.S. refiners began consuming greater quantities of crude oil to produce more petroleum products. As domestic consumption of petroleum products generally decreased beginning around 2008, exports of petroleum products (mostly diesel fuel) increased.
Natural gas and crude oil are found in a variety of geological formations. Conventional natural gas and crude oil are found in deep, porous rock or reservoirs and can flow under natural pressure to the surface after drilling. In contrast, the low permeability of some formations, including shale, means that natural gas and crude oil trapped in the formation cannot move easily within the rock. Tight formations refer to low permeability formations that include shale as well as sandstones and carbonates.
Due in part to lower prices of natural gas, the use of coal for electricity generation decreased in recent years as utilities switched to natural gas. Domestic coal production decreased in recent years; however, coal exports increased as domestic consumption declined faster than domestic production.
Major Factors Influencing U.S. Production and Consumption of Nuclear Energy
According to the studies and reports we reviewed, several major factors may have influenced U.S. production and consumption of nuclear energy from 2000 through 2013. Specifically, declining natural gas prices, along with the 2011 accident at Japan’s Fukushima Daiichi commercial nuclear power plant, may have led to decreases in the production and consumption of nuclear energy in recent years.
- Federal tax credits for ethanol and federal policies requiring the use of ethanol in transportation fuels were major factors influencing an 8-fold increase in the production and consumption of ethanol from 2000 through 2013. As domestic production of ethanol outpaced consumption in recent years, U.S. exports of ethanol increased. • State policies requiring the use of renewable energy in electricity production, as well as federal activities such as outlays and tax credits for renewable energy producers, were major factors influencing production and consumption of electricity from wind and solar energy. Technological advances also played an important role. These factors supported a 30-fold increase in production and consumption of wind energy from 2000 through 2013 and a 19-fold increase in the production and consumption of solar energy.
Other Federal Activities Influencing Aspects of U.S. Energy Production and Consumption
setting standards and requirements for energy efficiency, selling electricity, providing loans and loan guarantees related to energy efficiency, making outlays for energy consumption and energy efficiency, and forgoing revenues through tax expenditures for electricity transmission and energy efficiency, among other things
Natural Gas Production and Consumption
The year-to-year pattern of domestic production of natural gas fluctuated from 2000 through 2006 and then began to increase around 2007, according to Energy Information Administration (EIA) data, and as shown in figure 3. Specifically, the United States produced about 19.2 trillion cubic feet of natural gas in 2000; by 2005 and 2006, production had fallen below 19 trillion cubic feet but then began to increase, reaching over 24 trillion cubic feet in 2012 and 2013. Domestic consumption of natural gas exceeded domestic production throughout the period, with the difference coming from imports, primarily from Canada.1 However, as shown in figure 3, the difference between the domestic consumption and production of natural gas generally decreased between 2007 and 2013, leading to a reduction in natural gas imports.
the United States imported about 2.8 trillion cubic feet of natural gas from Canada and exported about 0.9 trillion cubic feet of natural gas to Canada and 0.7 trillion cubic feet to Mexico.
Natural gas is used by a number of sectors in the economy, most notably for electricity generation; for industrial use as a source of heat or as a feedstock for petrochemical production, among other things; for residential heating and other home uses; and for commercial heating and other uses.
according to EIA data, natural gas consumption for electricity generation (as well as other energy needs of the electric power sector) increased from about 5.2 trillion cubic feet in 2000 to about 8.2 trillion cubic feet in 2013. Natural gas consumption for commercial use also increased, from about 3.2 trillion cubic feet in 2000 to about 3.3 trillion cubic feet in 2013. Industrial and residential uses declined over the same period.
According to EIA data, natural gas withdrawals from shale formations increased from about 2 trillion cubic feet in 2007 to over 10 trillion cubic feet in 2012.
annual prices for natural gas in the Henry Hub spot market generally increased between 2000 and 2008 (although some fluctuations occurred) before decreasing between 2008 and 2013. Specifically, in 2000, the annual spot price was $4.31 per million British thermal units (Btu) of natural gas. This price generally increased to $8.69 per million Btus in 2005 and $8.86 per million Btus 2008. Since 2008, the annual price generally decreased to $3.73 per million Btus in 2013. 4CRS, Natural Gas in the U.S.
The primary users of petroleum products in the United States are the transportation and industrial sectors, according to EIA data. As shown in figure 9, the transportation sector consumed the largest share of petroleum products in 2000 and 2013 (at about 4.8 billion barrels). The industrial sector consumed the next largest share of petroleum products (at about 1.8 billion barrels in 2000 and about 1.7 billion barrels in 2013), while the remaining sectors (commercial, residential, and electric power) consumed the smallest share (at about 0.7 billion barrels in 2000 and about 0.3 billion barrels in 2013).
annual U.S. prices for bituminous and subbituminous coal generally increased from 2000 to 2012 (the latest year for which data are available). For example, for bituminous coal, prices increased from $24.15 per short ton in 2000 to $66.04 per short ton in 2012, or an increase of over 170 percent. Some of these cost increases may be due to increases in coal transportation costs and declines in mine productivity during this period, according to EIA.24 As the price of coal increased, it reduced coal’s price advantage relative to other energy sources, such as natural gas, which decreased in price over this period.
Figure 12: U.S. Coal Prices, 2000-2012
according to EPA, fossil fuel-fired electricity generating units are among the largest emitters of sulfur dioxide and nitrogen oxides, which have been linked to respiratory illnesses and acid rain, as well as of carbon dioxide, the primary greenhouse gas contributing to climate change. Numerous Clean Air Act requirements apply to electricity generating units, including New Source Review, a permitting process established in 1977. Under New Source Review, owners of generating units must obtain a preconstruction permit that establishes emission limits and requires the use of certain emissions control technologies. New Source Review applies to (1) generating units built after August 7, 1977, and (2) existing generating units—regardless of the date built—that seek to undertake a “major modification,” a physical or operational change that would result in a significant net increase in emissions of a regulated pollutant.
In general, the cost of complying with New Source Review requirements provided a disincentive for producing electricity from fossil energy sources. As we found in June 2012, EPA has investigated most coal-fired generating units at least once for compliance with New Source Review requirements since 1999, and has alleged noncompliance at more than half of the units it investigated.27 Specifically, of the 831 units EPA investigated, 467 units were ultimately issued notices of violation, had complaints filed in court, or were included in settlement agreements. In total, EPA reached 22 settlements covering 263 units, which will require affected unit owners to, among other things, install around $12.8 billion in emissions controls. According to our analysis of EPA data, these settlements will reduce emissions of sulfur dioxide by an estimated 1.8 million tons annually, and nitrogen oxides by an estimated 596,000 tons annually.
The federal government assumed some risks related to fossil energy production and consumption from 2000 through 2013. For example, the federal government assumed financial risks associated with potential cleanup costs for some oil spills, and the federal government acquired billions of dollars worth of crude oil to hold in reserve in case of supply disruptions, as discussed below:
Cleanup costs for oil spills. Under the Oil Pollution Act of 1990, as amended, which was enacted after the Exxon Valdez oil spill in 1989, the federal government established a “polluter pays” system that places the primary burden of liability for costs of spills on the responsible parties, up to a specified limit of liability.28 In general, the level of potential financial liability under the act depends on the kind of vessel or facility from which a spill originates and is limited in amount. However, if the oil discharge is the result of gross negligence or willful misconduct, or a violation of federal operation, safety, and construction regulations, then liability under the act is unlimited. In addition, the act provides the Oil Spill Liability Trust Fund to pay for oil spill costs when the responsible party cannot or does not pay. The fund’s primary revenue source is an 8-cent-per-barrel tax on petroleum products—a small fraction of the price of a barrel in 2013— either produced in the United States or imported from other countries. The fund is subject to a $1 billion cap on the amount of expenditures from the fund per incident.
Stockpiling crude oil. Congress created the Strategic Petroleum Reserve in 1975, following the Arab oil embargo of 1973 to 1974, to help protect the U.S. economy from damage caused by oil supply disruptions. The reserve is owned by the federal government and operated by DOE. It can store up to 727 million barrels of crude oil in salt caverns. The President has discretion to authorize release of oil in the Strategic Petroleum Reserve to minimize significant supply disruptions.31 In the event of such a disruption, the reserve can supply oil to the market by either selling stored crude oil or trading this oil in exchange for a larger amount of oil to be returned later. From fiscal year 2000 through 2013, the federal government received almost $3.9 billion from the sale of crude oil from the reserve, spent about $0.5 billion to purchase crude oil, and spent $2.5 billion for operations and maintenance of the reserve.
The assumption of liability by the federal government for some oil spills may have provided an incentive for oil production and consumption by potentially decreasing the overall cost associated with certain productionrelated activities. For example, the liability limitations established under the Oil Pollution Act may have lowered costs for liability insurance or other insurance paid for by oil producers. However, the extent to which this federal intervention influenced changes in petroleum or natural gas production or consumption is difficult to precisely measure. Moreover, the fund—which is paid by oil producers—raises the cost of producing oil by a small fraction, which may have a negative impact on oil production.
This tax generated about $2.8 billion for the fund from 2000 through 2012, the most recent data reported by the Internal Revenue Service. The tax is scheduled to expire to expire in 2017, putting the federal government’s longer-term ability to provide financial support in response to oil spills at risk, as we found in October 2011. See GAO, Deepwater Horizon Oil Spill: Actions Needed to Reduce Evolving but Uncertain Federal Financial Risks, GAO-12-86 (Washington, D.C.: Oct. 24, 2011).
From 2000 through 2013, the federal government collected revenues through excise taxes and royalty payments related to fossil energy production and consumption while forgoing other related revenues through tax expenditures and royalty relief. Regarding excise taxes, the federal government collected about $637 billion through excise taxes targeting or related to fossil energy—primarily motor fuels (gasoline, diesel, and others)—from fiscal year 2000 through 2012. The federal excise tax rate on gasoline is 18. 4 cents per gallon (the same amount as in 1993). Most revenues from these taxes are dedicated to the Highway Trust Fund, which was established by Congress in 1956 and is a major source of funding for various surface transportation programs.36 As shown in figure 13, revenues from excise taxes targeting or related to fossil energy were about $45 billion a year from fiscal year 2000 through 2004 and increased to about $50 billion a year for the rest of the period.
Of the 18.4 cent per gallon tax, 0.1 cents is dedicated to the Leaking Underground Storage Tank Trust Fund; the remainder is dedicated to the Highway Trust Fund.
Regarding royalty payments, the federal government collected more than $124 billion in revenues from royalty and other payments for federal oil, gas, and coal leases from fiscal year 2003 through 2013.37 As shown in figure 14, revenues from royalty and other payments increased from almost $8 billion in fiscal year 2003 to $23.4 billion in fiscal year 2008, then decreased to about $9 billion in fiscal years 2009 and 2010 before increasing to about $13.2 billion in fiscal year 2013.
Regarding tax expenditures, the federal government incurred revenue losses of almost $50 billion from fiscal year 2000 through 2013 due to 16 tax expenditures we identified as targeting or related to fossil energy according to the Department of the Treasury (Treasury) and the Joint Committee on Taxation (JCT) estimates. As shown in figure 15, revenue losses associated with these 16 tax expenditures increased from less than $2 billion in fiscal year 2000 to over $4.6 billion in both fiscal year 2006 and 2007. They decreased from fiscal year 2007 through 2010 before increasing to about $4.6 billion in fiscal year 2012 and declining to $4.1 billion in fiscal year 2013.
The tax code provides a credit of $3 per oil-equivalent barrel of production (in 1979 dollars) for certain types of liquid, gaseous, and solid fuels produced from selected types of alternative energy sources (or “nonconventional fuels”). Qualifying fuels include synthetic fuels (such as coke or coke gas) produced from coal, as well as gas produced from biomass, among other things. The credit is generally available if the price of oil stays below $29.50 (in 1979 dollars). The tax code allows firms that extract oil, gas, or other minerals a deduction to recover their capital investment in a mineral reserve, which depreciates due to the physical and economic depletion or exhaustion as the mineral is recovered. There are two methods of calculating this deduction: cost depletion and percentage depletion. Cost depletion allows for the recovery of the actual capital investment—the costs of discovering, purchasing, and developing a mineral reserve—over the period during which the reserve produces income from the specified total recoverable units. Under this method, the total deductions cannot exceed the original capital investment. Under percentage depletion, the deduction for recovery of capital investment is a fixed percentage of the “gross income”—i.e., revenue—from the sale of the mineral. Because eligible taxpayers must claim the higher of cost or percentage depletion, total deductions under percentage depletion may exceed the capital invested to acquire and develop the reserve. The percentage depletion rate for oil and gas is 15 percent and is limited to average daily production of 1,000 barrels of oil, or its equivalent in gas, and only for wells located in the United States. Percentage depletion is available for independent producers and royalty owners but not for integrated producers.
Firms engaged in the exploration and development of oil, gas, or geothermal properties have the option of expensing rather than capitalizing certain intangible drilling and development costs. Intangible drilling and development costs are amounts paid by the operator for fuel, labor, repairs to drilling equipment, materials, hauling, and supplies. They are expenditures incidental to and necessary for drilling wells and preparing a site for the production of oil, gas, or geothermal energy. They include the cost to operators of any drilling or development work done by contractors under any form of contract.
Estimated revenue losses $14.83 billion No expiration under current law. No expiration under current law. $10.15 billion $7.50 billion Consumption Name Temporary 50 percent expensing for equipment used in the refining of liquid fuels Exceptions for publicly traded partnership with qualified income derived from certain energy-related activitiesd Credit for enhanced oil recovery costs Capital gains treatment of royalties on coal
Taxpayers may elect to expense 50 percent of the cost of qualified refinery property used to process liquid fuel from crude oil and other qualified fuels. The deduction is allowed in the taxable year in which the refinery property is placed in service. The remaining 50 percent of the cost is recovered using a 10-year recovery period. Eligible refineries must have a binding construction contract entered into before January 1, 2010. As of October 3, 2008, qualified refineries include those used in the refining of liquid fuels directly from shale or tar sands.
The tax code generally treats a publicly traded partnership—i.e., a partnership traded on an established securities market or secondary market—as a corporation for federal income tax purposes. However, a notable exception occurs if 90 percent of the gross income of a partnership is passive-type income, such as interest, dividends, real property rents, gains from the disposition of real property, and similar income or gains. In these cases, the partnership is exempt from corporate level taxation, thus allowing it to claim pass-through status for tax purposes. In general, publicly traded partnerships favor the owners of publicly traded partnerships whose main source of qualifying income is from energy related activities. In contrast to an otherwise similar corporation, the owners of such a publicly traded partnership are not subject to a corporate level tax.
Taxpayers may claim a credit equal to 15 percent of enhanced oil recovery costs. An enhanced oil recovery project is generally a project that involves the use of one or more tertiary recovery methods to increase the amount of recoverable domestic crude oil. Qualified costs include (1) amounts paid for depreciable tangible property; (2) intangible drilling and development expenses; (3) tertiary injectant expenses; and (4) construction costs for certain Alaskan natural gas treatment facilities. This credit is reduced over a $6 phase-out range when the reference price for domestic crude oil exceeds $28 per barrel (adjusted for inflation after 1991). This tax preference is currently phased out due to high crude oil prices.
Owners of coal mining rights who lease their property usually receive royalties on mined coal. If the owners are individuals, these royalties can be taxed at a lower individual capital gains tax rate rather than at the higher individual top tax rate.
Estimated revenue losses $3.87 billion No expiration under current law. $3.70 billione No expiration under current law. $1.98 billion No expiration under current law. $1.34 billion Consumption Name Credit for investment in clean coal facilities Amortization of air pollution control facilities Alternative fuel mixture creditf Accelerated depreciation recovery periods for specific energy property: natural gasg
An investment tax credit is available for selected types of advanced coal technologies. The Energy Improvement and Extension Act of 2008 allocated $1.25 billion in credits for power generation projects that use integrated gasification combined cycle or other advanced coal-based electricity generation technologies. Qualifying taxpayers may be eligible for a 30 percent credit. The Energy Improvement and Extension Act of 2008 also allocated $250 million in credits for qualified gasification projects (with a credit rate of 30 percent). Prior allocations were awarded under the Energy Policy Act of 2005 and provided $800 million for integrated gasification combined cycle projects and $500 million for other advanced coalbased electricity generation technologies. The Energy Policy Act of 2005 also allocated $350 million for qualified gasification projects. Prior to 2005, investments in pollution control equipment for pre-1976 coal-fired plants were amortizable over 5 years. In addition, pollution control equipment added to “newer” plants (those placed in service after 1975) was depreciated using the same methods that apply to other electric generating equipment on the date they are placed in service (15- or 20-year recovery period). However, under the Energy Policy Act of 2005, investments in pollution control equipment made in connection with post1975 power plants qualify for amortization over seven years rather than five years. Qualifying pollution control equipment means any technology that is installed in or on a qualifying facility to reduce air emissions of any pollutant regulated by the Environmental Protection Agency (EPA) under the Clean Air Act.
The tax code provides a 50-cents-per gallon excise tax credit for certain alternative fuels used as fuel in a motor vehicle, motor boat, or airplane and a 50-cents-per gallon credit for alternative fuels mixed with a traditional fuel (gasoline, diesel or kerosene) for use as a fuel. Examples of qualifying fuels include liquefied petroleum gas, compressed or liquefied natural gas, liquefied hydrocarbons derived from biomass, and liquefied hydrogen. If excise tax credits exceeded excise tax liability, the credits could be claimed as income tax credits or received as payments.
Estimated revenue losses $1.41 billion No expiration under current law. $1.30 billione Excise tax credits for alternative fuels expired after December 31, 2013. Excise tax credits for liquefied hydrogen fuel will expire after September 30, 2014. $0.97 billion Property had to be placed in service before January 1, 2011. $0.69 billion Consumption Name Amortization of geological and geophysical expenditures associated with oil and gas exploration Exception from passive loss limitation for working interests in oil and gas properties Carbon dioxide sequestration credit Deduction for small refiners with capital costs associated with EPA sulfur regulation compliance
Geological and geophysical costs — exploratory costs associated with determining the precise location and potential size of a mineral deposit — are amortized by independent producers over 2 years and by major integrated oil companies over 7 years. This provision exempts working interests (investments) in gas and oil exploration and development from being categorized as “passive income (or loss)” with respect to the Tax Reform Act of 1986. In general, a working interest is an interest with respect to an oil and gas property that is burdened with the cost of development and operation of the property. The exception allows owners of working interests to offset their losses from passive activities against active income. Under normal rules, passive losses that remain after being netted against passive income can only be carried forward to apply against passive income in future years. The exception from passive loss limitation provision on oil and natural gas properties applies principally to partnerships and individuals rather than corporations. This categorization permits the deduction of losses in oil and gas projects against other active income earned without limitation and is believed to act as an incentive to induce investors to finance oil and gas projects. A credit of $10 per metric ton is available for qualified carbon dioxide that is captured by the taxpayer at a qualified facility, used by such taxpayer as a tertiary injectant including carbon dioxide augmented waterflooding and immiscible carbon dioxide displacement) in a qualified enhanced oil or natural gas recovery project and disposed of by such taxpayer in secure geological storage. In addition, a credit of $20 per metric ton is available for qualified carbon dioxide captured by a taxpayer at a qualified facility and disposed of by such taxpayer in secure geological storage without being used as a tertiary injectant. Both credit amounts are adjusted for inflation after 2009.
A small business refiner may immediately deduct as an expense 75 percent of the costs paid or incurred for purposes of complying with EPA’s Highway Diesel Fuel Sulfur Control requirement. A cooperative that qualifies as a small business refiner may elect to pass this deduction through to its owners. Costs qualifying for the deduction are those costs paid or incurred with respect to any facility of a small business refiner during the period beginning on January 1, 2003, and ending on the earlier of the date that is 1 year after the date on which the taxpayer must comply with the applicable EPA regulations or December 31, 2009.
The tax code provides a tax credit for income taxes paid to foreign countries, which helps to protect taxpayers who earn income abroad from double taxation. If a multinational company is subject to a foreign country’s levy, and it also receives a specific economic benefit from that foreign country, it is classified as a “dual- capacity taxpayer.” Dual-capacity taxpayers cannot claim a credit for any part of the foreign levy unless it is established that the amount paid under a distinct element of the foreign levy is a tax, rather than a compulsory payment for some direct or indirect economic benefit. JCT estimated that repealing this provision will increase revenue related to oil and gas production by $7.5 billion from fiscal year 2012 through 2022.
In general, for federal income tax purposes, taxpayers must account for inventories if the production, purchase, or sale of merchandise is a material income-producing factor to the taxpayer. Under the last-in, first-out (“LIFO”) method, it is assumed that the last items entered into the inventory are the first items sold. Because the most recently acquired or produced units are deemed to be sold first, cost of goods sold is valued at the most recent costs; the effect of cost fluctuations is reflected in the ending inventory, which is valued at the historical costs rather than the most recent costs. Compared to first-in, first-out (“FIFO”), LIFO produces net income that more closely reflects the difference between sale proceeds and current market cost of inventory. When costs are rising, the LIFO method results in a higher measure of cost of goods sold and, consequently, a lower measure of income when compared to the FIFO method. The inflationary gain experienced by the business in its inventory is generally not reflected in income, but rather, remains in ending inventory as a deferred gain until a future period in which sales exceed purchases. JCT estimated that repealing this provision will increase revenue by $106 billion from fiscal year 2014 through 2024; while OMB estimated that repealing this provision will increase revenue by almost $81 billion from fiscal year 2014 through 2023. However, neither JCT nor OMB quantified how much of its revenue estimate is related to fossil fuel production.
Section 199 of the American Jobs Creation Act of 2004 allows a deduction of qualified production activities from taxable income of 3 percent in 2005-2006, 6 percent in 2007-2009, and 9 percent thereafter. The deduction cannot exceed total taxable income of the firm and is limited to 50 percent of wages related to the qualified activity. This provision lowers the effective tax rate on the favored property, in most cases when fully phased in, from the top corporate tax rate of 35 percent to 31.85 percent. Production property is property manufactured, produced, grown, or extracted within the United States. Eligible property also includes domestic film, energy, and construction, and engineering and architectural services. For the latter, the services must be produced in the United States for construction projects located in the United States. The law specifically excludes the sale of food and beverages prepared at a retail establishment, the transmission and distribution of electricity, gas, and water, and receipts from property leased, licensed, or rented to a related party. The benefits are also allowed for Puerto Rico for 2007 through 2011. Oil extraction is permanently limited to a 6 percent deduction. JCT estimated that repealing this provision will increase revenues related to oil and gas production by $14.4 billion from fiscal year 2012 through 2022; while OMB estimated $17.4 billion in revenue from fiscal year 2014 through 2023 related to fossil energy production.
Regarding royalty relief, the federal government provided nearly $12 billion in royalty relief for oil and gas production from 2000 through 2012, according to Interior estimates.39 As shown in figure 16, revenue losses associated with royalty relief increased from $40 million in 2000 to more than $2 billion in 2011, before declining to about $1.9 billion in 2012 (the most recent estimate available).
Excise taxes. Because excise taxes raised prices on motor fuels, they provided a disincentive for consuming such fuels.40 However, because much of the revenue from these excise taxes was used to improve roads and other transportation infrastructure, these taxes could also have provided an incentive for motor vehicle use and thereby increased consumption of motor fuels.
Compared with other countries within the Organization for Economic Cooperation and Development, the United States has one of the lowest excise tax rates for motor fuels.
Royalties. Because royalty payments raised costs associated with the development and sales of fossil energy, they provided a disincentive to produce and consume fossil energy. However, we cannot say to what extent the federal royalties provided a disincentive for oil and gas development on federal lands relative to other places because oil and gas companies that lease federal lands look for the best economic terms across a wide range of land owners (such as state, private, federal, and international owners). We found in 2008 that studies of many resource owners indicated that the federal government collected less in total revenues than most other resource owners,41 but we do not have more recent comparisons of revenues collected.
Tax expenditures and royalty relief. In general, tax expenditures and royalty relief provided incentives for fossil energy production by lowering the costs associated with the exploration and development of oil and gas resources.
U.S. nuclear energy production and consumption trends may also have been affected, to a more limited extent, by increases in the price of uranium oxide, which is processed into fuel used by nuclear power reactors. As shown in figure 18, uranium oxide prices have increased considerably from 2000 to 2013, according to EIA data. Specifically, the average domestic price of uranium oxide increased from $11.45 per pound in 2000 to $52.51 per pound in 2013, an increase of more than 300 percent.
The federal government established or strengthened a number of standards and requirements related to nuclear energy from 2000 through 2013. For example, after the Fukushima incident, the Nuclear Regulatory Commission (NRC) accepted 12 recommendations from a task force that NRC had convened in 2011 to review its processes and regulations and determine whether lessons learned from the accident could inform its oversight processes. The task force recommended that NRC require licensees to reevaluate and upgrade seismic and flooding protection of reactors and related equipment, strengthen capabilities at all reactors to withstand loss of electrical power, and take other actions to better protect their plants for a low- probability, high-impact event.3 NRC’s activities to strengthen the safety and security of nuclear power plants after the Fukushima incident may have increased the costs associated with operating commercial nuclear power reactors, thereby providing a disincentive for nuclear power production.
Federal activities related to the Yucca Mountain repository may have provided a disincentive for nuclear energy production and consumption. For example, DOE’s actions regarding its license application for the construction of the repository may have caused uncertainty about the federal government’s long-term strategy for storing nuclear waste because Congress has not agreed upon a path forward. This uncertainty may have provided a disincentive for some nuclear plant operators to stay in the market or expand capacity because storing nuclear waste is expensive.
Assuming Risk
The federal government assumed certain risks related to nuclear energy production and consumption from 2000 through 2013. For example, under the Price-Anderson Act, the federal government limited the liability of nuclear plant operators in the case of a nuclear accident.8 The act requires each licensee of a nuclear plant to have primary insurance coverage equal to the maximum amount of liability insurance available from private sources—currently $375 million—to settle any such claims against it. In the event of an accident at any plant where liability claims exceed the $375 million primary insurance coverage, the act also requires licensees to pay retrospective premiums (also referred to as secondary insurance). The act places a limit on the total liability per incident, which is currently about $13 billion
In addition, the federal government assumed risks related to nuclear energy production and consumption by establishing a loan guarantee program. Specifically, Section 1703 of the Energy Policy Act of 200510 authorized DOE to issue loan guarantees for projects that avoid, reduce, or sequester greenhouse gases using new or significantly improved technologies. In 2010, DOE made conditional commitments under Section 1703 to provide $8.3 billion in loan guarantees for the construction of two advanced nuclear reactors at the Vogtle Electric Generating Plant in Georgia.
These federal activities provided an incentive for nuclear energy production and consumption by decreasing the overall cost associated with certain production-related activities. For example, according to the Congressional Budget Office (CBO), the Price- Anderson Act provides a benefit to nuclear plant operators by reducing their cost of carrying liability insurance.12 CBO estimated that the potential level of support was about $600,000 annually per reactor, which would be about $62 million annually for all reactors in the United States. Without the liability limitations provided by the Price- Anderson Act, the cost of obtaining insurance for nuclear power plant operators might have been higher. Consequently, the act may have supported higher levels of nuclear power production in the United States between 2000 and 2013 than would have otherwise occurred because the lower cost provided an incentive for increased production and consumption.
The insurance coverage has two layers: The owner of a nuclear plant is required to purchase primary insurance covering liability up to $375 million. In the event of an accident, liability for damages assessed at between $375 million and $13 billion would then be shared among the owners of all U.S. nuclear plants, who would pay a “retroactive premium.
DOE issued about $6.2 billion of these loan guarantees in February 2014. For more information, see GAO, DOE Loan Programs: DOE Should Fully Develop Its Loan Monitoring Function and Evaluate Its Effectiveness, GAO-14-367 (Washington, D.C.: May 1, 2014). 12CBO, Nuclear Power’s Role in Generating Electricity (Washington, D.C.; May 2008).
Forgoing Revenue
The federal government incurred revenue losses related to nuclear energy production and consumption from 2000 through 2013. Specifically, we identified one tax expenditure targeting nuclear energy that resulted in $7.9 billion in revenue losses from fiscal year 2000 through 2013.13 This tax expenditure—the special tax rate for nuclear decommissioning reserve funds—increased from $100 million in fiscal year 2000 to $1.1 billion in fiscal year 2013, as shown in figure 19. Under the special tax rate for nuclear decommissioning reserve funds, taxpayers (e.g., utilities) who are responsible for the costs of decommissioning nuclear power plants can elect to create reserve funds to be used to pay for decommissioning. The funds receive special tax treatment: amounts contributed are deductible in the year the contributions are made and are not included in the taxpayer’s gross income until the year they are distributed, thus effectively postponing tax on the contributions. Amounts actually spent on decommissioning are deductible in the year they are made. Gains from the funds’ investments are subject to a 20 percent tax rate—a lower rate than that which applies to most other corporate income.14 In general, this tax expenditure supported nuclear energy production and consumption by lowering the costs of nuclear energy production and providing an incentive to engage in nuclear power production.
Major Factors Influencing Ethanol Production and Consumption
The studies and reports we reviewed indicated that several federal activities had a major impact on the increase in ethanol production and consumption—most notably federal tax expenditures and requirements for the use of ethanol in transportation fuel. Regarding federal tax expenditures, alcohol fuel credits provided a 45-cent-per-gallon tax credit to gasoline suppliers who blend ethanol with gasoline.4 According to the Department of the Treasury (Treasury) data, the alcohol fuel credits resulted in more than $39 billion in revenue losses from fiscal year 2000 through 2013. As shown in figure 22, revenue losses associated with alcohol fuel credits increased from about $0.9 billion in fiscal year 2000 to $7 billion in fiscal year 2011, before decreasing to $3.7 billion in fiscal year 2012
In recent years, the United States also increased imports of ethanol from Brazil to meet renewable fuel requirements for advanced biofuels. Brazilian ethanol is made from sugarcane and qualifies as an advanced biofuel, while domestic ethanol produced from corn does not.
The 45-cents-per-gallon tax credit is also referred to as the volumetric ethanol excise tax credit. The federal government also provided tax credits (and a related excise tax credit) for biodiesel. See appendix VI for more information on the alcohol fuel credits and biodiesel credits.
The alcohol fuel credits generally expired in 2011, but some taxpayers were still able to claim the credit in 2012 and 2013 due in part to the timing and method of taxpayer filing and Internal Revenue Service processing, according to Treasury officials.
In our previous work, we found that the alcohol fuel credits were important in establishing and expanding the domestic ethanol industry. , Biofuels: Potential Effects and Challenges of Required Increases in Production and Use, GAO-09-446 (Washington, D.C.: Aug. 25, 2009).
Requirements for federal fleets to use ethanol and other alternative fuels. The Energy Policy Act of 1992 requires that 75 percent of all vehicles acquired by the federal fleet in fiscal year 1999 and afterward be “alternative fuel vehicles,” which can use ethanol and blends of 85 percent or more of ethanol with gasoline, among other fuels. EPAct generally requires that all such vehicles be fueled with alternative fuel.11 In addition, EISA12 requires that no later than October 2015 and each year thereafter, agencies must achieve a 10 percent increase in vehicle alternative fuel consumption relative to a baseline established by the Energy Secretary for fiscal year 2005.
Another factor likely affecting ethanol production and consumption from 2000 through 2013 was the price of ethanol relative to the prices of corn and gasoline, according to U. S. Department of Agriculture (USDA) research. Ethanol prices generally increased from 2000 through 2013, according to USDA data, as shown in figure 23. Specifically, ethanol prices increased from an annual average of $1.35 per gallon in 2000 to $2.47 per gallon in 2013. Because ethanol is used as a gasoline substitute, and because nearly all ethanol produced in the United States comes from corn, the relationship between prices of ethanol, gasoline, and corn is complex. As gasoline prices rise, ethanol’s appeal as a substitute increases, as does the profitability of ethanol production and the demand for corn. As a result, according to USDA’s Economic Research Service, prices of corn, ethanol, and gasoline have become more interrelated in recent years.14 Specifically, from March 2008 to March 2011, ethanol supply and demand accounted for about 23 percent of the variation in the price of corn, while corn market conditions accounted for about 27 percent of ethanol’s price variation. At the same time, about 16 and 17 percent of gasoline price variation could be attributed to ethanol and corn markets conditions, respectively.
Wind is transformed into electricity using wind turbines. In terms of the electricity generated from wind turbines, domestic production and consumption of wind energy increased from 5.6 million megawatt-hours in 2000 to 167.7 million megawatt-hours in 2013
The studies and reports we reviewed indicated that the increase in wind and solar energy production and consumption resulted from a number of major factors—most notably state policies and federal activities, as well as technological advances. Regarding state activities, many states have created policies known as renewable portfolio standards that encouraged the production and use of renewable energy. These state policies generally require a percentage of electricity sold or generated in the state to come from eligible renewable resources, including wind and solar energy. According to EIA, 29 states and the District of Columbia had enforceable renewable portfolio standards or similar laws as of October
According to the Congressional Research Service (CRS), state policies have been the primary creator of demand for wind projects.
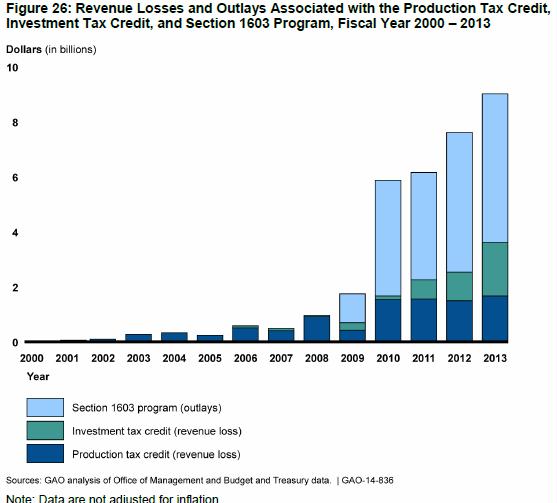
the federal government influenced increases in the production and consumption of wind and solar energy primarily through tax incentives. Specifically, the production tax credit and the investment tax credit, along with a related program that provided grants in lieu of these tax credits, resulted in almost $14 billion in revenue losses and almost $20 billion in outlays from fiscal year 2000 through 2013. These tax credits and grants, which are described below, supported wind and solar energy production by lowering the costs associated with production and providing an incentive to those firms engaged in the construction and operation of wind and solar energy projects. • Production tax credit. This credit provided a 10-year, inflation-adjusted income tax credit based on the amount of renewable energy produced at wind and other qualified facilities. The amount of the credit varied depending upon the source. The value of the credit was 2.2 cents per kilowatthour in 2012 for certain resources (e.g., wind, geothermal, and certain biomass electricity production) and was raised to 2.3 cents per kilowatthour in 2013. This credit resulted in about $9.6 billion in revenue losses from fiscal year 2000 through 2013. Specifically, as shown in figure 26, revenue losses associated with this tax credit increased from $40 million in fiscal year 2000 to $1.5 billion or more annually from fiscal year 2010 through 2013. This credit, which has periodically expired and then been extended, is available to facilities for which construction began before January 1, 2014. As we reported in March 2013, new additions of wind energy capacity fell dramatically in years following the credit’s expiration.
Investment tax credit. This credit, which has not expired, provides an income tax credit for business investments in solar systems and small wind turbines, among other things. Investments in solar and small wind turbine systems qualify for a 30 percent tax credit. In addition, temporary provisions enacted under the American Recovery and Reinvestment Act of 2009 (Recovery Act) allow taxpayers to claim this credit for property that otherwise would have qualified for the production tax credit. This credit resulted in over $4 billion in revenue losses from fiscal year 2000 through 2013. As shown in figure 26, no revenue loss estimates were reported for this tax credit from fiscal year 2000 through 2005; revenue losses then generally increased from $80 million in fiscal year 2006 to almost $2 billion in fiscal year 2013.
Section 1603 program. Section 1603 of the Recovery Act, as amended, allows taxpayers eligible for the production or investment tax credit to receive a payment from the Treasury in lieu of a tax credit. This Treasury program provided almost $20 billion in outlays from fiscal year 2009 through 2013, as shown in figure 26, of which about $13 billion were related to wind energy projects, and about $4 billion were associated with solar energy projects. This program, which is still available in some cases, applies to projects placed in service during 2009, 2010, or 2011, or afterward if construction began on the property during the specific years and the property is placed in service by a credit termination date (e.g., January 1, 2017 for certain energy property).
investment tax credit also provides a tax credit for geothermal systems, fuel cells, microturbines, and combined heat and power.
Figure 26: Revenue Losses and Outlays Associated with the Production Tax Credit, Investment Tax Credit, and Section 1603 Program, Fiscal Year 2000 – 2013
In addition to these tax credits, the studies and reports we reviewed indicated that the federal government provided incentives for the production and consumption of wind and solar energy in other important ways, including through the following activities:
- Requirements for purchasing electricity. Under EPAct, federal agencies’ consumption of electricity from renewable sources has generally been required— to the extent economically feasible and technologically practicable—to meet or exceed 5 percent of total consumption in fiscal years 2010 through 2012, and 7.5 percent in fiscal year 2013 and thereafter.23 According to DOE’s most recent
data, federal agencies spent about $57 million in electricity purchases from renewable sources in fiscal year 2012.
EPAct also required installation of 20,000 solar energy systems in federal buildings by 2010.
- Loan guarantees. DOE’s Title 17 Innovative Technology Loan Guarantee Program included a temporary program for the rapid deployment of renewable energy projects, among other things. As shown in table 4, DOE guaranteed 23 loans totaling more than $14 billion for wind and solar energy projects. Most of these loans (15 of 23) and most of the amount guaranteed went to projects to produce and sell electricity generated from solar energy. There have been two defaults on guaranteed loans, both for projects involving the manufacture of solar energy equipment. However, most of the long-term total estimated cost to the government is associated with solar generation projects.24 The authority to enter into loan guarantees under DOE’s temporary program expired on September 30, 2011.
Table 4: DOE’s Title 17 Innovative Technology Loan Guarantee Program Targeting Solar and Wind Energy, Fiscal Year 2000 – 2013 Dollars in billions Number of loan Amount of loan Number Estimated cost Type guarantees and loansa guarantees and loansb of defaults to the governmentc Solar generation 15 $11.62 0 $1.03 Solar manufacturing 4 $1.23 2 $0.62 Wind generation 4 $1.70 0 $0.04 Total 23 $14.55 2 $1.69 Sources: GAO analysis of DOE and
Office of Management and Budget data. | GAO-14-836 aThe number of guarantees and loans refers to all guarantees and loans that were issued, including three that were withdrawn or deobligated before any funds were drawn on the loans. bThe loan guarantee and loan amounts are the amounts at closing that appear in DOE’s accounting system. They include the full amount of the loans partially guaranteed through the Financial Institution Partnership Program and do not include capitalized interest. cThese costs are current estimates of the credit subsidy costs of disbursed amounts as reported in the President’s fiscal year 2015 budget. Credit subsidy costs represent the government’s estimated net long-term cost of extending or guaranteeing credit, in present value terms, over the entire period the loans are outstanding (not including administrative costs).
As a result of required federal purchases of electricity from renewable sources, the federal government provided incentives to produce wind and solar energy. In addition, through the loan guarantee program described above, the federal government assumed risks of defaults on loans to firms engaged in developing wind and solar energy projects. These federal actions had the potential to lower the costs for some of these projects. Such lower costs could have led to certain projects being financed that otherwise may not have been developed.
Outlays, and Loan Guarantees Related to Renewable Energy
Table 5 provides descriptions of the three federal tax expenditures we identified in appendix V as targeting or related to ethanol, wind energy, and solar energy, as well as four additional federal tax expenditures we identified as more broadly targeting or related to renewable energy. The table also provides information from the Department of the Treasury (Treasury) on tax expenditures that will or have expired, in full or in part, due to an expiration of legislative authority or some other expiration under the law as of the fall of 2014, as well as on tax expenditures that currently have no expiration. In addition, the table provides information on revenue loss estimates from Treasury (unless otherwise specified).
Alcohol fuel credits (including related excise tax credit) Description The tax code provides three income tax credits for alcoholbased motor fuels: the alcohol mixture credit (or blender’s credit), the pure alcohol fuel credit, and the small ethanol producer credit. The alcohol mixture credit is 45¢ per gallon of ethanol of at least 190 proof and is available to the blender (e.g., the refiner, wholesale distributor, or marketer). The alcohol mixture credit is typically claimed as an instant excise tax credit (referred to as the volumetric ethanol excise tax credit). The pure alcohol fuel credit is 45¢ per gallon of ethanol of at least 190 proof and can only be claimed by the consumer or retail seller. For small ethanol producers, the law also provides for a production tax credit in the amount of 10¢ per gallon of ethanol produced and sold for use as a transportation fuel. This credit is limited to the first 15 million gallons of annual alcohol production for each small producer, defined as one with an annual production capacity of fewer than 60 million gallons. This is in addition to any blender’s tax credit claimed on the same fuel. In addition, the tax code provides an income tax credit for cellulosic biofuels. The amount of the credit is $1.01 per gallon. In the case of cellulosic biofuel that is alcohol, the credit amount is reduced.
Most of these provisions expired as of December 31, 2011; the tax credit for cellulosic biofuels expired as of December 31, 2013.
Estimated revenue losses $39.28 billion Renewable Energy Name Production tax credit (also called energy production credit)a Biodiesel and small agri-biodiesel producer tax credits (including related excise tax credit) Investment tax credit (also called energy investment credit)b Description Taxpayers producing energy from a qualified renewable energy source may qualify for a tax credit on a per-kilowatthour basis. Qualified energy sources include wind, solar energy, geothermal energy, closed-loop and open-loop biomass, small irrigation power, municipal solid waste, qualified hydropower production, and marine and hydrokinetic renewable energy sources. The credit amount in 2012 was 2.2 cents per kilowatt-hour for wind, solar, closed-loop biomass, and geothermal energy sources and 1.1 cents per kilowatt-hour for other energy sources. The credit amount is based on the 1993 value of 1.5 cents per kilowatt-hour, which is adjusted annually for inflation. This credit is generally available for 10 years, beginning on the date when the facility is placed in service. For facilities placed in service during 2009, 2010, and 2011, taxpayers could claim an investment tax credit or Section 1603 cash payment in lieu of receiving the production tax credit.
The tax code provides three income tax credits for biodiesel: the biodiesel fuel mixtures credit (i.e., blends of biodiesel and petroleum diesel); the unblended (pure) biodiesel credit, which is either used or sold at retail by the taxpayer; and the small biodiesel producer credit. These tax credits are $1.00 per gallon of biodiesel, including agri-biodiesel (i.e., biodiesel made from virgin oils) and renewable biodiesel. The mixtures tax credit may be claimed as an instant excise tax credit against the 24.4 cents per gallon tax on diesel blends. In addition, the tax code provides an income tax credit of 10 cents per gallon for the first 15 million gallons of agri-biodiesel produced by small agri-biodiesel producers each year. Small agri- biodiesel producers are defined as those with a production capacity less than 60 million gallons per year. This credit can be taken in addition to the $1.00 per gallon income or excise tax credit on the sale of the agri-biodiesel produced by small producers.
The tax code provides an income tax credit for business investments in solar, fuel cells, small wind turbines, geothermal systems, microturbines, and combined heat and power. Solar, fuel cell, and small wind turbine investments qualify for a 30 percent credit. (The credit for fuel cells is limited to $1,500 per 0.5 kilowatt of capacity.) The tax credit for investments in geothermal systems, microturbines, and combined heat and power is 10 percent. (The credit for microturbines is limited to $200 per kilowatt of capacity.) Provisions enacted as part of the American Recovery and Reinvestment Act of 2009 (Recovery Act) allow (1) taxpayers to elect to claim this credit for property that otherwise would have qualified for the production tax credit and (2) taxpayers eligible for this credit to receive a Section 1603 payment from the Treasury in lieu of tax credits.
Expiration information Construction must have begun before January 1, 2014.
Estimated revenue losses $9.59 billion These provisions expired as of December 31, 2013. $5.84 billion In general, this provision will expire on December 31, 2016; however, the credit for solar investments will decrease to 10 percent, and the credit for geothermal investments will remain at 10 percent. $4.30 billion Renewable Energy Name Accelerated depreciation recovery periods for specific energy property: renewable energyc
Advanced energy property credite Description A taxpayer is allowed to recover, through annual depreciation deductions, the cost of certain property used in a trade or business or for the production of income. The tax code provides a 5-year recovery period for certain renewable energy equipment, including solar, wind, geothermal, fuel cell, combined heat and power, and microturbine property. Renewable energy generation property that is part of a “small electric power facility” and certain biomass property are also recovered over 5 years. However, the Economic Stimulus Act of 2008 included a 50 percent first-year bonus depreciation provision for a wide range of eligible properties including renewable energy systems. This provision was extended by the Recovery Act, and by the Creating Small Business Jobs Act of 2010. Bonus depreciation was further extended through 2012 by the Tax Relief, Unemployment Insurance Reauthorization, and Job Creation Act of 2010, with a 100 percent deduction allowed for property acquired after September 8, 2010, and before January 1, 2012. The American Taxpayer Relief Act of 2012 extended 50 percent expensing for qualifying property purchased and placed in service before January 1, 2014. The 50 percent bonus depreciation narrowed any tax differences between eligible assets based on cost recovery provisions, and the 100 percent bonus depreciation eliminated those differences altogether under the provision for allowing a full write-off of asset acquisition costs.
The Recovery Act established a 30 percent tax credit for qualified investments in advanced energy property. Advanced energy projects that may qualify for the tax credit include those that reequip, expand, or establish eligible manufacturing facilities. Facilities that produce the following types of property may qualify: (1) property designed to produce energy using a renewable resource (i.e., solar, wind, geothermal), (2) fuel cells, microturbines, or energy storage systems for use with electric or hybrid-electric vehicles, (3) advanced transmission technologies that support renewable generation (including storage), (4) carbon capture and sequestration property, (5) property designed to refine or blend renewable fuels, (6) energy conservation technologies (i.e., energy-saving lighting or smart grid technologies), (7) plug-in electric vehicles and components, and (8) other advanced energy property designed to reduce greenhouse gas emissions. A total of $2.3 billion was allocated for advanced energy property investment tax credits. The tax credits were competitively awarded by the Department of Energy (DOE) and Treasury. Taxpayers receiving this credit cannot also claim the investment tax credit.
Expiration information Property had to be placed in service by January 1, 2014 (or January 1, 2015 for certain other assets) to quality for bonus depreciation. The 5-year recovery period for certain solar equipment will expire on December 31, 2016.
Estimated revenue losses $1.70 billiond No expiration under current law (other than the credit allocation limit). $1.40 billion
Renewable Energy Name Credit for holding clean renewable energy bonds
New clean renewable energy bonds help tax-exempt entities finance capital expenditures for new facilities that produce electricity from renewable sources. Bond holders receive tax credits at 70 percent of the tax credit interest rate, in lieu of interest payments. These bonds may be issued by a public power provider, a cooperative electric company, a governmental body, a clean renewable energy bond lender or a not-for-profit electric utility that has received a loan or loan guarantee under the Rural Electrification Act. Treasury publicly solicited applications for an initial volume cap, set by Congress at $800 million, and awarded allocations based on criteria and applications received. An additional $1.6 billion in new clean renewable energy bond authorization was provided under the Recovery Act. In March 2010, provisions included in the Hiring Incentives to Restore Employment Act allowed issuers of clean renewable energy bonds (and other qualified tax-credit bonds) to receive a direct payment from the Treasury instead of providing tax credits to bondholders.
Table 6 provides a description of the federal program we identified in appendix V as targeting or related to wind and solar energy, as well as two additional federal programs we identified as more broadly targeting or related to renewable energy. The table also provides information reported by the Office of Management and Budget (OMB) on outlays.
Section 1603 of the Recovery Act, as amended, established a program to provide payments to eligible applicants who place specified energy property (related to renewable energy, among other things) in service for use in a trade or business. Applicants could take the payment in lieu of either a production or investment tax credit. These payments provide an incentive for investment in property for electricity production, particularly those applicants without sufficient tax liability to utilize a nonrefundable tax credit. The program provided payments for eligible energy projects placed in service during 2009, 2010, or 2011, or after 2011 if construction began on the property during 2009, 2010, or 2011 and the property is placed in service by a certain date known as the credit termination date (e.g., Jan. 1, 2017 for certain energy property). The Bioenergy for Advanced Biofuels program, authorized under the Food, Conservation, and Energy Act of 2008, provides payments to eligible producers to support and ensure an expanding production of advanced biofuels, which are defined as fuel derived from renewable biomass other than corn kernel starch. The amount of each payment depends on the number of producers participating in the program, the amount of advanced biofuels being produced, and the amount of funds available. The Repowering Assistance program, authorized under the Food, Conservation, and Energy Act of 2008, provides payments to biorefineries to replace fossil fuels with renewable biomass as a means to produce heat and power. To be eligible, the biorefineries must be located in a rural area and must have been in existence as of June 18, 2008. Payments are available for periods of up to 3 years. Issuers of clean renewable energy bonds can choose to receive a direct payment from the federal government in lieu of the tax credit for bondholders.
One Response to Federal government subsidies, tax breaks, costs of renewable and fossil energy production GAO 2014