

Preface. This is a summary of a United Nations report that ought to scare the pants off of anyone who understands exponential growth. Here are a few examples what that means:
- If 2 grams of gold grew at a 5% compound rate for 2,000 years, it would grow to 800 trillion golden planet earths
- Donella Meadows, lead author of “Limits to Growth”, explored the concept of doubling. If you ate double the number of peanuts every day for a month, you’d be eating 500 tons the last day.
- Until the 1970s, oil consumption doubled every 10 years at a 7% growth rate per year. That means every 10 years, as much oil was used as all the oil previously consumed. At that rate, even if the earth was a giant gas tank, oil would run out in 342 years.
- The UN study states population grew at a 1.6% compound rate from 1970 to 2010. So if there were 15 million people 13,500 years ago, we’d have over a google of people now at a 1.6% compound rate. A google has 100 zeros.
In order to accommodate an additional 2 billion people in 2050, material consumption will need to nearly triple to 180 billion tonnes of materials, almost three times today’s amount. If 180 billion tonnes grows in the future at 5% compound rate, in 497 years the entire earth will be consumed, all 5.972 x 10²¹ tonnes of it, and we’ll be floating in outer space.
Newsflash: we’re up to 100.6 billion tonnes (BT) of consumption in 2019, with 50.8 BT of that minerals, 10.1 BT ores, 15.1 BT fossil fuels, 24.6 BT crops and trees (Carrington 2020).
I’m amazed we haven’t run out of stuff already. Between 1970 and 2010, the global economy expanded more than 3-fold, population almost doubled from 3.7 to 6.9 billion, and global material extraction went from 22 billion to 70.1 billion tonnes. In 2010, 30 billion tonnes of materials extracted globally were required to produce 10 billion tonnes of directly traded goods. Half of the tons of traded material was oil. Compound growth rates of extraction were: Biomass 2%, fossil fuels 1.9%, metal ores 2.8%, and non-metallic minerals 4% per year. From 2000 to 2010 all materials except biomass accelerated their extraction growth rate: fossil fuels grew by 2.9%/year on average, metal ores 3.5%, and non-metallic minerals by 5.3%.
Those who deny limits to growth say we’ll miniaturize, use less material, and get more efficient. This UN report states that in fact, the opposite is happening. Global material efficiency started to decline around 2000, so now the global economy needs more materials per unit of GDP than it did at the turn of the century. What may seem counter-intuitive has been caused by a large shift of economic activity from very material-efficient economies such as Japan, the Republic of Korea and Europe to the much less material-efficient economies of China, India and Southeast Asia.
We are growing less sustainable because there is a growing environmental pressure per unit of economic activity that works against the hypothesis of decoupling – achieving more with less – which is so important to the success of global sustainability.
Other organizations besides the UN recognized that we’re in trouble. Earth overshoot day which is the date when humanity’s demand on nature for the year exceeds what Earth can regenerate annually. Global Footprint Network estimated that humans would need the resources produced by just over one-and-half Earths to keep up with what we will use this year. “We spend 1.62 times what Earth can renew,” said Wackernagel. “Like with money, you can dip into your inheritance or your savings for a time, but only a certain amount of time.”
Increasing material extraction increases the damage and pollution of our ecosystems:
- The global economy, at today’s level of resource use, is already surpassing some planetary boundaries. Rising material use will result in climate change, higher levels of acidification and eutrophication of soils and water bodies, increased biodiversity loss, more soil erosion, increasing amounts of waste and air pollution, negative impacts on human health and quality of life, and ultimately lead to the depletion of certain natural resources causing supply shortages for critical materials in the short and medium terms.
- Our world is built from materials. The food we eat, the buildings that house us, the vehicles in which we travel and the consumer goods that furnish our life, are all made of, embody and require for their operation massive quantities of biomass, fossil fuels, metals and non-metallic minerals. Our dependence on materials links us directly to the natural world from which primary materials are extracted, and to which they all ultimately return as waste and emissions.
- Impacts associated with increasing agricultural outputs include large-scale land degradation via erosion, salinization and acidification which can accompany the extension of cropping into marginal lands or the intensification of inputs on existing arable land. Large-scale change in land use and forest cover accompanies the extension of agriculture, timber production and in some cases mining and energy extraction.
- Further problems include the destruction of biodiversity and the eutrophication of waterways. Increasing outputs of forestry products can increase deforestation, with attendant damage to surface and groundwater systems, erosion and changed flooding regimes.
- Problems associated with mining and quarrying include loss of land to competing land uses, pollution of land and waterways from acid mine leaching, heavy metals liberated from mine tailings, and some chemicals used in mining and refining processes. Secondary and tertiary production processes, and disposal after final consumption, add to waste and emissions downstream. Ultimately, everything that is extracted must be sunk back into the environment
This UN report states that their study demonstrates the close relationship between economic trends and natural resource use.
Well of course they are related! But our economic system doesn’t take natural resources into account. Mow down a forest for timber and GDP increases. Build a $200 million dollar water treatment plant to replace the free water purification services the forest provided, and GDP grows. Completely out of forests? Don’t worry, human ingenuity will solve the problem, or we’ll find a substitute. How such insanity came to be is wonderfully explained in Hall and Kilitgaard’s “Energy and the Wealth of Nations”.
The UN doesn’t flat out state there are limits to growth, though they come close when they point out there’s not enough stuff in the world to raise the standard of living for everyone and we appear to be on an unsustainable trajectory (page 5). But to flat out say there are limits to growth would be seen as an attack on capitalism and right-wingers would probably accuse the UN of socialism or worse and demand America stop funding them. Limits to growth means a shrinking piece of pie for everyone. Capitalism can only justify the huge disparities in wealth distribution with the constant propaganda that we all have the potential to become billionaires (especially if the government stops regulating businesses and taxing the rich).
Capitalism is lauded as the best political and economic system, but in reality it’s just the most successful at extracting energy and natural resources the most quickly to enrich mainly the top 0.1% of the population, future generations be damned. Oh well, Mother Nature can always be counted on to reveal how false the whole idea of capitalism was.
The Big Plan to cope with energy decline and climate change is to create renewables to replace fossil fuels. But wait, they’re made of tons and tons of metals and minerals. So they’ll make the world far worse; extractive industries, such as mining, create half the worlds carbon emissions and over 80% of biodiversity loss. To scale up wind and solar would require drastically ramping up mining to build more wind turbines and solar panels, which have to be thrown into landfills (recycling is almost non-existent) and built again every 20 years (turbines) or 18-25 years (solar panels) since both have such short life spans (Watts 2019).
A picture says a thousand words, look at this 2021 visual capitalist chart of the materials we use, “Visualizing the Accumulation of Human-Made Mass on Earth“.
Alice Friedemann www.energyskeptic.com Author of Life After Fossil Fuels: A Reality Check on Alternative Energy; When Trucks Stop Running: Energy and the Future of Transportation”, Barriers to Making Algal Biofuels, & “Crunch! Whole Grain Artisan Chips and Crackers”. Women in ecology Podcasts: WGBH, Jore, Planet: Critical, Crazy Town, Collapse Chronicles, Derrick Jensen, Practical Prepping, Kunstler 253 &278, Peak Prosperity, Index of best energyskeptic posts
***
UNEP. 2016. Global material flows and resources productivity. United Nations Environment Programme International resource panel. 200 pages.
Excerpts (out of order, shortened and paraphrased at times):
Natural resources provide the foundation of our lives on Earth. Water, soil, energy, minerals and metals underpin our standards of living. They feed and shelter us, and provide for our material needs throughout our lives. Pressures on these natural resources are mounting. A growing population and heightened world economic demand in the past half century are rapidly depleting these vital resources, inflicting great harm on the natural environment and human health.
This study demonstrates the close relationship between economic trends and natural resource use. Global material use slowed in 2008 and 2009 due to the global financial crisis, with trade flows contracting in 2009, but is again on a growth trajectory. Sustained reductions in material use depend on changes in the structural asset base of an economy. This means that there is considerable inertia built into the global system of material use, which makes it difficult to reduce material use rapidly and on a sustained basis.
In this report, the use of materials – society’s metabolism – is interpreted as an environmental pressure. The larger the material use the bigger the pressure. Material use is also closely related to other pressure indicators including waste flows, energy use and carbon emissions, land use and water use. When material use grows, other pressure indicators increase. Material use is also used as a proxy for environmental impacts that will occur across the whole life cycle of material use from extraction, transformation and consumption to disposal. When material use increases, the environmental, social and economic impacts of material use also see a commensurate rise.
Material use is a good proxy for overall environmental pressure and also reflects environmental impacts, so decreasing material efficiency is not favorable with regard to environmental sustainability. It means that the speed at which we are exploiting natural resources, and generating emissions and waste, is increasing faster than the economic benefits gained. This disproportionately accelerates environmental impacts such as climate change, resource depletion and reduced ecosystem health.
Fast-expanding demand for materials will, however, require very large investments into new extraction and supply infrastructure and will contribute to local conflict over alternative uses of land, water, energy and materials. Such conflict is already pronounced in the energy sector where mining competes with agriculture and urban development in many places.
The primary sectors of the economy (agriculture, forestry, fishing, mining and quarrying) extract materials from the natural resource base and turn them into the basic commodities required for various major economic activities. Access to abundant and affordable materials is critical for the economic success of a national economy and fundamental to the ongoing well-being of its citizens. During the 20th century, the economic development that improved material standards of living for hundreds of millions of people was assisted by declining real prices for most materials, including food, fuel and metals.
There are major limitations on the availability of arable land for crops. Increasing inputs such as fertilizers and pesticides can increase productivity on available land, but often with rapidly diminishing returns and the associated costs of land degradation. If this approach is pushed too far, a situation can develop where arable land becomes a depleting stock which is effectively being “mined”. Furthermore, total land area remains constant, so expanding agriculture into existing forest areas will decrease land available for forestry, and vice versa. It is possible (indeed commonplace) to bring land from previously low productivity areas, e.g. deserts, into biomass production by transferring water from remote river systems, or pumping from aquifers, however this is usually limited by the expense of developing the infrastructure required, the adverse effects it has on source river systems, and/or by the rate at which the rivers or aquifers can provide. Many aquifers are in effect non-renewable resources on human timescales, with recharge periods of thousands of years or more.
This situation may not be sustained through the 21st century as the rapid economic growth occurring simultaneously in many parts of the world will place much higher demands on supply infrastructure and the environment’s ability to continue supplying materials.
[ My comment: For example, the world’s copper resources are about 1.6 Gt. To provide all 10 billion people in the future with the average per capita mean (170 kg) would require 1.7 Gt, more than the estimated resource in the crust (Gordon 2006). ]
Consumption
The annual per capita material footprint for the Asia-Pacific, Latin America and the Caribbean, and West Asia is between 9 and 10 tonnes, Africa 3 tonnes. The richest countries consume on average 10 times as many materials as the poorest countries, and twice the world average, with Europe at 20 tonnes per capita, and North America 25 tonnes. Both regions have experienced a decline in material footprint since 2008 caused by the economic downturn during the global financial crisis (GFC). Before the GFC, North America had a per capita material footprint of well above 30 tonnes and Europe of well above 20 tonnes and both regions were on an upward trajectory. It remains to be seen whether the economic recovery in North America and Europe has put material footprint on a growth trajectory again. This would suggest that there is no level of income yet at which material use has stabilized.
The world economy has experienced a great acceleration in material use since 2000, strongly related to the industrial and urban transformation in China, which has required unprecedented amounts of iron and steel, cement, energy and construction materials. China’s growth in material demand since the year 2000 has reverberated across the world economy, especially in primary resource exporting regions and countries such as Latin America, Africa and Australia.
The group of countries of high human development have experienced the fastest growth in material footprint and are now, on average, at 12.5 tonnes per capita, up from 5 tonnes per capita in 1990. China, for instance, had a material footprint of 14 tonnes per capita in 2010 on a strong upward trajectory and Brazil had a material footprint of 13 tonnes per capita in 2010 and has also grown strongly in recent years.
The average material footprint of countries with medium levels of human development has grown slowly over the past two decades, reaching 5 tonnes per capita, while material footprint in low HDI countries has been stagnant for the past two decades at 2.5 tonnes per capita. The richest countries consume on average 10 times as many materials as the poorest countries, and twice the world average, which demonstrates very unequal distribution of materials to support the standard of living. It shows that the low income group of countries will require increasing quantities of materials, per capita, to achieve the sustainable development outcomes the global community aims for.
Extraction
Domestic extraction of materials has grown in all world regions to meet increased demand for materials. These two regions have required large and increasing amounts of imports of materials, especially fossil fuels and metal ores, from all other regions. As a result, trade in materials has expanded 4-fold since 1970. In 2010, more than 10 billion tonnes of materials were exported globally.
Over the four decades an increasing specialization of countries with regard to natural resource extraction for trade has emerged, especially for fossil fuels and metal ores but to some extent also for agricultural products. This is especially visible at the country level where countries such as Australia, Brazil, Chile, Indonesia and Kazakhstan have increased their net exports of materials over time while other countries such as South Korea and the United States (until 2005) increased their net imports of materials, or depended (such as Germany, France and Japan) on a high level of net imports over the four decades. China, India and Pakistan show an interesting pattern of fast increasing import dependency for the direct trade of materials which coincides with the status of a net exporter when adjusting trade flows for upstream and downstream indirect material flows associated with trade, i.e. looking at the raw material equivalents of trade.
For this assessment study, we reviewed the existing global databases and compared their methodological underpinnings and results in an effort to create one unified data set that can become the standard authoritative source for data on global and country by country material use. In doing so, we were able to establish a multi-country, global data set for year by year material extraction for the four decades from 1970 to 2010 including information for all countries of the world as far as possible. The materials extraction data set reports 44 different material categories.
By relating global supply chains to final demand for resources, the material footprint indicator (amount of material consumed in a nation or region) is a good proxy for the average material standard of living in a country. It indicates that the level of development and well-being in wealthy industrial countries has been achieved largely through highly resource-intensive patterns of consumption and production, which are not sustainable and can’t be matched in other parts of the world.
The growing complexity of international supply chains, driven by globalization of the world economy, has paired with a trend whereby high-income countries tend to outsource many materials-, energy- and emissions-intensive industrial processes to other parts of the world. The high-income country can then effectively import the primary commodities it needs either in a greatly concentrated form, or indirectly “embodied” in a relatively small quantity of imports. The conventional measures used in material flows accounting are largely blind to such extraterritorial inputs to a nation’s final demand. This created a need for a new indicator that captures the full material requirements of a country’s final demand (household and government consumption, and capital investment), which includes extraterritorial inputs of materials for local consumption.
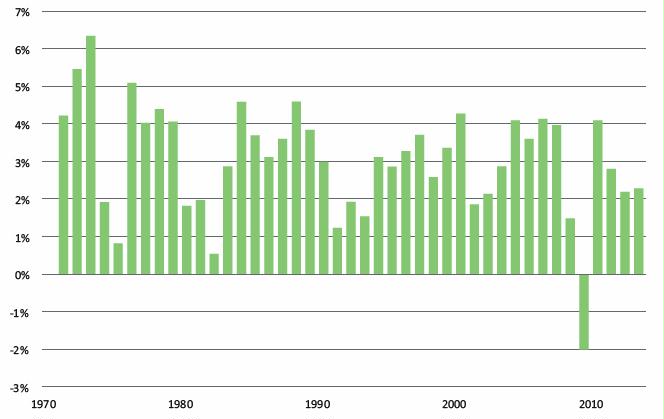
Figure 1. Yearly global economic growth rates, 1970–2013
The material intensities of the different sectors shown in Figure 2…[show that] services are not really substituting for materials- and energy-intensive processes at all [Other Activities].
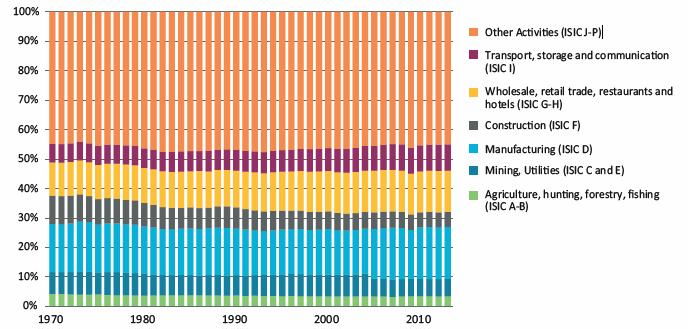
Figure 2. World GDP sector added value shares
The economic success story of the twentieth century of Europe, the United States and Japan post-WWII was enabled by stable or decreasing world market prices for most natural resources. Since 2000, the price of many natural resources has started to grow.
Chapter 2 Global trends in resource extraction
Figure 7 shows the increase in global material use by four main material categories. All four material groups have grown over the past four decades. Biomass extraction grew by 2%, fossil fuels by 1.9%, metal ores by 2.8% and non-metallic minerals by 4% per year on average.
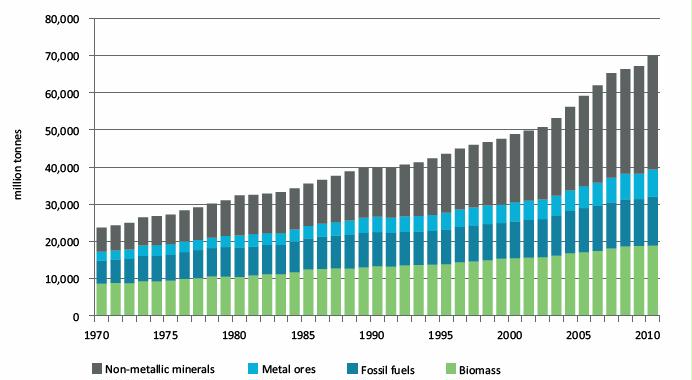
Figure 7. Global material extraction (DE) by four material categories, 1970–2010, million tonnes
[ My comment: Table 2 shows how much stuff and time it will take to use reserves up. It’s based on the Reserve to Production ratio, which is complete nonsense [see R/P ratio is completely useless]. If scientists are correct about the average decline rate of oil fields reaching 9% or more by 2030, we will need to replace half to two-thirds of our current oil, hard to do with far away, nasty, difficult, expensive tar sands and deep sea oil. Only cheap plentiful oil matters, since even the lowest grade ores could be processed, and when they ran out, minerals and elements could be extracted from dirt or seawater. ]
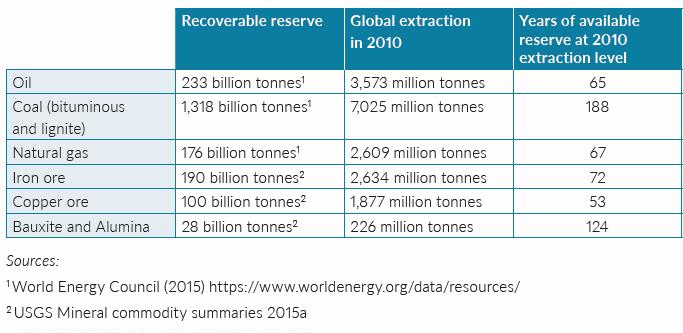
Table 2. Recoverable reserves of key commodities.
Since global material use has grown faster than population, we see in Figure 8 that per capita use has increased quite significantly, especially since 2000. It took 30 years for per capita material use to grow from 6.4 tonnes in 1970 to 7.9 tonnes in 2000 but only another 10 years to reach 10.1 tonnes per capita in 2010. By that time, the average use of materials per person included 2.7 tonnes of biomass (mostly related to food supply systems and including timber as a structural material and for heating), 1.9 tonnes of fossil fuels (mostly for power and transport), 1.1 tonnes of metal ores for construction, manufacturing applications and communications) and 4.4 tonnes of nonmetallic minerals (for buildings and transport infrastructure in fast-growing cities).
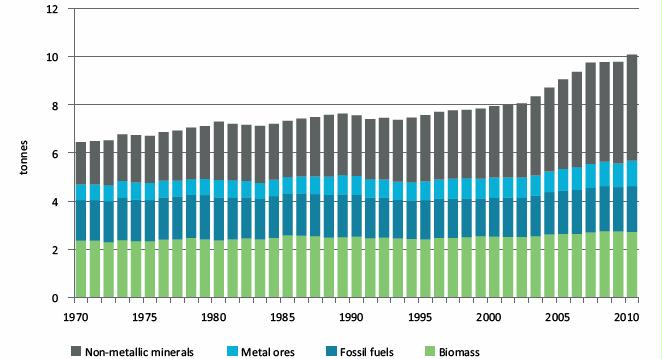
Figure 8. Per capita global material extraction (DE) by four material categories, 1970–2010, tonnes
Trade in metal ores grew by 4.7% annually on average over the past four decades but accelerated to 7% annual growth between 2000 and 2010. In 1970, 370 million tonnes of mostly concentrated metals were traded. In 2010, metals traded totalled 2.4 billion tonnes, comprising 22% of all traded materials. Trade in biomass has also grown dramatically from 370 million tonnes in 2010 to 1.9 billion tonnes in 2010. Biomass trade grew at an average of 4.2% over the past four decades and has somewhat declined since 2000 to 3.2% yearly average growth.
Trade in fossil fuels, which comprises the largest share in materials traded at slightly more than 50% of all traded materials, remained at a constant 2.8% yearly increase over the past 40 years and did not change between 2000 and 2010.
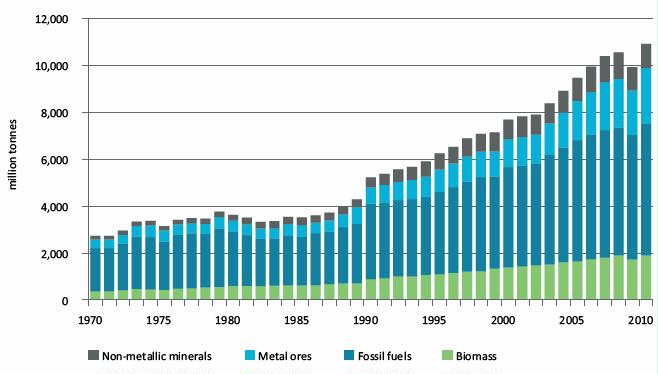
Figure 9. Global exports of materials by four material categories, 1970–2010, million tonnes
In 1970, 1.8 million tonnes of oil, coal and gas were traded among countries, accounting for two thirds of all traded materials. The amount of traded fossil fuels had grown to 5.6 billion tonnes by 2010.
The rapid increase in per capita global material use (the metabolic rate of the global economy) from 7.9 tonnes to 10.1 tonnes per capita in just 10 years since 2000 and the fact that materials use grew faster than GDP over that decade has meant that global material efficiency, for the first time in a century (Krausmann et al. 2009), has started to decline. Since 2000, we have observed growing material intensity (MI) in the global economy. In 2000, 1.2 kg of materials were required to produce one US$ of GDP; this had risen to almost 1.4 kg per US$ by 2010.
The main reason for the increase in material intensity at the global level is a shift of global production away from very material-efficient economies – Europe, the United States, Japan and South Korea – to the less efficient economies of China, India, Brazil and South Africa among others.
Sugar crops showed the strongest total growth for any of the major “pure” categories (137%), and this is consistent with the increasing importance of processed foods as developing countries urbanize.
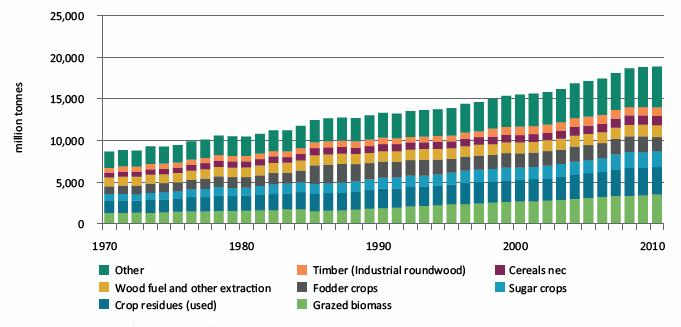
Figure 14. Global extraction (DE) of biomass by material subcategories, 1970–2010, million tonnes
Figure 15 haseight categories, showing that total domestic extraction for each of the categories grew by over 100% between 1970 and 2010. By far the largest growth in total tonnage terms was for other bituminous coal, which increased by nearly 2.9 billion tonnes, almost twice the 1.5 billion tonne increase for natural gas, which had the second largest increase in total tonnage terms. These two categories grew at roughly comparable rates (2.6% p.a. and 2.8% p.a. compounding, respectively), with the rate of growth in other bituminous coal accelerating over the 1990 to 2010 period, while the fastest growth for natural gas was from 1970 to 1990. All coal categories together accounted for over 58% of the 7 billion tonne increase in fossil fuel tonnage between 1970 and 2010, increasing coal’s share of total fossil fuels from 48% to 53%, while natural gas increased from 12% to 17%.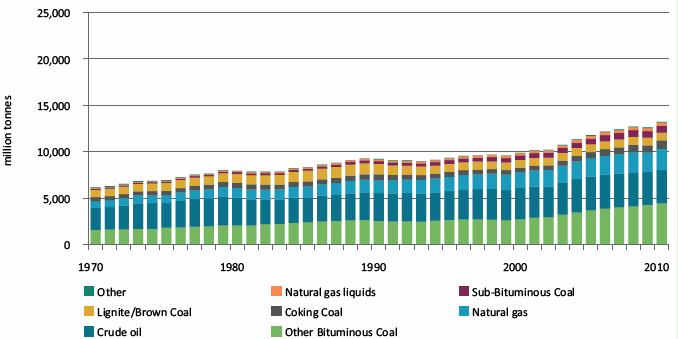
Figure 15. Global extraction of fossil fuels by material subcategories, 1970–2010, million tonnes
The growth rate for iron ore, which had been less than 1.2% p.a. compounding between 1970 and 2000, grew at over 9.1% p.a. between 2000 and 2010.
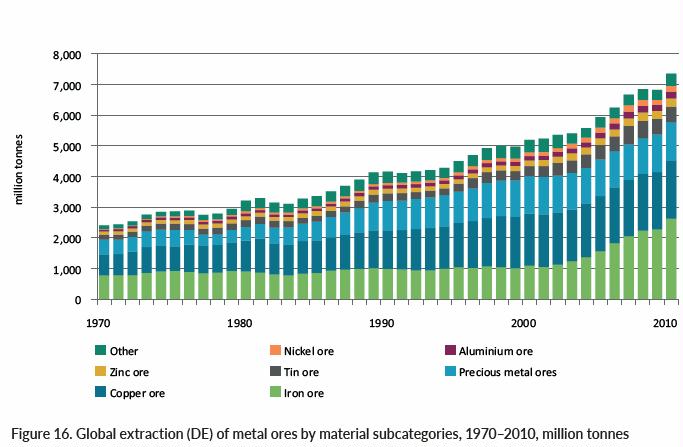
Figure 16. Global extraction of metal ores by material subcategories, 1970–2010, million tonnes
The data on Domestic Extraction (DE) of non-metallic minerals in Figure 17 are disaggregated into five categories and show clearly the domination of this category by construction minerals (common rock), in total tonnage terms. At 29.5 billion tonnes in 2010, the subcategory of construction minerals was larger than any of the other complete materials categories (biomass, fossil fuels and metal ores). Not only was it one to two orders of magnitude larger than any of the other non-metallic minerals categories, it also grew at the fastest rate, 4.1% a year compounding from 1970 to 2010, compared to 2.6% a year for other mining and quarrying products n.e.c, the next fastest growing.
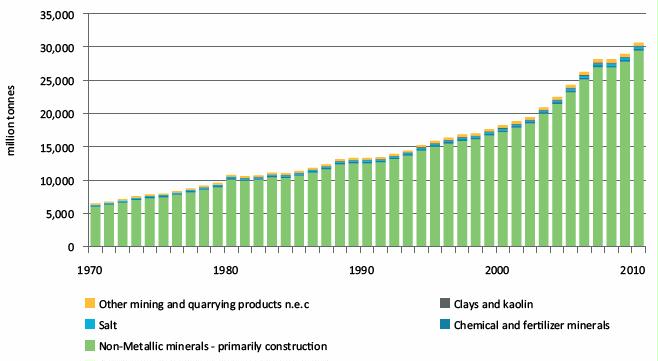
Figure 17. Global domestic extraction (DE) of non-metallic minerals by material subcategories, 1970–2010, million tonnes.
At the local scale, however, supplies can be severely limited, or their extraction can cause unacceptable environmental damage. An example of the former situation is where settlements are on major alluvial flats or deltas with little or no rock exposed at the surface. In such cases, the rock-based aggregates crucial for concrete and road base may need to be replaced by firing alluvium to create bricks, which may then be crushed for use as aggregate. This practice is expensive, and the requirement for fossil or biomass fuel will typically be more environmentally damaging than the extraction of alluvium of itself.
Chapter 3 Regional trends in material use
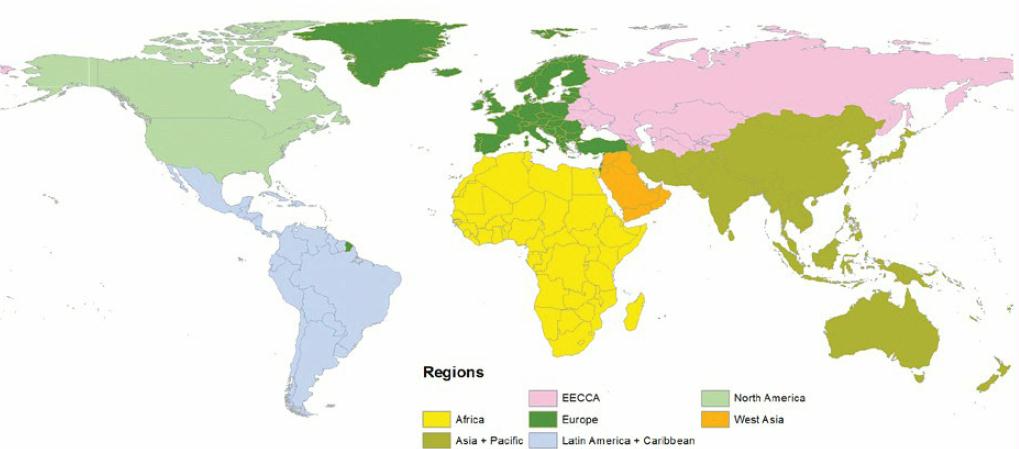
Figure 18. Regional classification used in this report.
While global material extraction tripled between 1970 and 2010 this growth was overwhelmingly driven by increasing domestic extraction in the Asia-Pacific region, which increased more than fivefold in just 40 years, at a compounding annual rate of nearly 4.8%. The average rate of growth actually increased in the latter half of the period (from 1990 to 2010) showing the acceleration of material extraction and demand from Asia and the Pacific. The Asia-Pacific region’s share of global DE consequently more than doubled over the past four decades, from less than a quarter of the global total to more than half.
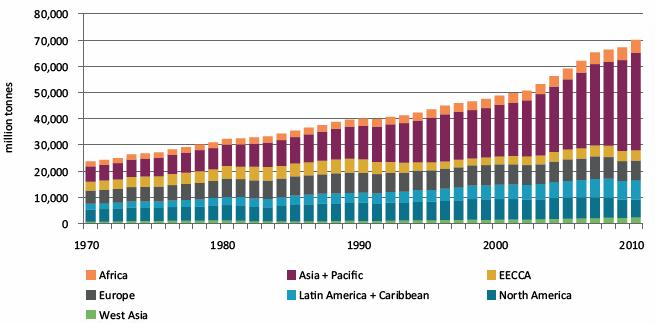
Figure 19. Domestic extraction (DE) by seven subregions, 1970–2010, million tonnes
The share of global material extraction grew from 24.3 to 52.9% in Asia and Pacific, 9.4% to 10.7% in Latin America and Caribbean. It shrunk everywhere else (nation 1970 %/2010 %). Africa / 7.9 / 7, Europe 20.9 / 10.5, North America 19.6 / 9.7, and Eastern Europe 14.7/ 5.8.
While relative shares contracted for many regions, total domestic extraction of materials still grew in all cases, with EECCA being the only region which saw growth of less than 40% in Domestic Extraction (DE) over the period (the EECCA increase was 16%). Latin America, West Asia and Africa all saw growth in total DE of greater than 100%, at compounding annual growth rates of 3.1%, 2.9% and 2.5% respectively.
Figure 20 shows a much more mixed situation with regard to per capita DE, with three of the seven regions (Africa, North America and West Asia) showing at least marginal decreases between 1970 and 2010. The declines in per capita DE for Africa and West Asia are of particular interest in that they show that despite the rapidly growing total DE for these regions displayed in Figure 19, their populations are growing even faster, effectively reducing the already low per capita domestic resource availability in Africa and West Asia.
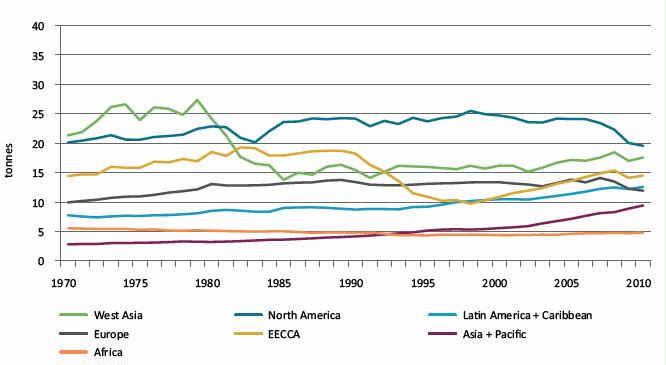
Figure 20. Per capita domestic extraction (DE) by seven world regions, 1970–2010,
Detail of the composition of the materials used by a society is important and can yield information on where a society is situated in the transition from an agrarian to an industrial society, and on the speed with which that transition is taking place. One important piece of information in this context is biomass inputs relative to mineral inputs. A high biomass share is indicative of a more agrarian economy, with mineral materials (encompassing fossil fuels, metal ores, and non-metallic minerals) increasing their shares as a society increasingly adopts the mineral-based energy and materials systems typical of industrial society
Figure 21 shows a very wide range in the proportion of domestic extraction (DE) of biomass between the different regions, and some markedly different trajectories. The AsiaPacific region stands out as the region which has most radically shifted away from biomass, which had a share of 53% of all materials in 1970, decreasing to just 22% by 2010. While the Asia-Pacific region’s per capita extractions of fossil fuels grew twofold and metal ores grew more than threefold, it was growth in non-metallic minerals (dominated by construction aggregates) which contributed by far the greatest share, increasing by over six-fold, a compounding growth rate of 5.1% per year over the past four decades, and of 6.5% per year over the most recent two decades.
Latin America saw growth in DE per capita of all categories of materials over the period, with least growth in fossil fuels (20%) and greatest in metal ores (139%). It saw a significant decline in the share of biomass from 52% to 43%. However, this is still high by global standards, exceeded only by Africa, where biomass accounted for 46% of materials extraction in 2010;
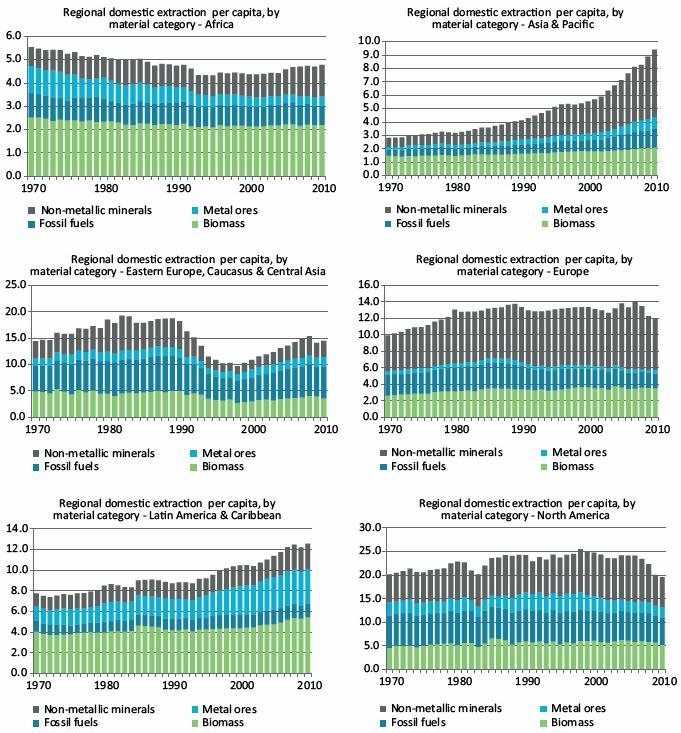
Figure 21. Per capita domestic extraction (DE) in 7 world regions, 1970–2010, tonnes per capita
The Asia-Pacific region has shown by far the most rapid and consistent growth in its requirement for imports, which increased more than fourfold between 1970 and 2010 at a compounding rate of 4.4% per year, and 6.5% per year over the latter two decades. In contrast, Europe’s total net imports only increased by 50% over the full period. The high ongoing dependence of Europe on net physical imports indicates how it has been able to maintain high material living standards while having levels of Domestic extraction of some key material categories at or below the levels of less wealthy regions.
West Asia maintained major net exporter status over the full period, but its relative importance declined as it moved from being the World’s largest net exporter in 1970 to second largest by 2010, with total net exports increasing by 35% in total. Latin America shows relatively consistent growth in its net exports over time, which increased by a total of 164%, a compounding rate of 2.5% p.a.
It must be noted, however, that primary materials are often traded in much more concentrated form than they are extracted, and so traded primary products are frequently of much greater value to an economy than an equivalent tonnage of DE. This phenomenon is particularly pronounced for metal ores, but is also significant for biomass (Schandl and West 2012).
North America also figures as a much more significant importer of raw materials relative to Europe.
In Figure 26 we return to the Physical Trade Balance (PTB) metric, in this case giving more detailed disaggregation by the four main material categories, on a per capita basis. A first insight from an overview of Figure 26 is the dominance of fossil fuels in net physical trade terms. Regions tend to start out and remain major net importers or major net exporters for the full time period. In all cases except Latin America, fossil fuels are clearly the major net import/export item in volume terms. For Latin America, net exports of metal ores are frequently larger than fossil fuels. Europe and North America have consistently been major net importers of fossil fuels, although the trajectory for North America is notably more volatile, probably reflecting that region’s greater ability to satisfy domestic demand from Regional physical trade balance per capita.
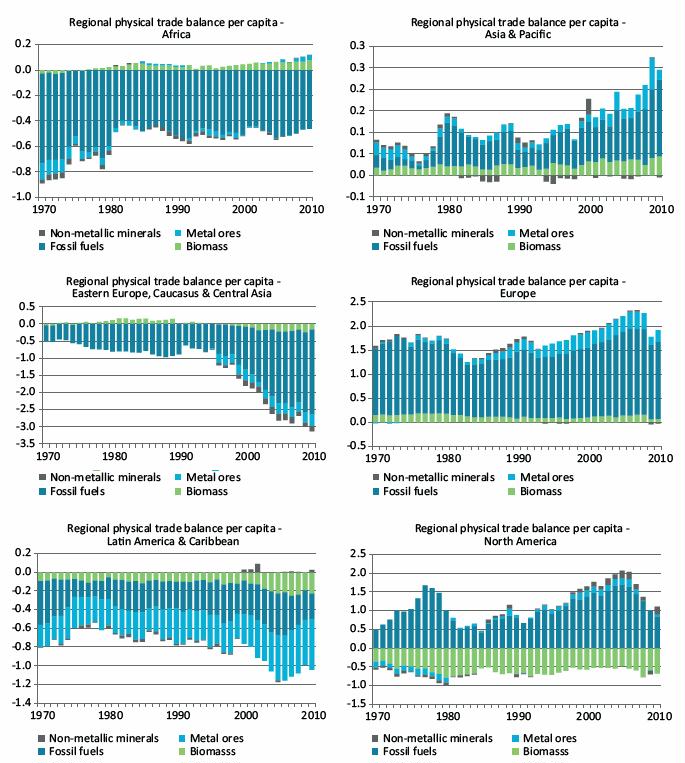
Figure 26. Per capita physical trade balance (PTB) for 7 world regions, 1970–2010, tonnes
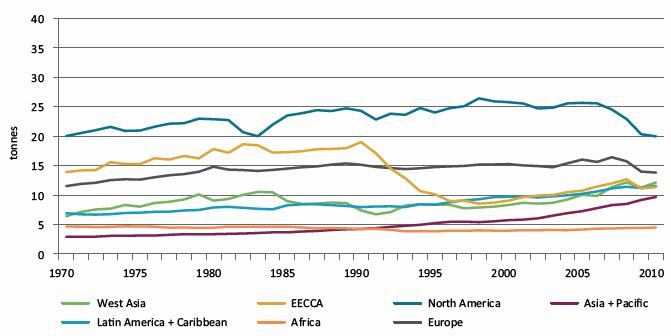
Figure 29. Per capita domestic material consumption (DMC) by seven subregions, 1970–2010, tonnes
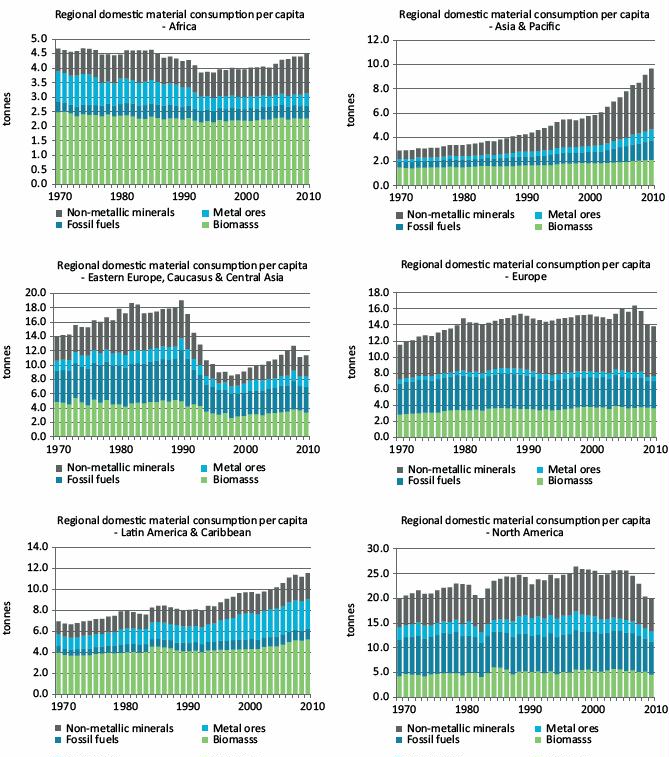
Figure 30. Per capita domestic material consumption (DMC) by region, 1970–2010, million tonnes
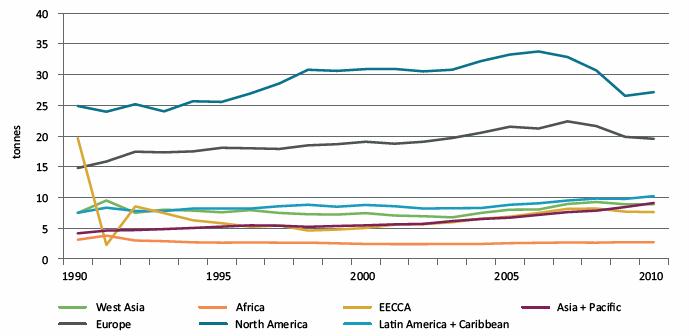
Figure 33. Per capita material footprint of consumption (MF) by seven world regions, 1990–2010, tonnes. Before the global financial crash, North Americans were consuming 34 tonnes per person.
Figure 82 shows the global extraction of non-metallic minerals from the study of Miatto et al. (in review), starting at around 10 billion tonnes in 1970 and reaching about 35 billion tonnes in 2010, a 3.5-fold growth and a yearly average growth rate of 3.4%.
Sand and gravel constituted the main share of global non-metallic minerals extraction in 2010 (40.8% gravel and 31.1% sand). Limestone, for cement production, had the fastest average annual growth rate of 4.5%, gravel extraction grew by 3.7% per year, and clay extraction grew by 3% per year.
Non-metallic minerals for roads and bricks are of a similar magnitude and show a slower average growth rate compared to non-metallic minerals for buildings. The average annual growth rate for roads was 0.8%, compared to 2.8% for bricks. The amount of non-metallic minerals required for rail tracks is negligible.
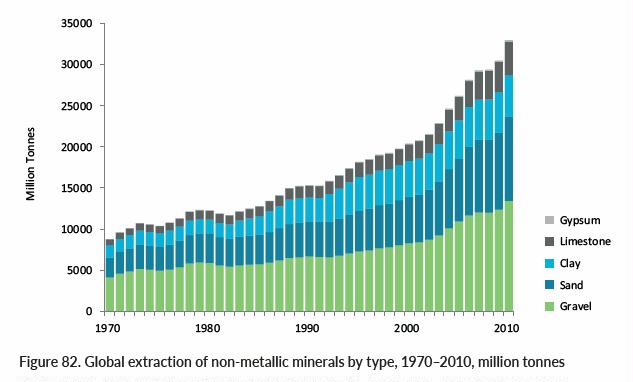
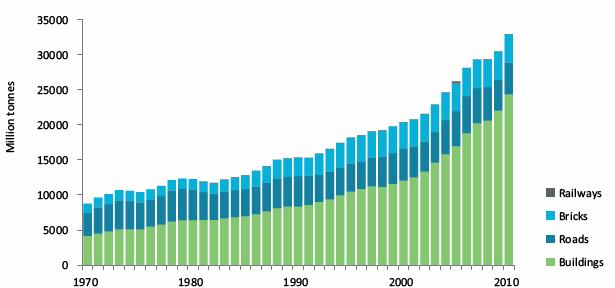
Figure 83. Global extraction of non-metallic minerals by sector of use, 1970–2010, million tonnes. Buildings include the actual buildings, and other infrastructure such as dams, water tanks, bridge pillars, and so on.
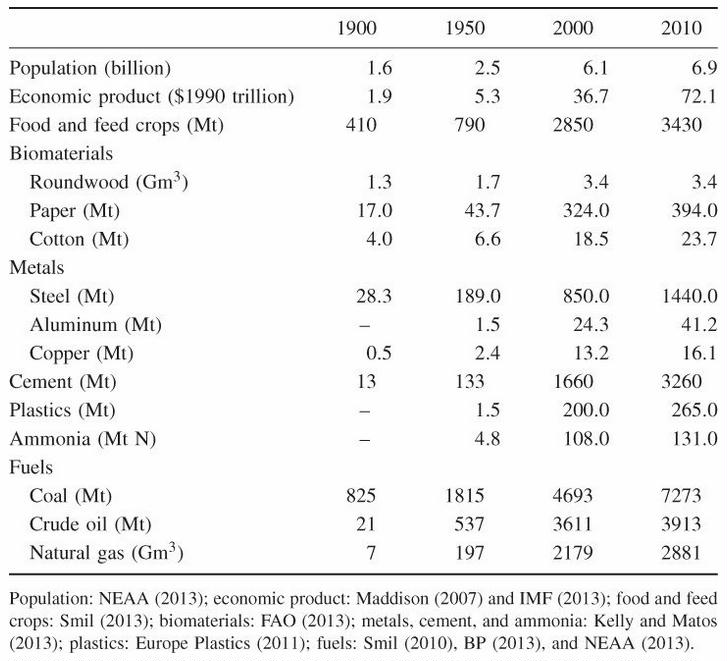
Source: Vaclav Smil. 2013. Making the Modern World: Materials and Dematerialization. Wiley.
References
Ayres, R. U. & U. E. Simonis. (1994) Industrial metabolism. Restructuring for sustainable development. Tokyo and New York: United Nations University Press.
BGS. (2015) World Mineral Statistics. London: BGS – British Geological Survey.
BGS. (2013) World Mineral Statistics. London: BGS – British Geological Survey.
Bringezu, S. (2015) Possible Target Corridor for Sustainable Use of Global Material Resources. Resources, 4, 25–54. Cordell, D., J. O. Drangert & S. White (2009) The story of phosphorus: Global food security and food for thought. Global Environmental Change- Human and Policy Dimensions, 19, 292–305.
Carrington, D. 2020. World’s consumption of materials hits record 100bn tonnes a year. Unsustainable use of resources is wrecking the planet but recycling is falling, report finds. The Guardian.
EIA. (2015) International Energy Statistics. Washington: US Energy Information Administration.
Eurostat. (2001) Economy-wide material flow accounts and derived indicators. A methodological guide. Statistical Office of the European Union, Luxembourg.
Eurostat. (2007) Economy-wide Material Flow Accounting – A compilation guide. By Weisz, H., Krausmann, F., Eisenmenger, N., Schütz, H., Haas, W. and A. Schaffartzik. Eurostat, Luxembourg. Eurostat. (2009) Economy-Wide Material Flow Accounts: Compilation Guidelines for reporting to the 2009 Eurostat questionnaire – v01.
Eurostat. (2012) Economy-wide Material Flow Accounts (EW-MFA). Compilation Guide 2012. Statistical Office of the European Communities, Luxembourg.
Eurostat. (2013) Economy-wide Material Flow Accounts (EW-MFA). Compilation guide 2013. Statistical Office of the European Communities, Luxembourg.
FAO. (2014a) Fishstat database. Food and Agriculture Organization of the United Nations. FAO. (2014b) Subscribers section – Bulk downloads – Food balance sheets. Food and Agriculture Organization of the United Nations.
FAO. (2014c) Subscribers section – Bulk downloads – Forestry. Food and Agriculture Organization of the United Nations.
FAO. (2014d) Subscribers section – Bulk downloads – Production. Food and Agriculture Organization of the United Nations. Fischer-Kowalski, M. & H. Haberl. (2007) Socioecological transitions and global change. Trajectories of social metabolism and land use. Cheltenham, UK: Edward Elgar.
Fischer-Kowalski, M. (1997) Society’s metabolism: on the childhood and adolescence of a rising conceptual star. In The international handbook of environmental sociology, eds. M. Redclift & G. Woodgate. Cheltenham:
Edward Elgar. Fischer-Kowalski, M., F. Krausmann, S. Giljum, S. Lutter, A. Mayer, S. Bringezu, Y. Moriguchi, H. Schütz, H. Schandl & H. Weisz. (2011) Methodology and Indicators of Economy-wide Material Flow Accounting. Journal of Industrial Ecology, 15, 855–876.
Fishman, T., H. Schandl, H. Tanikawa, P. Walker & F. Krausmann (2014) Accounting for the Material Stock of Nations. Journal of Industrial Ecology, 18, 407–420.
Foley, J. A., R. DeFries, G. P. Asner, C. Barford, G. Bonan, S. R. Carpenter, F. S. Chapin, M. T. Coe, G. C. Daily, H. K. Gibbs, J. H. Helkowski, T. Holloway, E. A. Howard, C. J. Kucharik, C. Monfreda, J. A. Patz, I. C. Prentice, N. Ramankutty & P. K. Snyder (2005) Global consequences of land use. Science, 309, 570–574.
Geschke, A., R. Wood, K. Kanemoto, M. Lenzen & D. Moran (2014) Investigating alternative approaches to harmonise multiregional input-output data. Economic Systems Research, 26, 354.385.
Giljum, S., M. Bruckner & A. Martinez (2015) Material Footprint Assessment in a Global Input-Output Framework. Journal of Industrial Ecology, 19, 792.804.
Giljum, S., M. Dittrich, M. Lieber & S. Lutter (2014) Global patterns of material flows and their socio-economic and environmental implications: a MFA study on all countries world-wide from 1980 to 2009. Resources, 3, 319.339.
Gordon, R.B., et al. 2006. Metals stocks and sustainability. Proceedings of the National Academy of Sciences (USA) 103:12-9-1214
Haas, W., F. Krausmann, D. Wiedenhofer & M. Heinz (2015) How Circular is the Global Economy?: An Assessment of Material Flows, Waste Production, and Recycling in the European Union and the World in 2005. Journal of Industrial Ecology.
Haberl, H., M. Fischer-Kowalski, F. Krausmann, H. Weisz & V. Winiwarter (2004) Progress towards sustainability? What the conceptual framework of material and energy flow accounting (MEFA) can offer. Land Use Policy, 21, 199.213.
Haberl, H., M. Fischer-Kowalski, F. Krausmann, J. Martinez-Alier & V. Winiwarter (2011) A Sociometabolic Transition towards Sustainability? Challenges for Another Great Transformation. Sustainable Development, 19, 1.14.
IEA. (2014a) World Energy Statistics . Documentation for Beyond 2020 Files. IEA. (2014b) World energy statistics, IEA World Energy Statistics and Balances (database).
IEA. (2013a) Energy statistics of non-OECD countries, 1960.2011. Online database. Paris: IEA.
IEA. (2013b) Energy statistics of OECD countries, 1960.2011. Online database. Paris: IEA.
IEA. (2014a) World Energy Statistics – Documentation for Beyond 2020 Files.
IEA. 2014b. World energy statistics, IEA World Energy Statistics and Balances (database).
Jölli, D., Giljum, S. (2005) Unused biomass extraction in agriculture, forestry and fishery. Sustainable Europe Research Institute, Vienna.
Krausmann, F., Gingrich, S., Eisenmenger, N., Erb, K.-H., Haberl, H., Fischer-Kowalski, M. (2009) Growth in global material use, GDP and population during the 20th century. Ecological Economics 68, 2696–2705.
Lamb, W. F., J. K. Steinberger, A. Bows- Larkin, G. P. Peters, J. T. Roberts & F. R. Wood (2014) Transitions in pathways of human development and carbon emissions. Environmental Research Letters, 9.
Lambin, E. F. & P. Meyfroidt (2011) Global land use change, economic globalization, and the looming land scarcity. Proceedings of the National Academy of Sciences of the United States of America, 108, 3465–3472.
Lenzen, M., D. Moran, K. Kanemoto & A. Geschke (2013) Building Eora: A global multi-region input-output database at high country and sector resolution. Economic Systems Research, 25, 20–49.
Lenzen, M., K. Kanemoto, D. Moran & A. Geschke (2012) Mapping the Structure of the World Economy. Environmental Science & Technology, 46, 8374–8381.
Lenzen, M., R. Wood & T. Wiedmann (2010) Uncertainty analysis for multiregion input-output models – A case study of the UK’s carbon footprint. Economic Systems Research, 22, 43–63.
Leontief, W. W. (1936) Quantitative input and output relations in the economic system of the United States. Review of Economics and Statistics, 18, 105–125.
McKinsey Global Institute. (2011) Resource revolution: meeting the world’s energy, materials, food and water needs. London.
Mudd, G. M. (2008) Sustainability of uranium mining and milling: toward quantifying resources and eco-efficiency. Environmental Science & Technology, 42, 2624–2630.
Narayanan, G., A. A. Badri & R. McDougall. (2012) Global Trade, Assistance, and Production: The GTAP 8 Database. Purdue University: Center for Global Trade Analysis.
OECD. (2004) Recommendation on material flows and resource productivity. OECD, Paris.
OECD. (2008) Measuring Material Flows and Resource Productivity. The OECD guide Environment Directorate. Organisation for Economic Co-operation and Development, Paris.
Peters, G. P. & E. G. Hertwich (2008) CO2 Embodied in International Trade with Implications for Global Climate Policy Environmental Science & Technology, 42, 1401–1407.
Peters, G. P., R. Andrew & J. Lennox (2011) Constructing an environmentally extended multi-regional input-output table using the GTAP database. Economic Systems Research, 23, 131–152.
Reichl, C., Schatz, M., Zsak, G. (2015) World Mining Data 2015, in: Federal Ministry for Economics and Labour, Austria (Ed.). Federal Ministry for Economics and Labour, Austria, Wr. Neustadt.
Schaffartzik, A., N. Eisenmenger, F. Krausmann & H. Weisz (2014) Consumption-based Material Flow Accounting. Austrian Trade and Consumption in Raw Material Equivalents 1995– 2007. Journal of Industrial Ecology, 18, 102–112.
Schandl, H. & J. West (2010) Resource use and resource efficiency in the Asia-Pacific region. Global Environmental Change-Human and Policy Dimensions, 20, 636–647.
Schandl, H. & J. West (2012) Material Flows and Material Productivity in China, Australia, and Japan. Journal of Industrial Ecology, 16, 352–364.
Schandl, H. & N. Eisenmenger (2006) Regional Patterns in Global Resource Extraction. Journal of Industrial Ecology, 10, 133–147.
Schoer, K., J. Weinzettel, J. Kovanda, J. r. Giegrich & C. Lauwigi (2012) Raw Material Consumption of the European Union–Concept, Calculation Method, and Results. Environmental Science & Technology, 46, 8903–8909.
SERI, WU-Vienna. (2014) Technical Report on the compilation of the material flow database for www.materialflows.net. Sustainable Europe Research Institute, Vienna University of Economics and Business, Vienna.
Steen-Olsen, K., J. Weinzettel, G. Cranston, A. E. Ercin & E. G. Hertwich (2012) Carbon, Land, and Water Footprint Accounts for the European Union: Consumption, Production, and Displacements through International Trade. Environmental Science & Technology, 46, 10883–10891.
Steinberger, J. K. & J. T. Roberts (2010) From constraint to sufficiency The decoupling of energy and carbon from human needs, 1975– 2005. Ecological Economics, 70, 425–433.
Steinberger, J. K., F. Krausmann & N. Eisenmenger (2010) Global patterns of material use: a socioeconomic and geophysical analysis. Ecological Economics, 69, 1148–1158.
Steinberger, J. K., F. Krausmann, M. Getzner, H. Schandl & J. West (2013) Development and Dematerialization: An International Study. PloS one, 8, e70385.
Takiguchi, H. & K. Takemoto (2008) Japanese 3R Policies Based on Material Flow Analysis. Journal of Industrial Ecology, 12, 792–798.
Tukker, A. & E. Dietzenbacher (2013) Global Multiregional Input-Output Frameworks: An Introduction and Outlook. Economic Systems Research, 25, 1–19.
UNEP. (2011a) Decoupling natural resource use and environmental impacts from economic growth. Nairobi: United Nations Environment Programme.
UNEP. (2011b) Resource efficiency: economics and outlook for Asia and the Pacific. Melbourne: CSIRO Publishing.
UNSD. (2015) Energy Statistics Database. United Nations Statistics Division.
USGS. (2015) International Minerals Statistics and Information. US Geological Survey, Washington, DC.
USGS. (2013) International Minerals Statistics and Information. Washington, DC: US Geological Survey.
Watts J (2019) Resource extraction responsible for half world’s carbon emissions. The Guardian.
Weisz, H., W. Haas, N. Eisenmenger, F. Krausmann & A. Schaffartzik. (2007) Economy-wide Material Flow Accounts Resource Productivity. EU-15. 1990– 2004 Luxembourg: Eurostat.
Wiedmann, T. (2009) A review of recent multi-region input-output models used for consumption-based emission and resource accounting Ecological Economics, 69, 211–222.
Wiedmann, T. O., H. Schandl, M. Lenzen, D. Moran, S. Suh, J. West & K. Kanemoto (2015) The material footprint of nations. Proceedings of the National Academy of Sciences, 112, 6271–6276.
Wirsenius, S. (2000) Human Use of Land and Organic Materials: Modelling the Turnover of Biomass in the Global Food System. In Department of Physical Resource Theory. Göteborg: Chalmers University of Technology.
Wood, R., K. Stadler, T. Bulavskaya, S. Lutter, S. Giljum, A. de Koning, J. Kuenen, H. Schütz, J. Acosta-Fernández & A. Usubiaga (2015) Global Sustainability Accounting—Developing EXIOBASE for Multi-Regional Footprint Analysis. Sustainability, 7, 138–163.
5 Responses to Limits to Growth? 2016 United Nations report provides best evidence yet