
China: Is peak coal part of its problem?
by Gail Tverberg, OurFiniteWorld.com | Jun 20, 2016
The world’s coal resources are clearly huge. How could China, or the world in total, reach peak coal in a timeframe that makes a difference?
If we look at China’s coal production and consumption in BP’s 2016 Statistical Review of World Energy (SRWE), this is what we see:
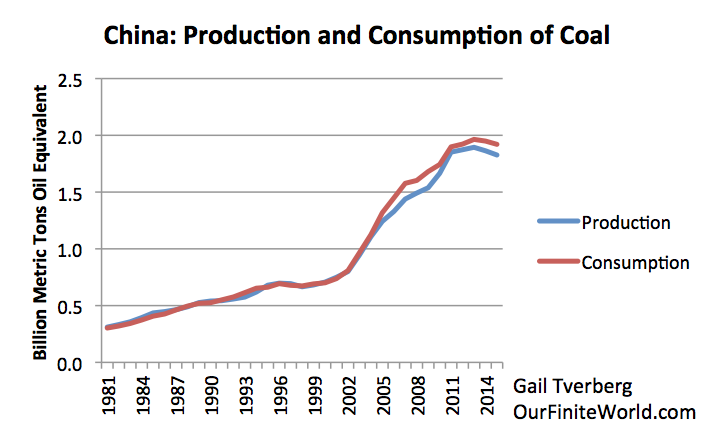
Figure 1. China’s production and consumption of coal based on BP 2016 SRWE.
Figure 2 shows that the quantities of other fuels are increasing in a pattern similar to past patterns. None of them is large enough to make a real difference in offsetting the loss of coal consumption. Renewables (really “other renewables”) include wind, solar, geothermal, and wood burned to produce electricity. This category is still tiny in comparison to coal.
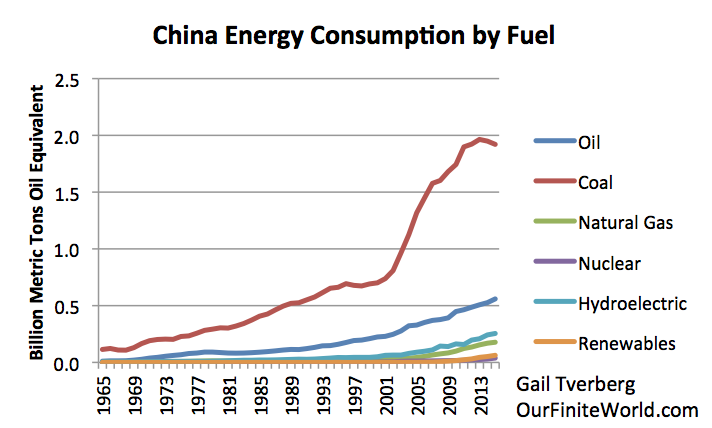
Figure 2. China’s energy consumption by fuel, based on BP 2016 SRWE.
Why would a country selectively decide to slow down the growth of the fuel that has made its current “boom” possible? Coal is generally cheaper than other fuels. The fact that China has a lot of low-cost coal, and can use it together with its cheap labor, has allowed China to manufacture goods very inexpensively, and thus be very competitive in world markets.
In my view, China really had no choice regarding the cutback in back coal production–market forces were pushing for less production of goods, and this was playing out as lower commodity prices of many types, including coal, oil, and natural gas, plus many types of metals.
China is mostly self-sufficient in coal production, but it is a major importer of natural gas and oil. Lower oil and natural gas prices made imported fuels of these types more affordable, and thus encouraged more importing of these products. At the same time, lower coal prices made many of China’s mines unprofitable, leading to a need to cut back on production. Thus we see the rather bizarre result: consumption of the cheapest energy product (coal) is falling first. We will discuss this issue more later.
China’s Overall Historical Production of Energy Products
With the pattern of energy consumption shown in Figure 2, growth in China’s total fuel consumption has slowed, as shown in Figure 3.
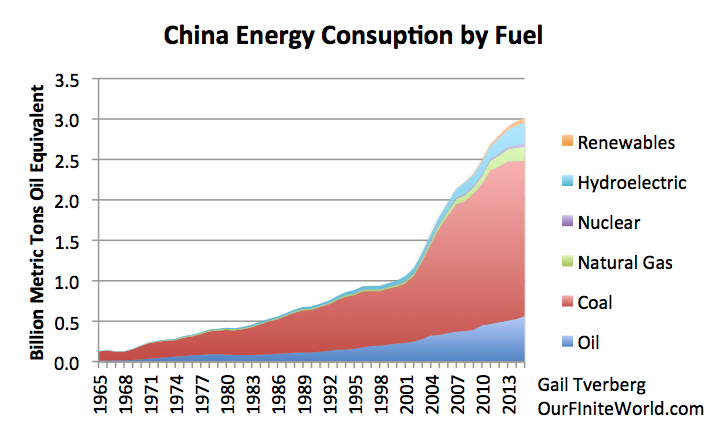
Figure 3. China energy consumption by fuel, based on BP 2016 SRWE.
The indicated increases in total fuel consumption in Figure 3 are as follows: 8.1% in 2011; 4.0% in 2012; 3.9% in 2013; 2.3% in 2014; 1.5% in 2015.
Unless there is a huge shift to a service economy, we would expect China’s GDP to decrease rather rapidly as well, perhaps staying 1% or 2% higher than the growth in fuel consumption. Such a relationship would suggest that China’s reported GDP for 2014 and 2015 may be overstated.
The Problem of Low Coal Prices
Most of us don’t pay attention to coal prices around the world, but according to BP data, coal prices have been following a similar pattern to those of oil and natural gas.
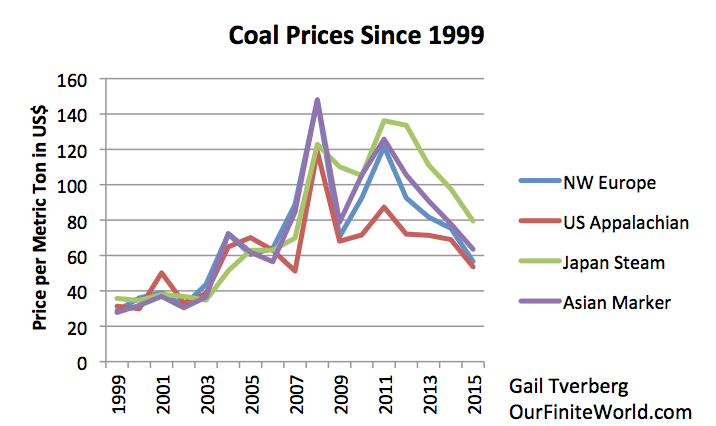
Figure 4. Coal prices since 1999 based on BP 2016 SRWE data.
Oil prices tend to cluster more closely than those of coal and natural gas because there is more of a world market for oil than for the other fuels. Coal and natural gas have relatively high delivery costs, making it more expensive to trade these products internationally.
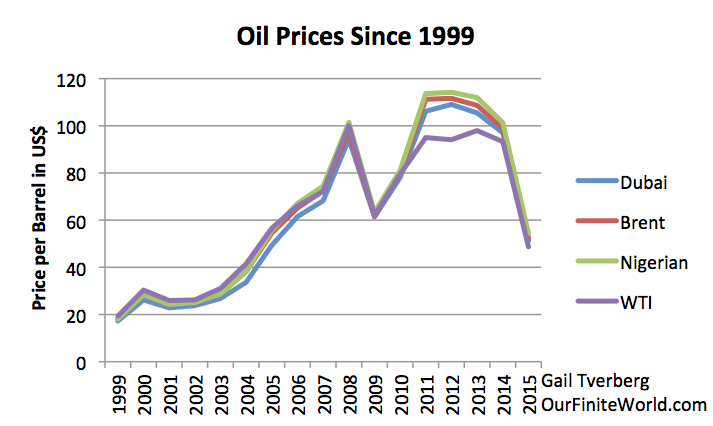
Figure 5. World oil prices since 1999 for various oil types, based on BP 2016 SRWE. (Prices not adjusted for inflation.)
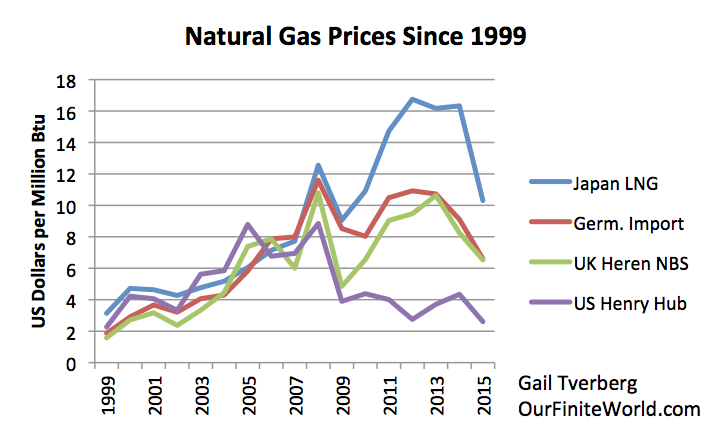
Figure 6. Historical prices for several types of natural gas, from BP 2016 SRWE
The one place where natural gas prices failed to follow the same pattern as oil and coal prices was in the United States. After 2008, shale producers extracted more natural gas for the US market than it could easily absorb. This overproduction, together with a lack of export capacity, led to falling US prices. By 2014 and 2015, prices were falling everywhere for oil, coal and natural gas.
Why Prices of Fossil Fuels Move Together
The reason why prices of fossil fuels tend to move together is because commodity prices reflect “demand” at a given time. This demand is determined by a combination of wage levels and debt levels. When wage levels are high and debt levels are increasing, consumers can afford more goods, such as new homes and new cars. Building these new homes and cars takes many different kinds of materials, so commodity prices of many kinds tend to rise together, to encourage production of these diverse materials.
Why Fossil Fuel Prices Don’t Necessarily Rise Indefinitely
Rising fossil fuel prices depend on rising demand. Wages are not really rising fast enough to increase fossil fuel prices to the levels shown in Figures 4, 5, and 6, so the world has had to depend on rising debt levels to fill the gap. Unfortunately, there are diminishing returns to adding debt. We can witness the poor impact that Japan’s rising debt level has had on raising its GDP.
Adding more debt is like using an elastic rubber band to increase the world output of goods and services. Adding debt works for a while, as the relatively elastic economy responds to growing debt. At some point, however, the amount of debt required becomes too high relative to the benefit obtained. The system tends to “snap back,” and prices fall for many commodities at the same time. This seems to be what happened recently in late 2008, and what has happened again recently. The challenge is to restore world economic growth, since it is really robust world economic growth that allows commodity prices to rise to high levels.
Some Historical Perspective on Rising Energy Prices and Rising Debt
In “normal” times, a small increase in demand will increase production of fossil fuels by several percentage points–generally enough to handle the rising demand. Prices can then fall back again and there is no long-term rise in prices. This situation occurred for quite a long time prior to about 1970.
After about 1970, we found that it became more difficult to raise production levels of energy products, without permanently raising prices. US oil production began to decline in 1970. This started an energy crisis that has been simmering beneath the surface for 45 years. Various workarounds for our energy shortage problem were tried, such as adding nuclear, drilling for oil in new areas such as the North Sea, and building more energy efficient cars. Another approach used was reducing interest rates, to make high-priced homes, cars and factories more affordable.
By the late 1990s, even these workarounds were no longer providing the benefit needed. Another idea was tried: encourage more international trade. This would allow the world access to untapped energy sources, including coal, in the less developed parts of the world, such as China and India.
This too, worked for a while, but resource depletion tended to continue to raise the cost of energy extraction. Also, the competition with low-cost labor in India, China, and other countries tended to hold down the wages of the less-educated workers in the developed countries. Higher prices at the same time that wages for some of the workers were depressed is, of course, a bad mismatch.
One way of “fixing” the problem was with cheaper debt, and more debt, so that consumers could buy homes and cars with lower incomes. This fix of more debt stopped working in 2008, as repayment on “subprime” debt faltered, and all fossil fuel prices collapsed.
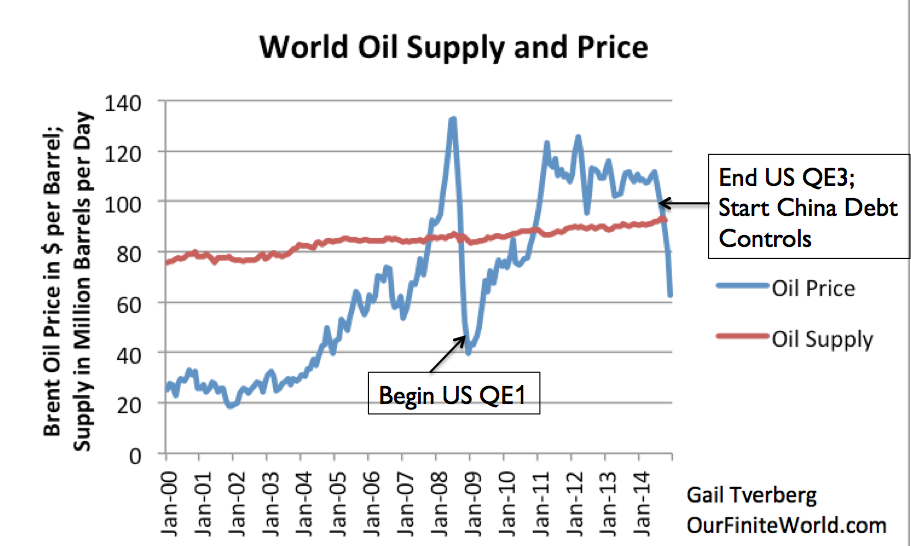
Figure 7. World Oil Supply (production including biofuels, natural gas liquids) and Brent monthly average spot prices, based on EIA data.
To “re-inflate” the world economy, world leaders began to try to add even more debt. They did this by fixing interest rates even lower, starting in late 2008, using a program called Quantitative Easing (QE). This program was successful in raising commodity prices again, although its effect seemed to diminish with time. China’s huge growth in debt during this period helped as well.
Energy prices turned downward again in mid-2014, when the United States discontinued its QE program, and China (under new leadership), decided not to continue increasing debt as quickly as before. The result was a second sharp drop in commodity prices, without a corresponding drop in the cost of producing these fossil fuels. This shift was devastating from the point of view of energy supply producers.
Impact of Lower Prices on China’s Coal Producers
China has a lot of coal resources, but not all of these resources can be produced cheaply. Generally, the least expensive resources tend to be produced first. When prices are high, it may look like deeper, thinner seams can be extracted, in addition to the easier and cheaper to extract seams, but this is never certain. At some point, prices may fall and thus issue a “stop mining” instruction.
When coal prices drop, producers are likely to encounter debt problems, as loans related to coal operations become due. The reason why this happens is because loans taken out when coal prices were high are likely to reflect an optimistic view of how much can be extracted. Once prices drop, operators discover that they have committed themselves to paying back more in loans than their coal mines can actually produce. This seems to be happening now.
What Are the Implications for Future World Coal Production?
If we look at a chart showing world consumption of energy products by fuel, we see that world coal production has turned down in a similar manner to the downturn in Chinese coal production.
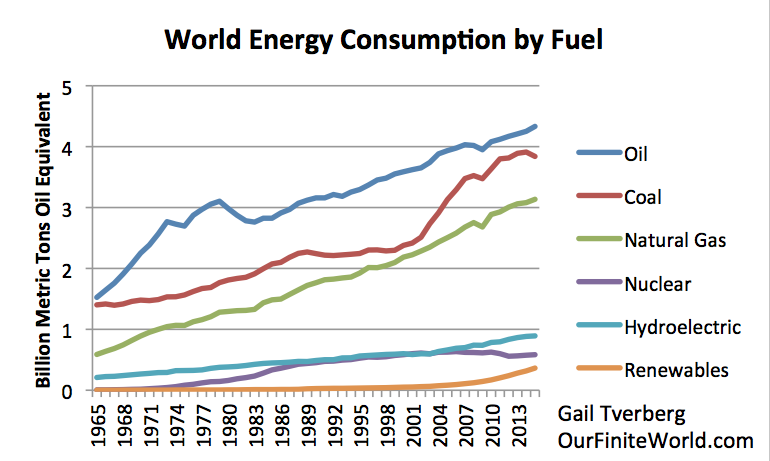
Figure 8. World energy consumption by fuel, separately by major groupings.
There are many large areas of the world that seem to be beyond their peak in coal production, including the United States, the Eurozone, the Former Soviet Union, and Canada. Note that the United States’ coal production “peaked” in 1998. This added to pressures for globalization.

Figure 9. Areas where coal production has peaked, based on BP 2016 SRWE. FSU means “Former Soviet Union.”
If we consider the rest of the world excluding the areas shown separately in Figure 9 as the “Non-Peaking Portion of the World,” we find that China’s current coal production far exceeds that of the Non-Peaking portion of world production.
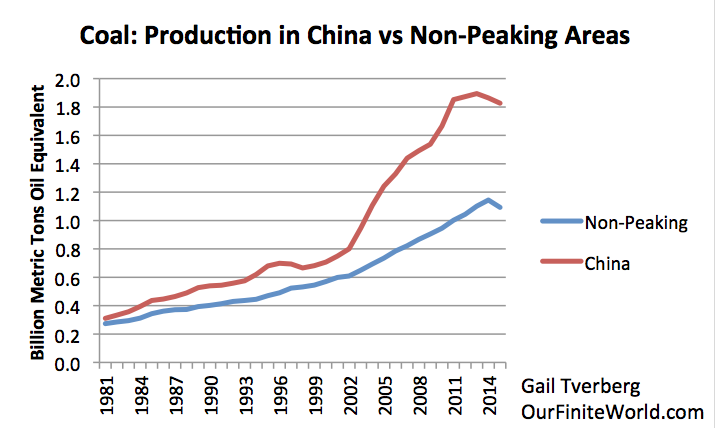
Figure 10. Coal production in China compared to world production minus production shown in Figure 8.
Figure 10 indicates that even the non-peaking portion of the world is showing a downturn in production in 2015, no doubt relating to current low prices.
Another issue is that India’s coal production now falls far short of its consumption. Thus, India is becoming a major coal importer. In 2015, India’s consumption of coal slightly exceeded that of the United States, making it the second largest consumer of coal after China, and the largest coal importer. If China should decide to increase its coal consumption by adding imports, it would need to compete with India for supplies.
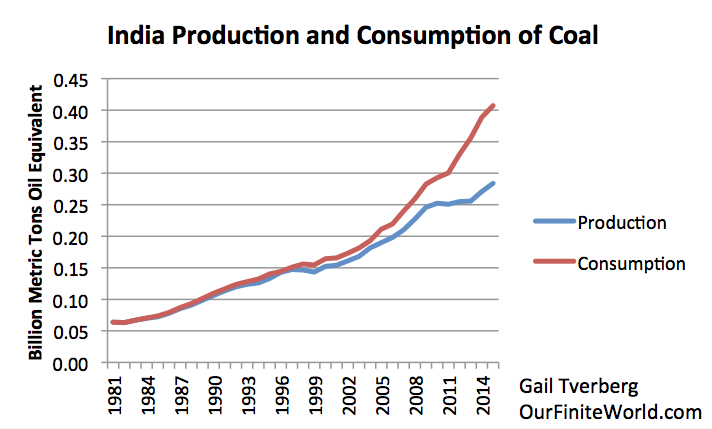
Figure 11. India’s production and consumption of coal, based on BP 2016 SRWE.
India’s hope for continued economic growth is also tied to coal, even though it doesn’t produce enough itself. India’s use of natural gas is declining, because its own locally-produced natural gas supplies are declining, and imports are expensive.
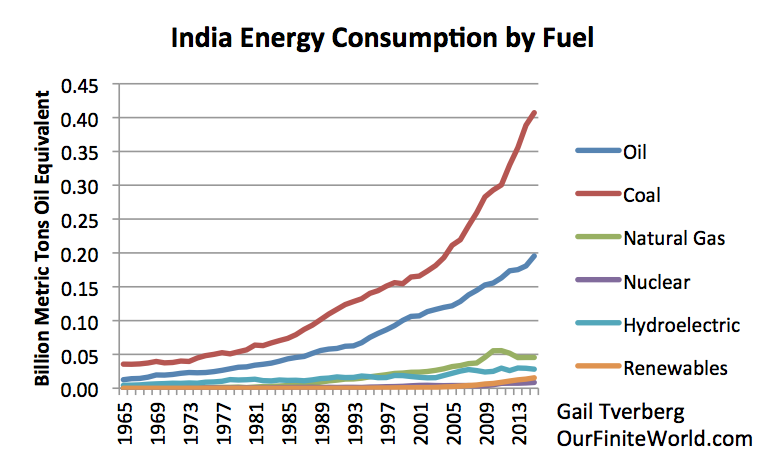
Figure 12. India’s energy consumption by fuel based on BP 2016 SRWE.
Imported coal is more expensive than locally produced coal, because of the transportation costs involved. Thus, adding an increasing portion of imported coal will eventually make India’s products less price competitive. India started from a lower wage level than China, so perhaps it can temporarily withstand a somewhat higher average coal price. At some point, however, it will reach limits on how much of its mix can be imported, before workers cannot afford its products made with this high-priced coal.
As noted above, India and China will be competing for the same exports, if they both expect to grow using imported coal. We can modify Figure 9 to show what the size pool producing imports might now look like, if the countries needing imports is “China + India,” and the part with perhaps extra coal to export is the Non-Peaking Areas from Figure 9, less India.
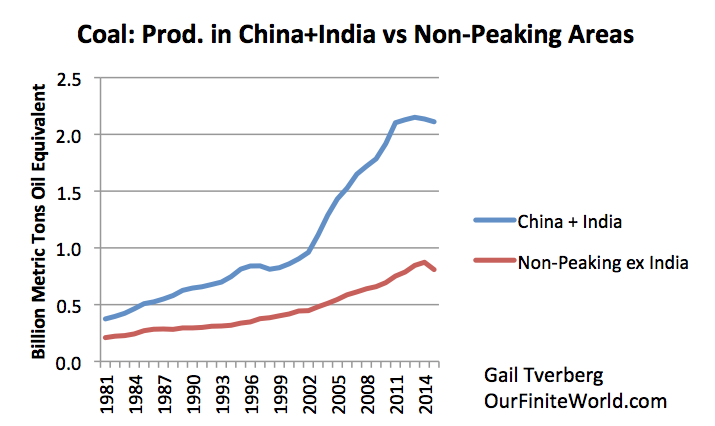
Figure 12. Coal production for China plus India, compared to production from non-peaking group used in Figure 9, minus India. Based on BP 2016 SRWE.
This comparison shows an even a worse mismatch between the peaking areas, and the current production of areas that might raise their supply.
Is Future Coal Production a Function of Resources Available, or of Prices?
Future coal production is clearly a function of both the amount of resources available and future prices. If there are no resources available, it is pretty clear that no resources can be extracted.
What most researchers have not understood is that future prices are important as well. We can’t expect that prices will rise indefinitely, because low-paid workers, especially, find themselves in a squeeze. They find homes and cars increasingly unaffordable, unless the government can somehow manipulate interest rates down to never heard of levels. Because of this lack of understanding of the role of prices, most of today’s models don’t considered the possibility that price levels may cut back production, at what seems to be an early date relative to the amount of resources in the ground.
Part of the confusion comes the view economists have regarding prices, innovation, and substitution. Economists seem to be firmly convinced that prices will always rise to fix the problem of future shortages, but their models do not seem to take into account the major role that energy plays in the economy, and the lack of available substitutes. Certainly, the history of energy prices does not support this claim.
If I am correct in saying that prices cannot rise indefinitely, then all three of the fossil fuels are likely to peak, more or less simultaneously, when prices can no longer stay high enough to enable extraction. The downslope after the peak will be based on financial outcomes, such as the bankruptcies of coal operators, not on the exhaustion of reserves or resources in the ground. This dynamic can be expected to produce a much sharper downturn than modeled by the Hubbert Curve.
If analysts consider the possibility that prices will never again rise very high for very long, they realize such a low-price scenario would be a catastrophe. That is why we hear very little about this possibility.
Conclusion
It appears likely that China’s coal production has “peaked” and has begun to decline. This is especially likely if energy prices stay low, or never rise very high for very long.
If I am correct about energy prices not rising high enough in the future, all fossil fuels may reach peak production more or less simultaneously in the not too distant future. Widespread debt defaults seem likely if this happens.
If we are, in fact, reaching peak coal, even before peak oil, this is disconcerting for those who believe that the Hubbert Model is the only way of viewing the world. Maybe we are expecting too much from the model; maybe we need a model that considers prices, and how prices depend on wages and rising debt. Falling energy prices are especially bad for the system; they seem to lead to debt defaults.