
Preface. Before the fossil fuel age began, about 80 to 90% of people farmed to make a living. Since the end of the oil age will send us back to the past, farmland and farmers will once again comprise the greatest numbers of people. So it’s alarming that on the cusp of peak global production of oil, we’re losing farmland at such a fast clip to development. We need all the land we can get – in the Great Depression people were hungry at a time when there were just 100 million people and 25% of them were farmers, while now just 1% of people are.
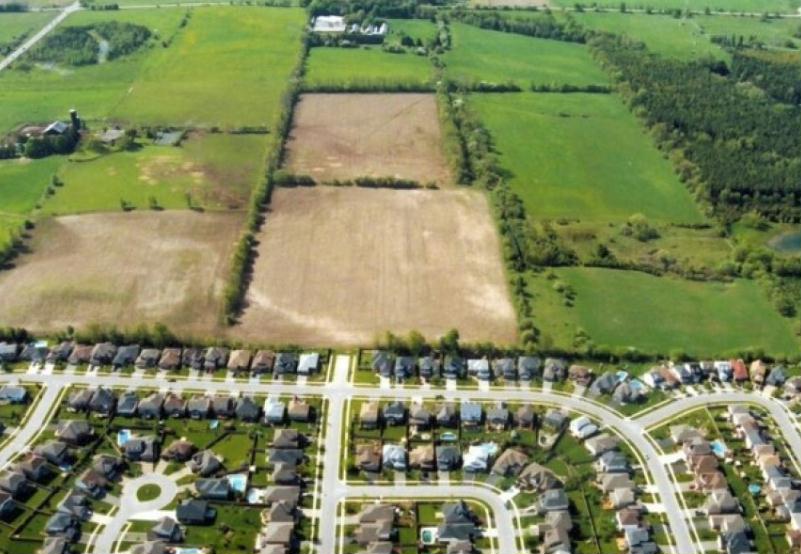
As Kolankiewicz points out in the article below: “Vanishing Open Spaces Population Growth and Sprawl in America”, cities were built where the best farmland and water existed. As cities and towns grow, they sprawl outwards over this prime farmland. This is where 85% of developmental sprawl happens. The United Nations calls this soil sealing – the permanent covering of soil with impermeable materials such as asphalt or structures. This leads to a total soil loss of food and fiber production, for water to infiltrate and be held and purified, and often increases flooding , the ability of the soil to hold water, loss of purification capacities, loss of carbon sequestration, increased urban heat from the loss of vegetation, and less biodiversity (FAO 2015).
Between 1945 and 1975, enough farms disappeared beneath concrete to pave Nebraska (Montgomery 2007), about 49.5 million acres (77,350 square miles).
Between 1982 and 2010 the U.S. lost 41.4 million acres, 14% of its crop land. That’s equal to 65,000 square miles, an area as large as Maine, New Hampshire, Vermont, Massachusetts, Connecticut, Rhode Island, Delaware, New York, and Pennsylvania
Over a third of all land that has ever been developed occurred in the last 25 years. If we keep paving over cropland at this rate, it will all be gone in 200 years.
It’s hard to imagine this ending without energy decline. In the U.S., population grew by 18.4 million people from 2010 to 2018 (10,700,000 births, 7,700,000 legal migrations). So not counting illegal immigration, every year another 2.3 million people arrive who need to be fed, housed, provided with clean water, sewage systems, roads, stores, and much more.
That is equivalent to building a new Houston every year from scratch. Or a new Miami, St. Louis, Pittsburgh, Cincinnati, Cleveland, AND Atlanta. Every year. At this rate of population growth, there’ll be 184 million more people in the U.S. by 2100, nearly twice as many people as in the largest 311 cities in the U.S. (USC 2018, Wikipedia 2017).
Not only is soil being paved over, it’s being degraded. The Midwest has lost over half of its topsoil in just 100 years because of intensive industrial agricultural soil mining. Globally, over 75% of Earth’s land is significantly degraded, affecting 3.2 billion people. At current rates, 95% of Earths land could be degraded by 2050, forcing millions to migrate as food production fails (Leahy 2018).
As it is, there isn’t enough land to grow more than a fraction of the biofuels needed to replace diesel fuel, and with land vanishing from development and topsoil loss, that’s an empty hope for the future.
Kolankiewicz’s “Vanishing open spaces” is also sprawling at 170 pages, so I didn’t begin to cover everything in it. If you’re interested in learning more, or want to see where your town or city ranks on the sprawl charts, you might want to delve into this more.
Alice Friedemann www.energyskeptic.com Author of Life After Fossil Fuels: A Reality Check on Alternative Energy; When Trucks Stop Running: Energy and the Future of Transportation”, Barriers to Making Algal Biofuels, & “Crunch! Whole Grain Artisan Chips and Crackers”. Women in ecology Podcasts: WGBH, Jore, Planet: Critical, Crazy Town, Collapse Chronicles, Derrick Jensen, Practical Prepping, Kunstler 253 &278, Peak Prosperity, Index of best energyskeptic posts
***
Kolankiewicz, L., et al. 2014. Vanishing Open Spaces Population Growth and Sprawl in America. Numbers USA.
The massive destruction of America’s open spaces continued during the first decade of this new century. In just the eight years from 2002 to 2010, over 8.3 million acres (approximately 13,000 square miles) of farmland and natural habitat succumbed to the bulldozer’s blade. That is an area larger than the entire state of Maryland – cleared, scraped, filled, paved and built over – in less than a decade.
This update of our previous studies about sprawl at the end of the 20th century relies on the latest painstaking surveys by government agencies. They have tracked how, since the beginning of the 21st century, America’s population is growing by tens of millions more residents and sprawling over vast new expanses of woodlands, wetlands, fields and pastures. These are the open spaces on which the country’s human residents depend for food, fiber and the nourishment of their spirits, and to which the non-human inhabitants often tenuously cling for life itself.
This study finds that around 70% of those losses around Urbanized Areas over the last decade were related to the nation’s continuing trend of high population growth. Yet, there is little sign that the nation is ready to substantially change this population trend – or even to much discuss it – although the open-space destruction it is driving is not sustainable over the long term.
Sprawl Data and Analysis for Each City (2000-2010) Residents of all 497 of the Urbanized Areas designated by the U.S. Bureau of Census can find in this report answers to the following questions about your home city over the past decade:
TOTAL SPRAWL: How many square miles of farmland and natural habitat were destroyed as your city expanded outward? Where does that rank among all other cities in open-space loss?
Roughly 85 percent of all destruction of farmland and natural habitat nationwide occurred around the edges of the 497 mostly-sprawling Urbanized Areas. And much of the rest of the losses are due to urban residents’ demands for rural second homes, rural recreation development and rural transportation.
Many of our findings about the relationship between population growth and sprawl may strike the reader as unsurprising and as simple common sense. We agree that, for example, it just makes sense that the cities with the largest population growth would tend to have the largest sprawl. But the need for this study is found in the fact that few in the news media or in organizations that express concern about the loss of farmland and natural habitat identify population growth as a major factor, or even a factor to be modified at all.
The 3.8% increase in per capita land consumption during the 2000-2010 decade compares with the 11.5% increase in population (See Figure ES-2). That slowing of consumption growth would appear to be the result of a combination of factors, including smart growth efforts, higher gasoline prices, fiscal and budgetary constraints (limiting new road-building, for example), various changes in the per capita factors listed earlier, and the recession-inducing mortgage meltdown.
Cumulative Results of Sprawl Are Piling Up For Farm and Forest. The country’s cropland provides a frightening example of where these trends will lead if dramatic changes are not made. In 1980, we had an average of 1.9 acres of cropland for each American. But 90 million more people have been added to the country since then. Not only are there far more people to share the cropland, but there is far less cropland to share because of the way cities have sprawled to accommodate the extra population. By 2010, the average amount of cropland per American had fallen from 1.9 acres to 1.2 acres. If this trend were to continue, there would be only 0.7 acre of cropland per American in 2050 and only 0.3 acre in 2100. That seems unfathomable, but it is the trajectory the country is traveling.
From 1982 to 2010, 41.4 million acres (approximately 65,000 square miles) – an area equivalent to the state of Florida – of previously undeveloped non-federal rural land was paved over to accommodate our growing cities.
Of these 41 million lost acres of open space, over 17 million acres were forestland, 11 million acres cropland, and 12 million acres pasture and rangeland.
As the Natural Resources Conservation Service of the U.S. Department of Agriculture put it in their 2007 summary report that reviewed the 1982-2007 quarter-century: “The net change of rural land into developed land has averaged 1.6 million acres per year over the last 25 years, resulting in reduced agricultural land, rangeland, and forest land. Loss of prime farmland, which may consist of agriculture land or forest land, is of particular concern due to its potential effect on crop production and wildlife.
The NRCS also observed that “more than one-third of all land that has ever been developed in the lower 48 states was developed during the last quarter-century.
The total area of developed land grew from 71.9 million acres (112,356 square miles) in 1982 to 113.3 million acres (177,096 square miles) in 2010. This latter area is about equal in size to the entire states of Maine, New Hampshire, Vermont, Massachusetts, Connecticut, Rhode Island, Delaware, New York, and Pennsylvania. All of this land was developed from either agricultural land or natural habitat.
Since the NRCS began its National Resources Inventory (NRI) in 1982, its data reveal that every new person added to the United States population entails on average the elimination of about half an acre of farmland or natural habitat.
According to the World Wildlife Fund, habitat loss poses the greatest threat to endangered species. The United States is home to over 1,000 endangered or threatened animal and plant species that are seriously harmed by ever-encroaching development.
The single greatest type of land developed in each period was forest land. Forest land is, of course, wildlife habitat. More broadly, it is a type of “natural capital” that provides a range of ecological services and socioeconomic benefits, among them climate regulation, watershed protection, soil conservation, flood prevention, streamflow moderation, wood products, aesthetic qualities, and it serves as a magnet for outdoor recreation such as hunting, fishing, hiking, and wildlife observation and photography. [AND IT KEEPS TOPSOIL FROM WASHING AWAY]
National Opinion Survey for This Study Finds Americans Concerned With the subject of sprawl largely absent from the news for several years now,
We commissioned Pulse Opinion Research to poll likely American voters on their attitudes. The full survey and results can be viewed in Appendix K. Key findings: 92% say it is important (71% “very important”) to protect farmland from • development to ensure the ability to feed the U.S. population in the future. • By a 3-1 margin, Americans think it is unethical to pave over good cropland rather than being legitimate to provide housing for a growing population.
It also discusses ways that local officials trying to protect surrounding open spaces can slow local population growth through such means as requiring developers to pay the full costs of the population growth they attract (developer’s or impact fees).
Local officials supportive of growth control can hope only to slow population growth in their jurisdictions if national population continues to increase by some 2.5 to 3 million additional residents each year. These 25-30 million additional Americans each decade will nearly all settle in some community, inevitably leading to additional sprawl as far and as long as the eye can see.
Nearly all long-term population growth in the United States is in the hands of federal policy makers, because nearly all long-term population growth is related to federal immigration policies that have increased the annual settlement of immigrants from one-quarter million in the 1950s and1960s to more than a full million per year since 1990. Until the numerical level of national immigration is addressed, even the best local plans and political commitment will be unable to stop sprawl. Any serious efforts to halt the loss of farmlands and wildlife habitats must include reducing the volume of U.S. population growth. And a presidential commission on sustainability concluded that the U.S. population cannot be stabilized without deep reductions in annual legal immigration and more effective control of illegal immigration.
That would appear to be a popular option among most Americans, according to this study’s national survey (Appendix K): • 68% of likely voters said the government should “reduce immigration to slow down population growth.” • In light of concerns about sprawl, 40% of respondents said they would like annual immigration to be cut from one million a year to either 100,000 or zero per year. (63% said cut immigration at least in half to 500,000 a year.)
While there is more than one way to define sprawl, our studies consider it to be the conversion of open spaces like farmland and natural habitat into developed land holding man-made structures and surfaces on the expanding edges of urban areas or elsewhere.
1.1 Still a Problem After All These Years (and Americans Still Concerned) When the first edition of this study was published in 2001, sprawl was a hot topic with many environmental organizations, and the general public worried about the impacts of ever expanding cities and the nation’s steadily disappearing rural land.1 Thirteen years later, sprawl is still devouring valuable farm and forestland, but national environmental groups, by and large, have shifted their focus to global issues and away from the loss of habitat and open space due to the unsustainable growth of cities.
Table 1 lists the top 10 Urbanized Areas that eliminated the most rural land over the past decade (2000-2010). Clearing, scraping, paving, and building over thousands of square miles of America’s woodlands, wetlands, croplands, prairies, pastures, range, deserts, and fields, they truly earned the dubious distinction as the nation’s “Top Sprawlers.” It is noteworthy, and surely not a coincidence, that four of the Top Ten Sprawlers are in Texas, the state that grew far more (adding the greatest number of people) than any other state in the country from 2000 to 2010 – 4.2 million compared to California’s 3.2 million and Florida’s 2.8 million.
By 2002, the more than 1.5 million legal and illegal immigrants who settled in the country each year along with 750,000 yearly births to immigrants caused 87% of the annual increase in the U.S. population.
Contrary to the common perception, about half the country’s immigrants lived in the nation’s suburbs. The pull of the suburbs is even greater in the second generation. Of the children of immigrants who settled down and purchased a home, only 24 percent did so in the nation’s central cities. The suburbanization of immigrants and their children was a welcome sign of integration. But it also meant they contribute to sprawl just like other Americans.
“In short,” concluded the 2003 study, “Smart Growth efforts to slow or stop the increase in per capita land use are being negated by population growth. Immigration-driven population growth, in effect, is ‘out-smarting’ Smart Growth initiatives by forcing continued rural land destruction.
American sprawl is more than a domestic issue. It also has global implications. The relentless and accelerating disappearance of natural habitats dominated by communities of wild plants and animals, replaced by biologically impoverished artificial habitats dominated by human structures and communities, contributes cumulatively to what may become a “state shift” or “tipping point” in Earth’s biosphere.
This would be an uncontrollable, rapid transition to a less desirable condition in which the biosphere’s ability to sustain us and other species would be severely compromised. A 2012 paper in the prestigious British scientific journal Nature reviews the evidence that: “…such planetary scale critical transitions have occurred previously in the biosphere, albeit rarely, and that humans are now forcing another such transition, with the potential to transform Earth rapidly and irreversibly into a state unknown in human experience.
1.4 National Security Implications of Farmland Loss
Development is not the only factor responsible for the degradation and disappearance of high-quality agricultural land. Arable land is also vulnerable to other damaging natural and anthropogenic forces such as soil erosion from wind and water, and salinization and waterlogging from irrigation, which can compromise the fertility, productivity, and depth of soils, and possibly even lead to their premature withdrawal from agriculture. Many of these adverse effects are due to over-exploitation by intensive agricultural practices needed to constantly raise agricultural productivity (yield per acre)
Thus, the potent combination of unrelenting development and land degradation from soil erosion and other factors is reducing America’s productive agricultural land base even as the demands on that same land base from a growing population are increasing.
The NRI estimates that the amount of cropland in the United States declined from 420 million acres in 1982 to 361 million acres in 2010, a decrease of nearly 60 million acres (14 percent) in just 28 years (Figure 5). Some of this cropland (cumulatively, 27 million acres in 2010) was withheld from active farming with federal government support and subsidies and placed into the Conservation Reserve Program (CRP), but these tend to be marginal or fragile sites on which cultivation is not deemed to be sustainable in any case. Even with the federal ethanol mandate and strong financial incentives over much of the last decade to grow corn in order to produce ethanol as fuel for vehicles, the amount of cropland dropped by seven million acres in the eight years between 2002 and 2010, increasing slightly between 2007 and 2010.8 The land uses into which cropland was converted are depicted in Figure 6. Cropland Converted to other Land Uses from 2007 to 2010
If the same rate of cropland conversion and loss that prevailed from1982 to 2010 were to continue to the year 2100, the United States will have lost an additional 193 million acres of its remaining 361 million acres of cropland, for a total cumulative loss of 253 million acres. Only 168 million acres would then remain – about 40 percent of the original allotment – and none of this acreage would be in pristine condition after two centuries or so of intensive exploitation. Its soils and nutrients, while perhaps not exhausted, would require even greater inputs of costly fertilizers. Two of the most crucial fertilizers – ammonium nitrate, produced from natural gas, and phosphorus, produced from phosphate mines – may be far more expensive, perhaps prohibitively so, in 2100 than at present, due to the inexorable depletion of the highest-quality reserves of these non-renewable resources.
However, this dire scenario is unlikely to come to pass, even if the United States continues to reject population stabilization as an acceptable course of action or to enact more aggressive farmland protection measures. This because rising demand and prices for foodstuffs would increase the value of land maintained as cropland vis-à-vis developed land, and because conversion from other types of lands to cropland, including pastureland, rangeland, forested land and other natural areas, would certainly occur (Figure 8). This actually did happen from 2007 to 2010, during which the area in cropland increased by 1.9 million acres; most of this was CRP land called back into production because high agricultural commodity prices encouraged farmers to plant it. Again, in an ideal world, erosive or sensitive CRP lands should not be cultivated and would best be conserved as wildlife habitat; that is why the voluntary Conservation Reserve Program was established in the first place in the 1980s.
Furthermore, the decrease from 1982 to 2010 in the acreage of highest quality soils classified as Prime Farmland, which constitutes only 23 percent (or 316 million acres) of the non-Federal rural land base was “only” 13 million acres, compared to the nearly 60-million-acre decrease in cropland. NRCS states that “most of this loss was due to development.
As shown in Figure 9, not all designated Prime Farmland is cultivated as cropland; indeed, only 64 percent of it is cropland; the rest is in other non-developed land uses or cover types.
Figure 9. Prime Farmland by Type in 2010
Ominous, divergent trends – an increasing population, a decreasing arable land base, diversions of water supplies needed for irrigated agriculture to urban populations, and a modern, mechanized agriculture that is heavily dependent on limited fossil fuels at all stages – have led some scientists to conclude that someday within this century the United States may cease to be a net food exporter.9 Food grown in this country would be needed for domestic consumption. By mid-century, the ratio of arable land per capita may have dropped to the point that, “the diet of the average American will, of necessity, include more grains, legumes, tubers, fruits and vegetables, and significantly less animal products.”10 While this may in fact constitute a healthier diet, it would also represent a significant loss of choice for a country that has always prided itself on its abundant agriculture, plentiful consumer options, and comparative freedom from want.
Preserving farmland and maintaining its fertility is more than a question of producing an adequate supply of food and engendering a healthy diet for Americans, it is a matter of national security. According to Brig. Gen. (Ret.) W.E. King, Ph.D., P.E., Dean of Academics, U.S. Army Command and General Staff College, Fort Leavenworth, Kansas, without a sustainable environment and resources that meet basic human needs, instability and insecurity will be the order of the day.
As Oxford ecology professor Norman Meyers noted in a now-classic 1986 article: “…national security is not just about fighting forces and weaponry. It relates to watersheds, croplands, forests, genetic resources, climate and other factors that rarely figure in the minds of military experts and political leaders…”
One of the lasting effects on the world food system of the global crisis in food prices from 2007 to 2008 has been the accelerating acquisition of farmland in poorer countries by wealthier countries which seek to ensure their food supplies.
By 2009, foreign governments and investors had already purchased more than 50 million acres (78,000 square miles) of farmland – an area the size of Nebraska – in Africa and Latin America.
Finally, U.S. agriculture and related food industries contribute nearly $1 trillion to our national economy annually. They comprise more than 13 percent of the GDP and employ 17 percent of the labor force.
Between 2000 and 2010, the country’s urban population grew by 12.1%, in comparison with total U.S. population growth of 9.7% during the same period. In other words, America’s urban areas grew at a faster pace than the country as a whole, continuing a demographic trend – a relative shift or migration of the population from rural to urban areas – that has been underway for more than a century. This trend is evident around the entire world.
NRI’s category of developed land differs from that used by other federal data collection entities. While other studies and inventories emphasize characteristics of human populations (e.g., Census of Population) and housing units (e.g., American Housing Survey), for the NRI, the intent is to identify which lands have been permanently eliminated from the rural land base. The NRI Developed Land category includes: (a) large tracts of urban and built-up land; (b) small tracts of built-up land less than 10 acres in size; and (c) land outside of these built up areas that is in a rural transportation corridor (roads, interstates, railroads, and associated rights-of-way).
An urban area’s population growth today is much more likely to be the result of enticing residents from elsewhere. Local and state governments can and do create many incentives that encourage people to move into a city. These include aggressive campaigns to persuade industries to move their jobs from another location, public subsidies for the infrastructure that supports businesses, expansion of water service and sewage lines into new areas, new housing developments and new residents, and general public relations that increase the attractiveness of a city to outsiders. Even without trying, a city can attract new residents just by maintaining amenities and a high quality of life, especially if the nation’s population is growing significantly, as continues to be the case today.
Even the best Smart Growth, New Urbanism, and LEED43 strategies were able to engineer only so much population density. As long as population is still growing, the land area taken up by our cities will almost certainly continue to grow.
Dr. John Holdren, Assistant to the President for Science and Technology and Director of the White House Office of Science and Technology Policy since 2009, developed and applied this methodology in a scientific paper evaluating how much of the increase in energy consumption in the United States in recent decades was due to population growth, and how much to increasing per capita energy consumption.
Given this apportionment or breakdown, opponents of sprawl in the nation’s worst sprawling Urbanized Area, for example, can know that nearly their entire problem has been the inability to stabilize the Atlanta area’s population. In contrast, a relatively small part of the problem (15%) has been the inability to stabilize the per capita land use of the area.
% of Total Sprawl Related to Growth in PER CAPITA LAND CONSUMPTION
Figure 17 illustrates the results of applying the Holdren method to the entire population and land area of the 96 largest Urbanized Areas (corresponding to the 100 largest UAs in the 1990 UA delineation and our earlier 2001 and 2003 studies). Of the 57,055 square miles of total sprawl, 30.5% of the lost rural land was related to the growth in per capita land consumption by the residents of those cities. In contrast, 69.5% of the lost rural land, more than two-thirds, was related to the fact that an additional 17 million people net, moved into or were born in those cities. It is worth noting that from 1970 to 1990,
for these same UAs, Population Growth accounted for about half of Overall Sprawl, and Per Capita Sprawl for the other half. For the most recent 2000-2010 period, in contrast, Population Growth has obviously become the dominant factor, accounting for about seven out of every ten acres converted from rural land to urban land.
Figure 18 shows us that of the aggregate 8,844,435 acres of rural land lost to sprawl between 2000 and 2010, 73 percent, or roughly 6,450,000 acres, were lost due to population increase. Only 27%, or roughly 2,000,000 acres, were lost due to the increase in per capita land consumption between 2000 and 2010.
Conclusions There is a broad correlation between population size and sprawl: generally, the larger a city or state’s population, the larger the land area it will sprawl across.
The positive (upward tilting toward the right) slope of the best-fit line means that as a state’s population increases, the area of built-up, developed land increases as well. This demolishes the whimsical notion entertained by some that there is no connection between population size or growth rates and environmental impact.
Although the pace of sprawl may have peaked in the late 1990s and early 2000s, as recently as the late 2000s and in all likelihood today as well, sprawl continues at a rate that exceeds that of even the 1980s and early 1990s.
At this pace, sprawl would continue to convert an additional 15 million acres (23,000 square miles) of agricultural land and wildlife habitat into built-up land every decade. By 2050, another 60 million acres (92,000 square miles) of rural lands will have been paved or covered with subdivisions, office parks, and commercial strips, at great cost to our agricultural potential, wildlife habitat, livability, and general environmental quality.
Smart growth efforts, higher gasoline prices, fiscal and budgetary constraints (limiting new road-building, for example), and the recession-inducing mortgage meltdown may have all played roles in slowing the rate of sprawl late in the first decade of this century. The extent to which any of these and still other unforeseen factors may affect the rate of sprawl in the coming decades is unknown and unpredictable.
In the West, water scarcity is also likely to restrict far-flung, never-ending development.
population growth, during the decade just passed (2000-2010), accounted for approximately 70-90% of sprawl; declining density or increasing per capita land consumption accounted for about 10-30%.
A central goal of Smart Growth is to preserve open space, farmland, natural beauty and critical environmental areas by preventing declining density. Thus, places where population density increases should be hailed as success stories. Between 2000 and 2010, there were 192 urbanized areas (39% of all UAs) whose density either remained the same or increased – in other words, their per capita land consumption remained constant or decreased. However, many of these cities still experienced significant sprawl, a couple of thousand square miles in total between 2000 and 2010.
No city better exemplifies this phenomenon than Portland, Oregon. Despite being lauded for its urban growth boundary (UGB), extensive light rail infrastructure, and high-density mixed-use developments, even Portland UA still sprawled outward an additional 50.4 square miles. The addition of 266,760 people during the decade was more than enough to wipe out the increased population density and cause the city area to swell by an additional 11%.
Salem, Oregon, whose urbanized area population grew by 14% from 2000 to 2010, and which has quickly become the second largest city in Oregon. The population grew by over 300,000 people, causing the Raleigh Urbanized Area to become more densely populated. But despite Raleigh’s drop in per capita acreage, its 63% increase in population caused it to sprawl out over 198.5 square miles in these 10 years. The drop in per capita land consumption can be explained by the efforts of city planners to tame sprawl by directing development toward certain centers within the Urbanized Area. These were not enough to prevent the construction of new suburban neighborhoods, the development of retail centers, and the creation of roads and highways to connect these sprawl products.
The decline of the steel industry left parts of the city abandoned as “brownfields”, driving residents to build outward into the suburbs.
Following the logic of this study’s findings it isn’t hard to conclude that even the most aggressive and well-intentioned policies promoting smarter growth, better urban planning, and higher residential densities cannot escape the immense population pressures facing many communities around our rapidly growing nation.
It seems as though even the best-intentioned and politically palatable urban planning policies, are only able to slow, not halt, Urban Sprawl. Using this approach, a given patch of open space beyond the existing periphery of a typical rapidly expanding city would fall to sprawl in ten years instead of seven, but fall to sprawl it would. Under Smart Growth alone, city boundaries will never stop devouring countryside.
Simply stated, the results of this study indicate that population growth has more than twice the impact on sprawl as do all other factors combined. Neglecting the population factors in the anti-sprawl fight would be to ignore more than two-thirds of the problem.
Local Influence on Sprawl
Local policy makers truly trying to curb sprawl in our cities have a number of policy actions to pursue. While most local officials see population growth as an indicator of the vibrancy and vitality of their respective communities, there is little evidence to suggest that unfettered population growth is any of those things. Well-known sprawl critic and urban planner Eben Fodor challenged this very notion in his 2010 study “Relationship between Growth and Prosperity in 100 Largest U.S. Metropolitan Areas.” Fodor’s study found that rapidly expanding metropolitan areas did not hold up well in terms of standard economic indicators such as unemployment, per capita income, and poverty rates in comparison with slower growing metropolitan areas. Yet, despite this, local officials and city planners continue to offer subsidies and tax breaks to attract new residents, investment and development. Many times these subsidies are born unfairly by existing residents, who see their property taxes rise and are stuck with the bill to pay for sprawling highways, new schools, water and waste water treatment, and energy grids farther from the urban core.
Sprawl in the Sunbelt, and especially the Southwest, is of particular concern because of the hot desert climates of many of these cities. Southwestern metropolises like Phoenix are some of the most energy intensive cities and their growth puts added pressure on already scant water resources. In order for cities to properly address sprawl, taxpayer subsidies need to be removed and the true costs of development need to be borne by those developing the land. Also, as Harvard economist Edward Glaeser suggests, the true social costs of activities such as driving should be paid for.
National Influence on Population Growth
Beyond the short term, local officials supportive of growth control can hope only to slow population growth in their jurisdictions if national population continues to increase by some 2.5 to 3 million additional residents each year. These 25-30 million additional Americans each decade will nearly all settle in some community, inevitably leading to additional sprawl as far and as long as the eye can see.
In essence there are only three sources of national population growth: native fertility (in conjunction with slowly increasing life spans), immigration, and immigrant fertility. We know the following about their contribution to long-term growth:
- Native fertility: At 1.9 births per woman, it remains below the replacement level of 2.1 and has not been a source of long-term population growth in the U.S since 1971.
- Immigration: The sole source of long-term population growth in the United States is immigration, due both to new immigrants (arriving at about four times higher than the “replacement level” where immigration equals emigration) and to immigrants’ fertility, which despite declines during the recession has remained well above replacement level.
Thus, long-term population growth in the United States is in the hands of federal policy makers. It is they who have increased the annual settlement of immigrants from one-quarter million in the 1950s and1960s to over a million since 1990. Until the numerical level of national immigration is addressed, even the best local plans and political commitment will be unable to stop sprawl. Any serious efforts to halt the loss of farmland and wildlife habitat must include reducing the volume of population growth, which requires lowering the level of immigrants entering the country each year
A far more sustainable immigration level would be the approximately half-million a year recommended in 1995 by the bi-partisan U.S. Commission on Immigration Reform, established by President Clinton and chaired by former Congresswoman Barbara Jordan.
This lower level of immigration at around 500,000 a year would drive far less sprawl than the present levels exceeding a million a year. But unless Americans decide to lower their birth rates to far below replacement level, the 500,000 a year would still drive considerable population growth and sprawl indefinitely.
That is why another federal commission recommended far greater reductions in immigration. The President’s Council on Sustainable Development in 1996 recommended that the United States stabilize its population in order to meet various environmental and quality-of-life goals, and it called for reducing immigration to a level that would allow for a stable population. At current just below-replacement native fertility rates, that would require a return down to at least the quarter-million level of immigration in the 1950s and 1960s.
The Population and Consumption Task Force of President Clinton’s Council on Sustainable Development concluded in 1996: “This is a sensitive issue, but reducing immigration levels is a necessary part of population stabilization and the drive toward sustainability.”46 The 2014 Pulse Opinion Research poll did not give voters a choice of 250,000, but 40% of voters chose the options of 100,000 or zero. The full results on “how many legal immigrants should the government allow each year” were: 7% – Two million 14% – One million 23% – Half a million 20% – 100,000 20% – Zero
A key way in which growth from immigration has a somewhat smaller effect on sprawl is the lower average income level and, thus, a lower consumption level of the average immigrant. But we found that an assumption about immigrants having less of an effect because they presumably prefer central cities to suburbs was false. The majority of immigrants now live in suburbs where the sprawl occurs.47 And the adult children of immigrants were found to be just as likely to shun living in core cities as the adult children of natives. In fact, the lower incomes were causing immigrants to move to the edges of cities and even to rural settlements beyond the cities to find cheaper housing.
On a local level, the sprawl pressures of population growth are similar regardless of where the new residents originate. But very few Urbanized Areas are likely to be able to subdue population growth and sprawl if the federal government continues policies that add around 20 million people to the nation each decade, all of whom have to settle in some locality. The reality – which can only be mitigated but not eliminated by good planning or Smart Growth – is that these localities all occupy lands that were formerly productive agricultural lands or irreplaceable natural habitats
References
FAO. 2015. Status of the World’s Soil Resources Main Report. Food and Agriculture Organization of the United Nations and Intergovernmental Technical Panel on Soils, Rome, Italy.
Leahy, S. 2018. 75% of Earth’s Land Areas Are Degraded. A new report warns that environmental damage threatens the well-being of 3.2 billion people. National Geographic.
USC. 2018. Table 4. Cumulative Estimates of the Components of Resident Population Change for the United States, Regions, States, and Puerto Rico: April 1, 2010 to July 1, 2018. United States Census.
Wikipedia. 2017. List of United States cities by population. Wikipedia.org.
5 Responses to Vanishing open spaces: population growth and sprawl in America