

Preface. Natural gas is finite, but aside from (pumped) hydropower, natural gas is the main way wind and solar are balanced now. Therefore, a tremendous amount of energy storage will be needed in the future as natural gas declines.
And get this: the piddly amount of energy storage batteries that exist are mainly being used for arbitrage types of services, not energy storage. Yet we will need days, weeks, even months of energy storage in the future.
Of the 4,231 TWh electricity in 2022, just 3.8 TWh was stored in batteries, equal to eight hours (EIA 2022), and most of that eight hours was used to keep the grid stable despite all the attempts by wind and solar to crash it with their intermittency, volatility, and unpredictability. Of the energy stored in batteries, 25% went to frequency regulation, 21% arbitrage, 17% ramping & spinning reserve, 12% to store excess wind and solar generation (67% of that in California), 8% voltage or reactive power support, 5% system peak shaving, and 9% for emergency backup storage and other services. Only 3% –14 minutes – went to storage to provide additional power to the grid. And while some of the batteries were paired with solar or wind, much of their charge came from natural gas and other non-renewable sources (EIA 2024 Battery storage in the U.S. 2023 Early release battery storage figures. U.S. Energy Information Systems. Figures 7, 8, 12 https://www.eia.gov/analysis/studies/electricity/batterystorage/).
The electric grid in California has come close to blacking out due to not enough energy storage several times due to lack of storage, despite producing so much renewable energy at times that it has to be curtailed. Especially solar power, which generates the most power when least needed mid-day and to a lesser extent with wind power (Werner 2022).
This can’t be fixed, energy storage can’t be scaled up, which I explain in my book When Trucks Stop Running: Energy and the Future of Transportation i.e. why battery storage and more transmission lines don’t scale (as well as in this post and other posts within energyskeptic).
The current total energy storage capacity of the US grid is less than 1%. What little capacity there is comes from pumped hydroelectric storage, which works by pumping water to a reservoir behind a dam when electricity demand is low. When demand is high, the water is released through turbines that generate electricity.
This study has quantified the energetic costs of 7 different grid-scale energy storage technologies over time. Using a new metric called “Energy Stored on Invested, ESOI”, they concluded that batteries were the worst performers, while compressed air energy storage (CAES) performed the best, followed by pumped hydro storage (PHS).
But unfortunately, pumped hydro and compressed air energy storage can only contribute a small amount of storage, because there are few places left to put dams and underground salt domes. Eventually, as fossil fuels decline, wind and solar power will need to provide at least 80% or more of the electric power, since biomass doesn’t scale up. Utility-scale electrochemical battery energy storage is essential to keeping the electric grid up in the future, not only to balance sudden surges and dips in intermittent power, but to provide at least a month of energy storage to provide for the seasonal nature of wind and solar, when neither is contributing power to the grid (Droste-Franke, B. 2015. Review of the need for storage capacity depending on the share of renewable energies in”Electrochemical energy storage for renewable sources and grid balancing”, Elsevier).
In figure 4 it’s clear that the only energy storage battery that could materially scale up for up to 12 hours of world electricity energy storage is a sodium sulfur battery (Zinc-bromine battery flow batteries could too, but these are not within 10 years of being commercial).
The conclusion of this paper is:
“Although many potential short- and long-term energy resources are available to society, the greatest endowments of renewable low-carbon electricity are wind and solar. However, they require load-balancing techniques to mitigate their intermittent and variable nature. Electrical energy storage will allow the use of electricity in renewable-sourced grids with the same demand-centric perspective that is provided today from fossil fuel-sourced grids. The energy capacity required is likely between 4 and 12 hours of average power demand. To build an energy storage infrastructure of this size will require materials and energy at amounts comparable to annual global production values. Unless the cycle life of electrochemical storage technologies is improved, their energy costs will prohibit their deployment. CAES and NaS show the greatest potential for grid storage at global scale. Unless the cycle life of electrochemical storage technologies is improved, their energy costs will prohibit their deployment as a load-balancing solution at global scale”.
I have a chapter in my book “When Trucks stop running” about energy storage batteries that covers this in greater detail. But to give you an idea of how far utility energy storage is from being able to store just one day of U.S. electricity generation (11.12 TWh), I used data from the Department of Energy (DOE/EPRI 2013) energy storage handbook “Electricity storage handbook in collaboration with NRECA”, to calculate the cost, size, and weight of NaS batteries capable of storing 24 hours of electricity generation in the United States. The cost would be $40.77 trillion dollars, cover 923 square miles, and weigh a husky 450 million tons.
Sodium Sulfur (NaS) Battery Cost Calculation:
- NaS Battery 100 MW. Total Plant Cost (TPC) $316,796,550. Energy
Capacity @ rated depth-of-discharge 86.4 MWh. Size: 200,000 square feet. - Weight: 7000,000 lbs, Battery replacement 15 years (DOE/EPRI p. 245).
- 128,700 NaS batteries needed for 1 day of storage = 11.12 TWh/0.0000864 TWh.
- $40.77 trillion dollars to replace the battery every 15 years = 128,700 NaS * $316,796,550 TPC.
- 923 square miles = 200,000 square feet * 128,700 NaS batteries.
- 450 million short tons = 7,000,000 lbs * 128,700 batteries/2000 lbs.
Using similar logic and data from DOE/EPRI, Li-ion batteries would cost $11.9 trillion dollars, take up 345 square miles, and weigh 74 million tons. Lead–acid (advanced) would cost $8.3 trillion dollars, take up 217.5 square miles, and weigh 15.8 million tons.
Below is the paper, and here are two other news sources that covered the story:
- Shwartz, M. March 5, 2013. Stanford scientists calculate the carbon footprint of grid-scale battery technologies. Stanford scientists have developed a novel way to calculate the energetic cost of building large batteries and other storage technologies for the electrical grid. Stanford Report.
- 10 March 2013. Stanford study quantifies energetic costs of grid-scale energy storage over time; current batteries the worst performers; they need to improve cycle life by 3-10x. GreenCarCongress.com
And there simply aren’t enough minerals on earth to make a transition to “renewables”:
- Antonio Turiel (2021) Some inconvenient questions: An open letter
- Simon P. Michaux (2021) The mining of Minerals and the Limits to growth video
Alice Friedemann www.energyskeptic.com Women in ecology author of 2021 Life After Fossil Fuels: A Reality Check on Alternative Energy best price here; 2015 When Trucks Stop Running: Energy and the Future of Transportation, Barriers to Making Algal Biofuels, & “Crunch! Whole Grain Artisan Chips and Crackers”. Podcasts: Crazy Town, Collapse Chronicles, Derrick Jensen, Practical Prepping, KunstlerCast 253, KunstlerCast278, Peak Prosperity
***
Barnhart, Charles J. and Benson, Sally M. January 30, 2013. On the importance of reducing the energetic and material demands of electrical energy storage. Energy Environ. Sci., 2013, 6, 1083-1092.
Two prominent low-carbon energy resources, wind and sunlight, depend on weather. As the percentage of electricity supply from these sources increases, grid operators will need to employ strategies and technologies, including energy storage, to balance supply with demand.
We quantify energy and material resource requirements for currently available energy storage technologies: lithium ion (Li-ion), sodium sulfur (NaS) and lead-acid (PbA) batteries; vanadium redox (VRB) and zinc-bromine (ZnBr) flow batteries; and geologic pumped hydroelectric storage (PHS) and compressed air energy storage (CAES). By introducing new concepts, including energy stored on invested (ESOI), we map research avenues that could expedite the development and deployment of grid-scale energy storage. ESOI incorporates several storage attributes instead of isolated properties, like efficiency or energy density. Calculations indicate that electrochemical storage technologies will impinge on global energy supplies for scale up — PHS and CAES are less energy intensive by 100 fold. Using ESOI we show that an increase in electrochemical storage cycle life by tenfold would greatly relax energetic constraints for grid-storage and improve cost competitiveness. We find that annual material resource production places tight limits on Li-ion, VRB and PHS development and loose limits on NaS and CAES. This analysis indicates that energy storage could provide some grid flexibility but its build up will require decades. Reducing financial cost is not sufficient for creating a scalable energy storage infrastructure. Most importantly, for grid integrated storage, cycle life must be improved to improve the scalability of battery technologies. As a result of the constraints on energy storage described here, increasing grid flexibility as the penetration of renewable power generation increases will require employing several additional techniques including demand-side management, flexible generation from base-load facilities and natural gas firming.
| Broader context
To increase energy security and reduce climate forcing emissions, societies seek to transition from fossil fuel based energy resources to renewable energy resources including wind and solar. However, an energy system based on renewable sources presents a host of challenges. Wind and solar resources vary with weather phenomena, yielding a variable and intermittent supply of energy. Electricity grid operators will need to employ several grid firming techniques including electrical energy storage. Building up energy storage for the power grid will require physical and financial resources. This study focuses on the energetic costs of storage. We calculate the energy and material demands on society required to build and maintain electrical energy storage capable of supplementing electricity generation mixes comprised primarily of wind and solar. We present a novel metric for comparing the energy performance of storage technologies: energy stored on energy invested (ESOI). This metric is especially useful because it combines several attributes of storage technologies that affect their energy costs, not just, for example, efficiency. Using ESOI, we map research and development avenues – primarily a 5 to 10 fold increase in cycle life – that will significantly reduce the energetic and material costs. Otherwise, the energetic cost of electrochemical storage technologies will preclude wide-scale adoption of grid-scale energy storage. Additionally, this work informs technology development and the planning of present and future energy systems. |
1 Introduction
Stable operation of the electric grid requires that the power supply instantaneously matches the power demand. Grid operators continually balance the energy demands of consumers by dispatching available generation.1 This complicated task will become even more demanding in the future. Driven by the need to reduce the emission of CO2 and increase energy security, policy makers have implemented and continue to implement measures requiring greater power generation to shift to low-carbon energy resources.2,3 Wind and solar power show great potential as low carbon sources of electricity, but they depend on the weather. Grid operators cannot employ these resources at their discretion.
As the percentage of power generation by variable sources grows, flexibility in power grid operation will become increasingly necessary.4,5 Without increased flexibility variable resources will be underutilized and suffer from lower capacity factors — the financially critical ratio of actual energy provided to potential based on name plate capacity. Reduced capacity factors drive up the levelized cost of electricity. Curtailment of variable resources increases as their percentage of the grid’s power supply climbs from 20% to 30%.6 Beyond 30%, sharp reductions in capacity factors occur without increases in system flexibility.7
Future grid operators will achieve flexibility by employing techniques that modulate the balance of supply and demand. Proposed techniques include: real-time adjustments of customer electricity use through demand side management; installing generation overcapacity and transmission resources; or decoupling the instantaneous match of supply and demand with energy storage. Large-scale storage maximizes generation utilization without affecting when and how consumers use electrical power.
Storage is an attractive load-balancing technology for several reasons. It increases grid reliability and decreases carbon emissions by reducing transmission load and allowing spinning power plants to operate at optimum efficiencies.4 Storage could provide grid flexibility in locations that have ambitious climate-change policies and relatively low-carbon electricity sources including natural gas combined cycle, hydroelectric and nuclear.8 Finally, storage provides ancillary grid services including regulation, volt–ampere reactive (VAR) power and voltage support.9
The benefits of grid-scale energy storage are clear. The question then is cost. How much energy must society consume to build and maintain grid-scale storage? Will material availability limit deployment? What will the financial cost be? Today, financial cost obstructs storage adoption, yet valuable insights concerning application and optimal scheduling continue to make inroads.9,10 In this paper we focus on physical costs: energy and materials.
Our analysis is presented as follows. First we identify reasonable storage capacities appropriate for future grids with high percentages of renewable power generation. Secondly, we calculate the embodied energy required to maintain operational storage worldwide. Here, we present a novel metric for quantitatively assessing the energetic performance of storage technologies: energy stored on energy invested (ESOI). Thirdly, we apply the methods of Wadia et al.11 and calculate material dependencies for grid-scale energy storage. Finally, we discuss implications of these energetic and material constraints on storage deployment and recommend research and development directions that could relax these constraints.
This study builds on several foregoing studies that consider the material constraints of battery technologies. The electrification of vehicles has led to careful consideration of the materials needed to produce an adequate supply of vehicle batteries.12–14 Here we extend their material analysis to grid-scale storage by adding additional technologies. Our principle contribution is the quantification and discussion of the energetic costs of grid-scale energy storage in the context of providing grid flexibility for variable resources.
1.1 Electrical energy storage at global scale
Energy storage devices establish and maintain reversible chemical, pressure or gravitational potential differences between the storage medium and local environmental equilibrium. The design of an energy storage device is motivated by its application. Engineers place emphasis on different attributes – cost, efficiency, weight, capacity, etc. For grid-scale applications energy density is less important than cost, safety, efficiency and longevity.
The total energy capacity of storage needed to provide flexibility in the future is an active area of future energy system scenario research and ranges from no storage required to up to three days.15,16 We draw our estimates from several authoritative studies that explore future generation mix scenarios that include up to 50–80% renewable resources11,15,17,18 (see ESI for details†). In the following analyses we use a narrower global storage capacity of 4 to 12 hours of world average power demand as a point of reference. This can be described as any equivalent time and power combination. For example, this is equivalent to the amount of energy needed to provide 1/2 of world electricity needs for 8 to 24 hours etc. It corresponds to an energy capacity of 8.4 to 25.3 TW h assuming present day average global power demand: 2.1 TW.19 For comparison, present day fossil fuel energy stores are over 15 times greater.‡ We use this range to ask, ‘how much material and energy will be required to build storage for this range of estimates?’ Will these requirements preclude or present challenges for storage technologies? Are there attributes of storage technologies that R&D efforts should focus on to reduce energetic and material requirements?
For this analysis, we only included current representative electrical energy storage technologies with a developmental stage of pilot, commercial or mature, that show promise of economic viability within a ten-year time frame.9 We selected three batteries, two flow batteries, and two geological storage technologies for analysis: lithium-ion (Li-ion), sodium sulfur (NaS), and lead-acid (PbA); vanadium redox (VRB) and zinc-bromine (ZnBr); and compressed air energy storage (CAES) and pumped hydroelectric storage (PHS). Several books and review papers describe these technologies at length.22–28
2 Calculations and results
2.1 Energetic requirements
Building storage devices requires energy for resource acquisition, transportation, fabrication, delivery, operation, maintenance and disposal. This requisite energy is its embodied energy. In this section we analyze the energy costs for storage technologies from three perspectives. The first compares initial energy costs of storage technologies. The second compares the energy costs for storage technologies over a 30 year period. The third presents a new metric, Energy Stored on Invested (ESOI), which has advantages over single parameter metrics, such as cost, efficiency or cycle-life.
We compare the energy costs of storage technologies by considering their cradle-to-gate embodied energy requirements. In a cradle-to-gate analysis, a specific Life Cycle Assessment (LCA) valuation, a technology’s use phase and disposal phase are omitted. We obtained these values for storage technologies from published LCA studies.13,29,30 A recent review of battery LCA by Argonne National Laboratory recognizes that battery LCA data often lack detailed energy and material flows in the best of cases.13 More commonly data is non-existent or decades out-of-date. We can, using these data, consider the implications of energy costs, obtain comparisons between technologies, and identify technology attributes that, if targeted by research, will lead to reductions in energy use in storage deployment. We converted values from study specific units to an embodied energy storage ratio, εgate — a dimensionless number that indicates the amount of embodied primary energy required for one electrical energy unit of storage capacity.
We obtained LCA data for technologies from three sources.13,29,30 Additional LCA data for materials were obtained from various reports and software databases.31–36 We truncate values to cradle-to-gate from studies that included cradle-to-grave analyses for consistency e.g. Denholm and Kulcinski, 2004.30 Values reported by Rydh and Sanden, 2005 (ref. 29) where in units of MJ primary fuel per kg of battery. These were converted from per kg to per MJ electricity capacity by assuming a practical energy density for electrochemical storage technologies (see Table 2).
Fig. 1A shows the cradle-to-gate embodied primary energy per unit of electrical energy capacity, εgate, in pink for grid-scale storage technologies. The embodied energy associated with materials and manufacturing are shown in blue and green boxes respectively. Median values for materials and manufacturing do not sum to median total εgate values because some studies only report total εgate and additional estimates for material embodied energy were obtained from LCA software databases and reports as described above. Electrochemical storage technologies require 3 to 7 times more energy per unit storage capacity than PHS and CAES. While it requires 694 units of energy to manufacture 1 unit of VRB storage capacity, it only takes 73 units for 1 unit of CAES capacity.
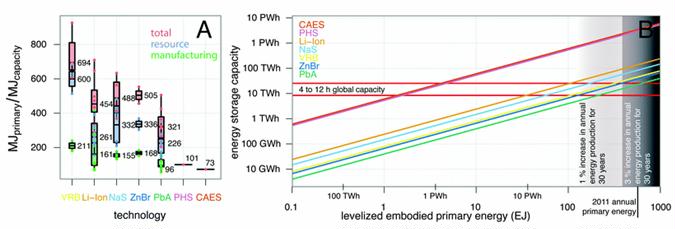
Fig. 1 Energy storage technologies require varying amounts of energy for manufacturing and for their production. (A) Cradle-to-gate primary embodied energy per unit of electrical energy storage capacity, ?gate, for storage technologies. (B) Levelized embodied energy required to build out grid-scale energy storage. Colored lines indicate the levelized embodied energy costs for storage technologies for a 30 years period as a function of capacity.
2.2 Levelized embodied energy
Selecting a storage technology based on static, up-front embodied energy costs alone is insufficient. Over time, cycle life (the number of times a technology can be charged and discharged) and efficiency greatly affect cumulative embodied energy requirements. Prior analysis led to two important findings: (a) technologies like PbA, whose energy requirements are dominated by production and transportation, are sensitive to cycle life and (b) technologies like Li-ion, NaS, VRB, ZnBr, PHS, CAES whose energy requirements are dominated by operation, are sensitive to round-trip efficiency.37 The energy cost will depend on the cycle life (λ) and round-trip efficiency (η) of storage technologies. The depth-of-discharge (D) modulates both cycle life and installation energy capacity size. A battery with a shallow D will require a larger installed capacity to provide a specified amount of energy storage. Table 1 shows attributes used for our analysis.
Table 1 Storage technology attributes affecting life-cycle energy requirements
| η | λ at depth-of-discharge (DOD) | ||||
| % | 100% | 80% | 33% | ε gate | |
| a Sources: ref. 23. b Sources: ref. 29. c Primary energy per unit electrical energy. | |||||
| Li-ion | 90 | 4000 | 6000 | 8500 | 454 |
| NaS | 75 | 2400 | 4750 | 7150 | 488 |
| PbA | 90 | 550 | 700 | 1550 | 321 |
| VRB | 75 | 2900 | 3500 | 7500 | 694 |
| ZnBr | 60 | 2000 | 2750 | 4500 | 504 |
| CAES | 70 | >25000 DOD indep. | 73 | ||
| PHS | 85 | >25000 DOD indep. | 101 | ||
A simple AC–AC round-trip η cannot be computed for CAES because it uses additional energy from natural gas used to heat the air as it leaves the storage cavity. By subtracting natural gas energy inputs and considering the differences in energy quality between natural gas and electricity, analysts report net electrical storage efficiencies between 66 and 71%.30,38 NaS and flow battery efficiencies are lower than other electrochemical technologies due to parasitic energy losses associated with thermal management and pumps.23
For nearly all electrochemical storage technologies, cycle life depends on the operating temperature and the depth of discharge. This is due to the kinetic behavior of chemical reactions. Rydh and Sanden 2005 (ref. 29) provides a table that shows cycle-life ranges for three different depths of discharge: 33%, 80% and 100%. Linden, 2010 (ref. 23) describes in detail the relationship between kinetics and cycle life for electrochemical storage technologies. Here, we assume the optimum operating temperature and select the depth of discharge and coupled cycle life that minimizes the levelized energy consumption (italic font in Table 1).
We calculate a levelized embodied energy for storage technologies as follows:
where tday is the number of days operating per year (365), and T is the levelization period in years. We assume EES technologies are replaced entirely and that recycling is not significant due to rapid deployment and scale up. Recycling would likely reduce the εgate preferentially for technologies with shorter cycle life, but this effect was not quantified here. PbA’s low εgate might be attributed to extensive present day recycling of automotive batteries.39 The normalization factor incorporating cycle life is rounded up to the next integer. Similar to levelized cost of electricity (LCOE) studies, we select a levelization period of 30 years.40
The solid lines in Fig. 1B, correspond to storage technologies and show the LEembodied (x-axis) required to build and maintain storage capacity (y-axis). The horizontal red lines indicate the world energy storage capacity reference of 4 to 12 hours of average power demand. Once a line has entered into the shaded regions the storage capacity as indicated by they-axis will require 1% and 3% of today’s global primary energy production to manufacture and maintain storage devices assuming a 30 years levelization period. Electrochemical storage technologies require 10 to 100 times more embodied energy for a given energy capacity than geological storage technologies.
2.3 Energy stored on invested
| The levelized embodied energy calculation is useful for estimating the energy required to build grid-scale storage, but it suffers from biases introduced by assuming a levelization period and operational hours per year or a capacity factor. Motivated by energy returned on invested (EROI) analysis,41 we present a new formula that avoids these biases: energy stored on invested (ESOI). ESOI is the ratio of electrical energy stored over the lifetime of a storage device to the amount of primary embodied energy required to build the device: | |
| (2) |
where D, the depth-of-discharge, modulates the energy stored. Fig. 2 shows the ESOI for load-balancing storage technologies. It contrasts with the static cradle-to-gate energy costs shown in Fig. 1A. Over their entire life, electrochemical storage technologies only store 2–10 times the amount of energy that was required to build them.
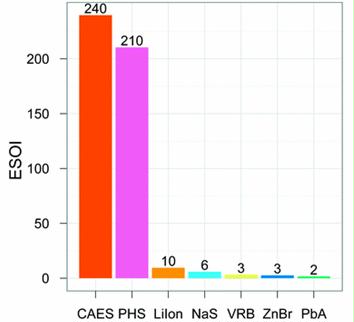
Fig. 2 A bar plot showing ESOI, the ratio of total electrical energy stored over the life of a storage technology to its embodied primary energy. Higher values are less energy intensive.
2.4 Material resource requirements
In addition to energy costs, storage technologies require material resources. Several prior studies have estimated the material requirements for energy storage.12–14 The principal contribution of this study is quantifying the energetic requirements of energy storage. Materials are a second physical cost and we conducted our own analysis in order to discuss the implications these material requirements have on the time required to scale energy storage for load-balancing renewable resources in future energy systems.
Consider the elemental constituents of storage technologies. Fig. 3A–C show how global annual production, price and specific embodied energy vary with the mass fraction of elements in the Earth’s lithosphere.§ The top plot shows the total mass of elements produced annually worldwide in metric tonnes (1000 kg). The specific value is the 5 years annual average from 2006 to 2011.33 The colors of the plotted data correspond with the storage technology that each element supplies. The middle plot denotes price of elements in U.S. dollars per kg. The bottom plot shows the amount of embodied energy per kg of element acquisition is required using today’s extraction and purification techniques. The amount of energy required to extract and process a kg of material depends on its chemical form in the lithosphere. We obtained LCA data for elements from LCA studies, consultant firms and software packages: Li;31,32 Co;33 Na;34 S;35 Pb;31,34 V;32,36 Zn.31,34
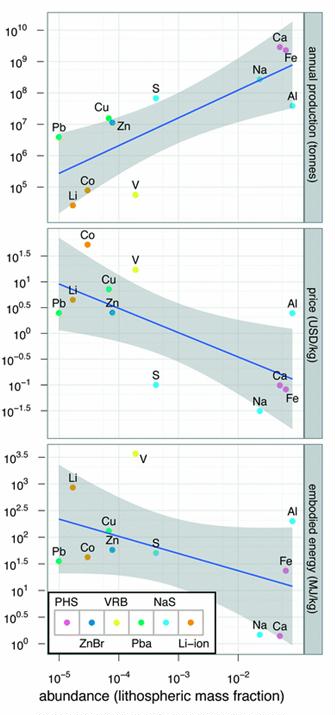
Fig. 3 Energy storage technologies depend on the availability of critical materials and geologic resources. Lithospheric abundance of critical elements loosely correlates with resource production (A), price (B) and embodied energy (C). The blue lines represent a simple linear regression with grey envelopes outlining a confidence interval of 0.95
The relative abundance of technology specific elements in the earth’s crust does not necessarily indicate their ability to be mined and produced, but it provides an initial assessment of material limits faced by certain technologies.42,43 For example, sulfur, the limiting electrochemical agent for NaS, is over 40 times more abundant than lead, the limiting agent for PbA. In general, annual production increases with lithospheric abundance and price decreases. Considering annual production alone, NaS manufacturing has advantages over VRB manufacturing due to an in-place production infrastructure that produces over 1000 times more requisite material.
2.5 Energy storage potential of resources
How much energy can a critical material or resource store? The energy storage potential (ESP) estimates the energy capacity of a storage technology’s critical resources.11,37 In this case, the ESP is limited by one of the two elements or molecules of the battery cell’s electrochemical couple: , where ρ is the theoretical energy density, M is mass of limiting material available, and mf is the mass fraction within the electrochemically active materials with corresponding ρ. Table 2 lists parameters used in ESP calculations. For ESP calculations, several assumptions and caveats were made:
Table 2 Electrochemical storage technology properties
| Technology | Reactants | m f | ρ theoretical (ρpractical) |
| a Sources: All information from ref. 23 unless otherwise noted.48 | |||
| Li-ion (cylindrical spiral-bound) | LixC6 | Li 0.04 | 448 W h kg−1 |
| Li1−xCoO2 | Co 0.35 | -200 | |
| NaS (NGK-Tepco) | 2Na + xS | Na 0.42 | 792 |
| (x = 5 − 3) | S 0.58 | -170 | |
| PbA (prismatic) | Pb + PbO2 | Pb 0.93 | 252 |
| H2SO4 | -35 | ||
| VRB | V(SO4) | V 0.31 | 167a |
| VO2(HSO4) | (30a) | ||
| ZnBr | Zn + Br2 | Zn 0.29 | 436 |
| Br 0.71 | -70 | ||
- We only considered materials that constitute the storage medium. There may be other resources, rare-earth elements for example, that play a key role in a storage technologies operation. The U.S. Department of Energy has identified elements critical for energy storage in “Critical Materials Strategy”.44This report indicates that some battery technologies, NiMH for example, use a cathode material designated as AB5, where A is typically rare earth mischmetal containing lanthanum, cerium, neodymium and praseodymium.44
- The reserve base is an estimate based on measured or indicated amounts of minerals including minerals that are marginally economical and sub-economical to extract as defined by the USGS MCS report.33If a material is in low demand then reserve bases will likely be underestimates of resource availability.
- The theoretical energy density is based on the active anode and cathode materials only. In practice, batteries only realize 25% to 35% of their theoretical energy density because of necessary inactive components.23Necessary components including electrolytes, containers, separators, current collectors and electrodes add mass and volume to the battery which reduces energy density.
- CAES and PHS require cement and steel for construction; they are not materially limited. The embodied energy associated with acquiring steel will limit its acquisition well before limits in the physical material availability of iron and carbon in the lithosphere. However, they do require unique geological formations. A thorough estimate for national or worldwide PHS potential has yet to be made. The U.S. Energy Information Agency (EIA) and the U.S. Department of the Interior estimate remaining U.S. pumped hydro storage capacity at ten times present day levels.45,46These studies are conservative in that they do not consider coastal PHS. Considering these studies, we conservatively assume that the world has at least ten times present day pumped hydro capacity: 102 GW h × 10 = 1 TW h.
- For CAES we estimate the ESP by considering locations identified for carbon dioxide sequestration and the energy density of compressed air: ESP = ρCAES× V, where Vis the reservoir volume. The volumetric energy density, ρCAES, of compressed air of atmospheric composition increases almost linearly with reservoir pressure.38 Existing CAES plants, for example Huntorf, have variable reservoir pressures of 60 bars and energy densities between 3 and 5 kW h m−3. We assume hydrostatic reservoirs in underground aquifers at depths greater than 500 m and an energy density ρCAES = 5 kW h m−3. The global volume estimates for CO2 sequestration for depleted oil and gas reservoirs and saline aquifers are 2 × 10¹²m3 and 7.9 × 10¹² m3 respectively.47
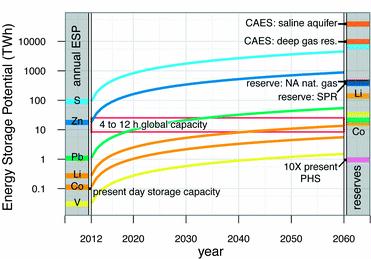
Fig. 4 shows the ESP for grid-scale storage technologies. The shaded section on the left shows the ESP for EES limiting materials based on their annual production (colored bars). Using Pb as an example, if the entire annual production of lead was used to create PbA batteries, the total energy storage capacity would be 1.1 TW h or about 2% of the average world daily electricity demand. Sulfur, if used entirely for NaS manufacturing, would yield nearly 1000 times greater energy storage capacity. The main section of Fig. 4 shows ESP as a function of time (x-axis) assuming linear growth. This provides an estimate for the time required for a storage technology to reach an energy storage capacity goal of 4 to 12 hours (red horizontal lines). The shaded region on the right shows ESP as a function of economically viable reserve estimates or as a function of conducive geologic formations. Traditionalfossil fuel storage reserves are shown as reference (see footnote‡).
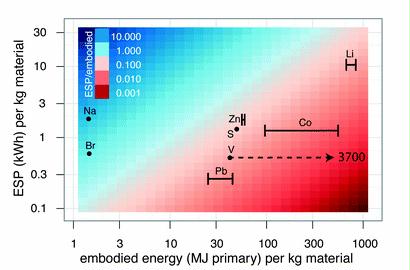
Fig. 5 compares the embodied energy required to obtain a kg of various elements to the ESP of a kg of those elements. Assuming that the energy required to manufacture battery technologies are comparable, elements with a higher ESP/embodied ratio, like Na and Br, are less energy intensive.
Discussion
Researchers have identified capital and levelized cost points that permit profitable avenues for storage.9,49,50 In response, industry and academia currently focus on developing inexpensive storage technologies. However, by asking the simple question, “Will energy and material costs limit the ability of storage to provide load-balancing for the electrical grid?”, we identify other critical criteria that must be addressed to achieve sufficient and rapid scale up of the storage industry. Storage adds infrastructure and necessarily increases material and energy demands. Society’s ability to accommodate these demands will dictate the maximum quantity and rate of storage deployment. Other energetic, material and land use constraints may limit renewable energy production technologies, precluding the need for massive grid-scale energy storage, and such studies are needed.
3.1 On energetic costs
Comparing εgate for storage technologies in Fig. 1A leads to two general conclusions. First, technologies that use readily available, inexpensive and abundant materials like air or waterrequire much less embodied energy than technologies that require rare elements mined from the earth. Second, older technologies like PbA contain less embodied energy associated with manufacturing than newer technologies like VRB because they benefit from progression and advancements in their production and manufacturing ‘learning-by-doing’ that also leads to reductions in financial costs.
Consider the levelized embodied energy costs over a 30 years time frame shown in Fig. 1B. PbA, the most demanding technology, requires over 1.5 years of worldwide primary energy demand to create 12 h of storage. Even if this demand was to be spread out over the next 30 years, the world would need to produce 5% more energy just to build PbA storage. This is doable, but would require sustained and cooperative efforts from government and industry. Less energy would be available for other uses. If we want to limit the amount of energy needed to build storage systems then we need to start building it now and continue for a long time. Alternatively, if we can rely on CAES and PHS, then energy requirements will not be a limitation and it could be built more quickly. Developing electrochemical technologies with comparable levelized embodied energy values to CAES and PHS would be immensely beneficial.
The most effective way a storage technology can become less energy intensive over time is to increase its cycle life. This suggests that the current R&D focus on reducing costs is not necessarily sufficient to create a scalable energy storage infrastructure. Instead, the focus needs to be on identifying energy storage options with much lower levelized energy costs – comparable to PHS and CAES. Granted, the accuracy of the LCA data could be greatly improved. Case studies for cycle life data, efficiency and depth-of-discharge should be sought to augment the highly generalized data presented here. The general implications would not change however. Unless cycle life is increased by a factor of 3 to 10 and embodied energy costs are reduced, the amount of storage required to provide load-balancing for significant fractions of renewable generation will tax societies’ energy systems.
The ESOI ratio compares the cumulative amount of energy stored to the embodied energy cost. Whereas CAES and PHS store >100 times more energy over its life than the energy required to build them, PbA’s low cycle life (300) leads to a poor ESOI ratio of 2. All of the electrochemical storage options have low ESOI ratios. CAES and PHS likely have higher ESOI values than those calculated here given our conservative cycle life estimate of 25,000. Ranked from least to most limited by energetic requirements, the technologies considered here are as follows: CAES, PHS, Li-ion, NaS, VRB, ZnBr, PbA.
A singular focus on improving storage efficiency misses the greatest opportunity for reducing the amount of energy required by storage technologies. We should not only consider the energy dissipated with every cycle due to inefficiencies, but the energy required, up-front, for manufacturing the technology. The total energy per unit capacity lost due to inefficiencies over the lifetime of a technology depends on the total number of cycles, λ, and the efficiency, η: εη = (1 − η)λ. For all electrochemical storage technologies, the up-front energy cost, εgate/D, dominates the energy budget (cf.Table 1). As a superior metric, ESOI includes all of these terms in a meaningful and intuitive way that quantitatively assesses the energy performance of storage technologies.
3.2 On material resource costs
Developing storage technologies that use Earth-abundant materials with high annual production rates like Na, S and Zn is not only practical, but the production infrastructure is already in place. All electrochemical storage technologies considered here besides NaS will require a significant portion of their active resources’ annual production. For example, one can estimate from Fig. 4 that about 3 days of Na production yields the ESP equivalent of 1 year of Pb production and 10 years of Co production. If battery manufacturing rates were to increase rapidly over the next half century, demand for these materials would increase greatly. Likely, this would encourage mining industry R&D and resource exploration efforts, increasing the amount of economically viable reserves.51 The challenge will be in the extraction of storage critical resources. For an individual technology to reach 12 hours of capacity, annual production by mass will need to double for lead, triple for lithium, and increase by a factor of 10 or more for cobalt and vanadium. This will drive up the price of these commodities.
Geologic storage, in particular CAES, faces negligible material limits. The challenge for geologic energy storage is finding suitable sites that accommodate not only technical requirements, but environmental considerations as well. Ranked from least to most limited by material availability, the technologies considered here are as follows: CAES, NaS, ZnBr, PbA, PHS, Li-ion, VRB.
3.3 Proposed technology targets
Although our results identify major challenges for EES at grid-scale, they, more importantly, indicate research directions that will loosen storage material and energy constraints. The ESOI of storage technologies depends linearly on their efficiency, depth-of-discharge, embodied energy and cycle-life (eqn (2)). Consider the current range and theoretical limits on these parameters. Fig. 6 shows how ESOI varies with efficiency, cycle life and embodied energy. With this framework efficiency and depth-of-discharge can be increased at most by about 25–33% or a factor of 1/4 to 1/3. What about εgate? Using current and developing new low-energy extraction techniques and reducing energy costs in manufacturing through efficiencies gained by learning, we anticipate that embodied energy costs could be reduced at most by a factor of 2 to 3.
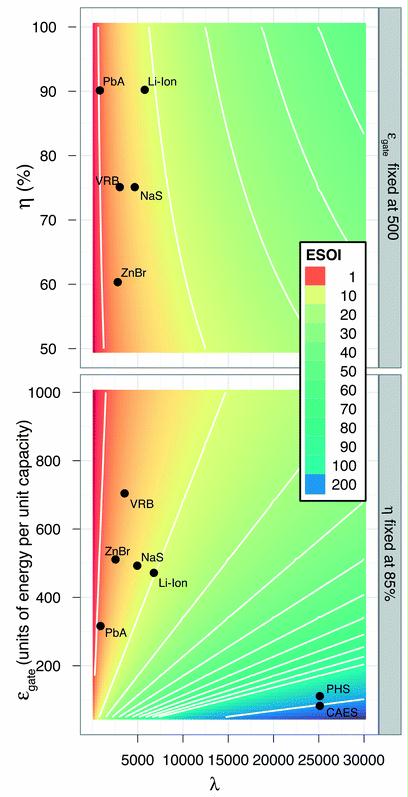
Fig. 6 Two contour plots show how ESOI depends on cycle life (x-axis), efficiency (y-axis of upper plot) and embodied energy (y-axis of lower plot).
The third parameter in eqn (2), cycle life, has a range for current technologies from <1000 to >25,000, a factor of 25. Clearly then, the greatest potential for increasing the ESOI for storage technologies lies with a R&D focus on extending cycle life. Ongoing research may push cycle life for some technologies including lead-acid beyond 40,000.52 The lower plot of Fig. 6 implies that at high cycle life values >15,000, reductions in εgate provide the greatest increase in ESOI. PHS has very high cycle life and low εgate. Limited by geologic setting, further PHS development would benefit from research into plant component resistance to harsh salt water environments. This would permit robust, long-lasting PHS at coastal locations.
Much energy storage research currently focuses on high specific energy density (W h kg−1).53,54 This quality is very important for electric vehicles and portable electronics. Cycle life is less of a concern in these applications because batteries in portable electronics and vehicles lack market drivers to outlive these goods. For grid scale applications, energy density is not limiting (see ESI, spatial footprint†). Based on ESOI calculations, EES research should focus on making robust and long-lived storage devices, extending cycle life. The less frequently a storage technology needs to be decommissioned, recycled and built anew, the less energy and material resources will be required to maintain capacity.
3.4 Concluding remarks
Although many potential short- and long-term energy resources are available to society, the greatest endowments of renewable low-carbon electricity are wind and solar. However, they require load-balancing techniques to mitigate their intermittent and variable nature. Electrical energy storage will allow the use of electricity in renewable-sourced grids with the same demand-centric perspective that is provided today from fossil fuel-sourced grids. The energy capacity required is likely between 4 and 12 hours of average power demand. To build an energy storage infrastructure of this size will require materials and energy at amounts comparable to annual global production values. Unless the cycle life of electrochemical storage technologies is improved, their energy costs will prohibit their deployment. CAES and NaS show the greatest potential for grid storage at global scale. Unless the cycle life of electrochemical storage technologies is improved, their energy costs will prohibit their deployment as a load-balancing solution at global scale.
EES will not play a singular role in providing flexibility for power grids supplied by renewable resources. Given the high energy costs and necessary increases in material production introduced by storage, grid-operators should employ other techniques in concert. Integrating storage technologies, demand-side management including smart-grid applications, and most likely natural gas firming generation resources should prove to be a challenging yet rewarding goal that will ultimately greatly reduce carbon emissions and increase grid reliability and security.
Acknowledgements
This work was conducted by Stanford University’s Global Climate and Energy Project (GCEP). We greatly appreciate the support GCEP’s sponsors provided (http://gcep.stanford.edu).
Related Articles
- Who Killed the Electric Car?
- Making the most energy dense battery from the palette of the periodic table
- Diesel is finite. Trucks are the bedrock of civilization. So where are the battery electric trucks?
- Heavy-duty hydrogen fuel cell trucks a waste of energy and money
- All Electric Trucks. Probably not going to happen. Ever. Why not?
- Hybrid electric trucks are very different from HEV cars
- Electric truck range is less in cold weather
- Roger Andrews: California public utilities vote no on energy storage
- Electric Grid Energy Storage
- Would Tesla, li-ion batteries, SolarCity or SpaceX exist without $4.9 billion in government subsidies?
- Electric vehicle overview
- What is the life span of a vehicle Lithium-ion Battery?
- EPA LCA study lithium-ion battery environmental impact, energy used, recycling issues
- Bloomberg News: Tesla’s new battery doesn’t work that well with solar
- Renewable Energy can’t supply more than 30% of electricity without revolutionary battery breakthrough
- Revolutionary understanding of physics needed to improve batteries – don’t hold your breath
- American Physical Society: has the Battery Bubble Burst?
- Batteries are made of rare, declining, and imported minerals
- Battery energy density too low to power cars
- Notes from “The Powerhouse: Inside the Invention of a Battery to Save the World” by Steve LeVine
- Why aren’t there Battery Powered Airplanes?
References of paper
- (CAISO) California Independent Service Operator, ‘Integration of Renewable Resources: Operational Requirements and Generation Fleet Capability at 20% RPS’, California ISO, 2010.
- F. Pavley and F. Nunez, California Assembly Bill No. 32-Global Warming Solutions Act of 2006, 2006, http://www.arb.ca.gov/cc/docs/ab32text.pdf Search PubMed .
- CARPS, California Codes: Public Utilities Code. Section 399.11–399.31. California Renewables Portfolio Standard Program, 2009, http://www.leginfo.ca.gov/cgi-bin/calawquery?codesection=puc, accessed 27 May 2012 Search PubMed .
- P. Denholm and R. M. Margolis, Energy Policy, 2007, 35, 4424–4433 CrossRef .
- P. Denholm, E. Ela, B. Kirby and M. Milligan, NREL Technical Report, 2010, NREL/TP-6A, p. 61 Search PubMed .
- D. Corbus, D. Lew, G. Jordan, W. Winters, F. Van Hull, J. Manobianco and B. Zavadil, IEEE Power Energ. Mag., 2009, 7, 36–46 Search PubMed .
- P. Denholm and R. M. Margolis, Energy Policy, 2007, 35, 2852–2861 CrossRef .
- (CCST) California Concil on Science and Technology, California’s Energy Future – The View to 2050, Summary Report, California council on science and technology technical report, 2011 Search PubMed .
- D. Rastler, Electricity Energy Storage Technology Options: A White Paper Primer on Applications, Costs, and Benefits, Electric power research institute technical report, 2010 Search PubMed .
- E. Barbour, I. a. G. Wilson, I. G. Bryden, P. G. McGregor, P. a. Mulheran and P. J. Hall, Energy Environ. Sci., 2012, 5, 5425 Search PubMed .
- C. Wadia, P. Albertus and V. Srinivasan, J. Power Sources, 2011, 196, 1593–1598 CrossRef CAS .
- B. A. A. Andersson and I. RÃde, Transport Res. Transport Environ., 2001, 6, 297–324 CrossRef .
- J. L. Sullivan and L. Gaines, A Review of Battery Life-Cycle Analysis: State of Knowledge and Critical Needs ANL/ESD/10-7, Argonne national laboratory technical report, 2010 Search PubMed .
- M. F. Ashby and J. Polyblank, Granta Teaching Resources, 2012, 2, 38 Search PubMed .
- C. Augustine, R. Bain, J. Chapman, P. Denholm, E. Drury, D. Hall, E. Lantz, R. Margolis, R. Thresher, D. Sandor, N. Bishop, S. Brown, G. Cada, F. Felker, S. Fernandez, A. Goodrich, G. Hagerman, S. Heath, G. ONeil and K. Paquette, ‘Renewable Electricity Futures Study: Volume 2 Renewable Electricity Generation and Storage Technologies’, NREL TP-6A20-52409-2, 2012, vol. 2.
- D. MacKay, Sustainable Energy – Without the Hot Air, UIT Cambridge Limited, Cambridge, illustrate edn, 2009, vol. 78, p. 384 Search PubMed .
- P. Denholm and M. Hand, Energy Policy, 2011, 39, 1817–1830 CrossRef .
- M. Hand, S. Baldwin, E. DeMeo, J. Reilly, T. Mai, D. Arent, G. Porro, M. Meshek and D. Sandor, ‘Renewable Electricity Futures Study’, NREL TP-6A20-52409, 2012.
- IEA, Key World Energy Statistics, International energy agency technical report, 2010 Search PubMed .
- USDOE, Strategic Petroleum Reserve Annual Report for Calendar Year 2010 DOE/FE – 0545, United States Department of Energy Technical Report, November, 2011 Search PubMed .
- EIA, Underground Natural Gas Storage Capacity, Form EIA-191M and Form EIA-191A, U.S. energy information administration technical report, 2012 Search PubMed .
- S. M. Schoenung, Characteristics and Technologies for Long- vs. Short-Term Energy Storage. A Study by the DOE Energy Storage Systems Program SAND2001-0765, Sandia National Laboratories, U.S. Dept. of Energy Technical Report, March, 2001 Search PubMed .
- T. Reddy and D. Linden, Linden’s Handbook of Batteries, McGraw-Hill Prof Med/Tech, 4th edn, 2010, p. 1200 Search PubMed .
- R. A. Huggins, Energy Storage, Springer, New York, 1st edn, 2010, p. 400 Search PubMed .
- F. S. Barnes and J. G. Levine, Large Energy Storage Systems Handbook, CRC Press, Boca Raton, FL, 1st edn, 2011, p. 244 Search PubMed .
- Y.-F. Y. Yao and J. T. Kummer, J. Inorg. Nucl. Chem., 1967, 29, 2453–2475 CrossRef CAS .
- R. H. Radzilowski, Y. F. Yao and J. T. Kummer, J. Appl. Phys., 1969, 40, 4716 CrossRef CAS .
- S. Succar, Large Energy Storage Systems Handbook, CRC Press, Boca Raton, FL, 2011, ch. 5, pp. 111–153 Search PubMed .
- C. Rydh and B. Sandén, Energy Convers. Manage., 2005, 46, 1957–1979 CrossRef CAS .
- P. Denholm and Kulcinski, Energy Convers. Manage., 2004, 45, 2153–2172 CrossRef CAS .
- P. G. Hammond and C. Jones, Proc. Instn Civil. Engrs: Energy, 2008, 161, 4434–4443 Search PubMed .
- ESU-services, Abstract of LCIs, 2010, http://www.esu-services.ch/data/abstracts-of-lcis/ Search PubMed .
- USGS, Mineral Commodity Summaries, U.S. geological survey technical report, 2011 Search PubMed .
- Gabi, Gabi Software, Gabi 5, PE International, 2012 Search PubMed .
- R. T. Struck, M. D. Kulik and E. Gorin, Consolidation Coal Company, 1969 Search PubMed .
- P. Merier and G. Kulcinski, Life-Cycle Energy Cost and Greenhouse Gas Emissions for Gas Turbine Power, Fusion Technology Institute, University of Wisconsin-Madison Technical Report, December, 2000 Search PubMed .
- C. J. Rydh and B. a. Sandén, Energy Convers. Manage., 2005, 46, 1980–2000 CrossRef CAS .
- S. Succar and R. Williams, Compressed Air Energy Storage: Theory, Resources, and Applications for Wind Power Acknowledgments, Princeton Environmental Institute, Energy Systems Analysis Group Technical Report, April, 2008 Search PubMed .
- D. R. Wilburn and D. A. Buckingham, U.S. Geological Survey Scientific Investigations Report, 2006, p. 9 Search PubMed .
- G. M. Masters, Renewable and efficient electric power systems, John Wiley & Sons, Hobokon, NJ, illustrate edn, 2004, p. 654 Search PubMed .
- C. A. S. Hall, C. J. Cleveland and R. K. Kaufmann, Energy and Resource Quality: The Ecology of the Economic Process, Wiley Interscience, 1986, p. 602 Search PubMed .
- P. C. K. Vesborg and T. F. Jaramillo, RSC Adv., 2012, 15 Search PubMed .
- W. M. Brown, The Meaning of Scarcity in the 21st Century: Drivers and Constraints to the Supply of Minerals Using Regional, National and Global Perspectives Volume IV Sociocultural and Institutional Drivers and Constraints to Mineral Supply, U.S. geological survey open-file report 02–333 technical report, 2002 Search PubMed .
- D. Bauer, D. Diamond, J. Li, D. Sandalow, P. Telleen and B. Wanner, U.S. Department of Energy Critical Materials Strategy, U.S. Dept. of Energy Technical Report, December, 2010 Search PubMed .
- OECD/IEA, Renewable Energy Essentials: Hydropower, International Energy Agency Technical Report Figure 2, 2010 Search PubMed .
- USBR, Hydropower Resource Assessment at Existing Reclamation Facilities, United States Department of the Interior, Bureau of Reclamation, Power Resources Office Technical Report, March, 2011 Search PubMed .
- S. Benson, P. Cook, J. Anderson, S. Bachu, H. Nimir, B. Basu, J. Bradshaw, G. Deguchi, J. Gale, G. Goerne, W. Heidug, S. Holloway, R. Kamal, D. Keith, P. Lloyd, P. Rocha, B. Senior, J. Thomson, T. Torp, T. Wildenborg, M. Wilson, F. Zarlenga, D. Zhou, M. Celia, B. Gunter, J. King, E. Lindegerg, S. Lombardi, C. Oldenburg, K. Pruess, A. Rigg, S. Stevens, E. Wilson and S. Whittaker, IPCC Special Report on Carbon Dioxide Capture and Storage, Intergovernmental Panel on Climate Change, Cambridge, U.K., 2005, ch. 5 Search PubMed .
- I. Scott and S.-H. Lee, Large Energy Storage Systems Handbook, CRC Press, Boca Raton, FL, 2011, ch. 6, pp. 153–181 Search PubMed .
- M. Kintner-Meyer, P. Balducci, C. Jin, T. Nguyen, M. Elizondo, V. Viswanathan, X. Guo and F. Tuffner, Energy Storage for Power Systems Applications: A Regional Assessment for the Northwest Power Pool (NWPP), Pacific Northwest National Laboratory (PNNL), Battelle, United States Department of Energy Technical Report, April, 2010 Search PubMed .
- J. Eyer and G. Corey, Energy Storage for the Electricity Grid: Benefits and Market Potential Assessment Guide. A Study for the DOE Energy Storage Systems Program, February, 2010 Search PubMed .
- M. W. Hitzman, 2002, 24, 63–68.
- C. D. Wessells, R. a. Huggins and Y. Cui, Nat. Commun., 2011, 2, 550 CrossRef .
- M. Armand and J.-M. Tarascon, Nature, 2008, 451, 652–657 CrossRef CAS .
- J. Goodenough and M. Buchanan, Basic research needs for electrical energy storage, U.S. Department of Energy, Office of basic energy science technical report, 2007 Search PubMed
References from preface
Werner E (2022) California is awash in renewable energy — except when it’s most needed. The state has moved quickly to increase solar power, but can’t store it all for peak demand hours. The Washington Post. https://www.washingtonpost.com/us-policy/2022/09/21/california-is-awash-renewable-energy-except-when-its-most-needed/
| Footnotes |
| † Electronic supplementary information (ESI) available: Storage capacity estimates, spatial footprint calculations and results. See DOI: 10.1039/c3ee24040a |
| ‡ Strategic Petroleum Reserve: Large fossil fuel energy stores include the U.S. strategic petroleum reserve (SPR) and the North American underground natural gas storage network. The SPR stores 695.9 million bbl of oil (390 TW he) as of April 20, 2012 for emergency use.20 Underground natural gas storage is used to meet seasonal demand variations in natural gas use. Storage capacity of U.S. working gas (the total stored gas minus the cushion gas required to maintain pressure) has varied between 1600 and 3800 billion cf. (426 TW he) between 2006 and 2011.21 To convert these fossil fuel stores of energy to W he, we assumed that a bbl of oil and a cf. of gas contains 5.78 × 10⁶ and 1055 BTU of energy respectively. We assume a conservative conversion efficiency from thermal energy (BTU) to electrical energy (kW h) of 33%. |
| § Lithospheric abundance data obtained viaref. 42. Geochemistry and fossil fuel consumption segregate Co, S and V as outliers. Cobalt naturally exists in mineral compounds usually extracted as co-products of nickel and copper mining.33 Isolating pure cobalt from various mineral ores is an expensive process. Today sulfur is obtained as an undesired by-product of oil and gas refining. Currently, sulfur is in oversupply which leads to stockpiling and a suppressed market price.33 The available supply of vanadium is uncertain because, presently, vanadium is primarily recovered as a by-product or co-product of mining and coal, crude oil, and tar sand refining.33 Vanadium is a unique case: it is obtained as a waste material from smelters and oil refineries. LCA analysis for vanadium varies significantly from 43 MJ to 3711 MJ per kg depending on whether vanadium is consider a primary product or a by-product.32,36 |
18 Responses to Utility scale energy storage doesn’t scale up: limits to minerals and geography