
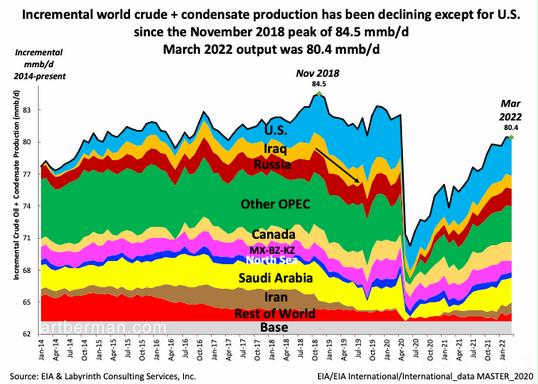
Peak oil is here! Note Russian oil decline not shown here. Source: Art Berman
Last updated 2022-6-24
Preface. Below are overviews of peak oil, coal, and natural gas, each followed by additional reading material from my book “When Trucks Stop Running: Energy and the Future of Transportation”, which explains why we are unlikely to be able to electrify transportation, or run trucks on anything else besides diesel, and why the electric grid will come down for good when there’s no natural gas to balance wind and solar as well as provide peak power.
And my book Life After Fossil Fuels: A Reality Check on Alternative Energy explains why the manufacturing of cement, steel, smelting of metals, glass, microchips, ceramics and more requires the high heat of fossil fuels to reach up to 3200 F, which can’t be electrified, run on hydrogen or anything else (see chapter 9). Worse yet, even if there were an existing commercial solution, which there isn’t, we are out of time to replace fossil fuels, since oil, the master resource that makes all others possible, probably peaked in 2008 at 69.5 million barrels per day (mb/d) (IEA 2018 p45), or in 2018 (EIA 2020).
The good news is that the worst IPCC projections are less likely to be reached (see chapter 33 of Life After Fossil Fuels). And as oil declines exponentially faster, perhaps from now onward, CO2 will decline: About 50% of carbon dioxide emitted by human activity will be removed from the atmosphere within 30 years, and 30% more within a few centuries. The remaining 20% may stay in the atmosphere for many thousands of years (GAO (2014) CLIMATE CHANGE: Energy Infrastructure Risks and Adaptation Efforts GAO-14-74. United States Government Accountability Office).
2020 oil shocks $6/gallon so why can’t oil companies produce more oil?
Now that world peak oil production likely happened in 2018, oil prices are rising again and there’s a great clamor for oil companies to replace it. You’ll never hear mainstream media talk about peak oil, but there’s a lot about why more oil isn’t being produced to keep panic at bay perhaps.
Despite pressure on nations to not buy Russian oil, China, India, and other nations are willing. This isn’t happening much though because it’s difficult due to the logistics of shipping the oil from Russia’s Black Sea & Baltic ports to Asia, a lack of tankers to ship the oil in, impossibility of using VLCC ships since the Russian ports are too shallow so oil has to be transfered from small to large VLCCs, increasing costs. Plus bank guarantees and insurance for Russian oil are hard to get. And it takes too long — just a week to ship oil to Europe but four months to Asia (Paraskova 2022).
Venezuela’s oil infrastructure is still a giant mess from decades of corruption, graft, poor leadership, and skilled employees fleeing to keep from starving to death. So don’t expect Venezuela to fill in the gaping hole left by peak oil and falling Russian oil production with out 58 to $200 billion dollars of maintenance (Smith 2022)
Lawmakers called in top level oil companies to ask why they haven’t raised oil production enough to lower energy prices. Shell explained that their 20-story high offshore oilrig took 13 years to evolve from oil discovery to production. These offshore projects cost billions of dollars and take at least 10 years to come online. In addition, oil companies laid off thousands of offshore oil workers when fracked shale oil became popular which afe cheaper and faster to exploit, so experts in offshore platforms are harder to find. Shell has announced that its oil production has peaked and will decline every year from now on, so that means there is less oil for them to extract (Takahashi 2022)
The Libyan National Oil Company (NOC) has declared force majeure on another key Libyan oil field, the 300,000 bpd Al Sharara, the largest oil field, amid protests that had shut down production at two ports and the El Feel oilfield on Sunday (Kennedy 2022).
In the U.S. shortages of labor, materials and equipment will prevent a rapid supply response to current market tightness. One major constraint on supply is a lack of high-end, high-horsepower “super-spec” drilling rigs and qualified hydraulic fracturing crews. Exploration and production (E&P) firms also have cited pressure from investors as a factor limiting production growth, as shareholders have demanded that a greater percentage of cash flow from operations be returned to them, rather than reinvested as capital expenditure (Baker 2022).
Also:
Nigeria has always had a problem with massive theft of oil, in 2022: Nigeria lost more than 115,000 barrels per day (bpd) to oil theft and vandalism between January 2021 and February 2022, which amounts to $3.27 billion worth of crude oil.
Alice Friedemann www.energyskeptic.com Author of Life After Fossil Fuels: A Reality Check on Alternative Energy; When Trucks Stop Running: Energy and the Future of Transportation”, Barriers to Making Algal Biofuels, & “Crunch! Whole Grain Artisan Chips and Crackers”. Women in ecology Podcasts: WGBH, Jore, Planet: Critical, Crazy Town, Collapse Chronicles, Derrick Jensen, Practical Prepping, Kunstler 253 &278, Peak Prosperity, Index of best energyskeptic posts
***
Peak Oil
Of all the resources in the world, oil is top dog. All other resources depend on oil. You can get every fish in the sea, drain every drop out of non-renewable aquifers, make enough concrete to pave the planet, and convert every square mile of land to grow crops and feed barnyard animals cutting down the remaining forests. Which we are well on our way to doing. But only oil can do it, because the heavy-duty diesel engines that do the essential work of civilization run on diesel fuel. Locomotives, ships and trucks (i.e. logging, mining, construction, long-haul, garbage, cranes, fork-lifts, tractors, harvesters) all burn oil.
And only oil, coal, and natural gas can generate the high heat of up to 3200 F needed in manufacturing for cement, steel, ceramics, microchips, glass, and many other products. Charcoal from biomass doesn’t scale up, and makes lower quality products. See Chapter 9 of “Life After Fossil Fuels” for details.
Peak oil doesn’t mean “running out of oil”, it happens when global oil production inevitably declines, which will clearly happen some day since oil is finite. Since the 1960s the world has been consuming more oil than has been discovered. Most of the world’s 500 largest oil fields were discovered over fifty years ago, and are still the source of 60 % of our oil.
Decline may have begun in 2018 as discussed in the preface above. Conventional oil peaked in 2005, and provides 90% of our oil supplies. Oil fields past their peak are declining on average 6% a year. But every year that increases slightly, so by 2030 they may be declining at 9% or more a year. This means that by 2030 half to two-thirds of our oil will need to be replaced. Mining for minerals of any kind, mainly and especially oil, but also other metals and minerals, consumes about 10% of all the primary energy produced today, and increasing amounts of energy to keep energy production flat, which will get more difficult as depletion rates exponentially grow (Bardi 2013).
I don’t see how unconventional oil can make up the difference. Even if a crash program to ramp up tar sands production occurred, peak would be reached about 2040 at a quarter of what America consumes today. Arctic oil, if we ever figure out how to get it, will take decades of development before a single drop is produced. And tight fracked oil is expected to peak by 2020 after which it will decline rapidly.
Also, these unconventional oil sources require a tremendous amount more energy than conventional to drill, move, and process than conventional oil.
Ever since oil prices dropped, people have forgotten and even denied peak oil. But perhaps they’d think differently if they’d heard former Secretary of Defense James at a senate hearing in 2006 where he said that “By about 2010, we should see a significant increase in oil production as a result of investment activity now under way. There is a danger that any easing of the price of crude oil will, once again, dispel the recognition that there is a finite limit to conventional oil.
There can be no transition to alternative energy without oil because that’s what heavy-duty transportation runs on. Wind turbines depend on the delivery of 8,000 parts from dozens of countries and trucks to dig a giant hole and fill it with 1300 tons of concrete for a platform to put the turbine on after it’s delivered.
Oil shocks can happen any time there’s a financial crash, exporters keep their oil for their own growing populations, war or terrorists destroy refineries, oil tankers, or block choke-points.
Peak oil in the news:
Stillman A (2021) Mexico to Stop Exporting Oil in 2023 in Self-Sufficiency Quest. Bloomberg. My comment: The U.S. imported 9% of its oil from Mexico in 2018.
2016-9-17 The death of the Bakken field has begun: Big Trouble For The U.S.
2017. Ahmed, Nafeez. Failing states, collapsing systems biophysical triggers of political violence. Springer.
The rate of growth of human civilization’s global net energy production for the first time in history began to slow down since the end of the 20th century (King 2015; King et al. 2015a, b). Global net energy production may have already reached, or else is rapidly approaching a peak as the rate of growth in energy production declines, and as the quality of traditional mineral sources of energy also declines.
Between 1960 and 1980, the world average value of EROI declined by more than half from 35 to 15 (Castillo-Mussot et al. 2016; Hall et al. 2014; Hall and Klitgaard 2012; Hallock et al. 2014). During this very period fossil fuel production increased, but since 1950 the rate of production has been declining.
Among the key drivers of this decline in resource quality despite increasing production is the growing shift toward unconventional fossil fuels, which are more expensive and difficult to produce, and whose energy value is lower than that for conventional oil. Since 2005, the rate of increase of conventional oil production has dramatically slowed, to the point that it appears to now be on an undulating plateau that has been unable to exceed a ceiling of around 75 million barrels per day.
Whether or not the resulting growth in production is defined as ‘conventional’, or encapsulated under an even wider estimate of overall ‘liquids’ production, what this sort of language obscures is the reality that since 2005, the increase in global liquids production has come from “hard-to-produce” sources, using expensive unconventional production techniques. For this reason, the language of ‘peak oil’ alone, and ensuing GMIC claims that ‘peak oil’ forecasts are simply wrong because the world is on course to increase all-liquids production for several decades, has been unhelpful in assessing the thermodynamic reality of the actual net value of global energy production from hydrocarbon sources.
The critical issue is that a particular type of higher quality, cheaper energy whose production has been increasingly constrained since 2005, has paved the way for a transition to poor quality, low EROI, expensive forms of oil and gas which have a much lower energy value. That is why even the IHS CERA study admits that: “All categories of oil resource are now more expensive to develop, requiring high oil prices to generate an economic return” (Jackson and Smith 2014).
Whereas the EROI value of conventional oil is estimated at between 17:1 and 18:1, the EROI values of unconventional sources, like tar sands, shale oil, and shale gas is far lower: “The average value for EROI of tar sands is 4:1. Only 10% of that amount is economically profitable with current technology.” For shale oil and gas: “The EROI varies between 1.5 and 4, with an average value of 2.8. Shale oil is very similar to the tar sands; being both oil sources of very low quality. The shale gas revolution did not start because its exploitation was a very good idea; but because the most attractive economic opportunities were previously exploited and exhausted” (Castillo-Mussot et al. 2016).
Investor coalition Ceres warns that production costs, market instability, and low EROI of less than a third of conventional oil’s EROI, are endangering the viability of investments in unconventional oil (RiskMetrics Group 2010).
The Ceres study corroborates a Boston University analysis of the EROI of unconventional oil, finding it to be “extremely low” at between 1:1 and 2:1 when internal energy consumed in the oil shale conversion process is counted as a cost. An EROI of 1:1 means there is no energy “profit” from the investment of energy at all (Cleveland and O’Connor 2011).
In its World Energy Outlook 2009, the International Energy Agency (IEA) effectively conceded that the apparent doubling of world reserves since 1980 was politically motivated, coming largely from upward revisions by OPEC countries “driven by negotiations at that time over production quotas and have little to do with the discovery of new reserves or physical appraisal work on discovered fields.” (IEA 2009).
Two recent scientific reviews have corroborated this conclusion. One by the UK government’s former chief scientific advisor, Sir David King, concluded that official estimates of world total oil reserves (including conventional, deep water and unconventional resources) should be downgraded from 1150 to 1350 barrels to between 850 and 900 billion barrels (Owen et al. 2010). The other was authored by Michael Jefferson, former chief economist at Royal Dutch Shell Group, who reports that “the five major Middle East oil exporters altered the basis of their definition of ‘proved’ conventional oil reserves from a 90% probability down to a 50% probability from 1984. The result has been an apparent, but not real, increase in their ‘proved’ conventional oil reserves of some 435 billion barrels.
This coheres with similar projections by David Hughes, former senior geoscientist for the Geological Survey of Canada, who incorporates consideration of technological developments for exploitation of unconventional gas and concludes that world gas production will nevertheless peak around 2027 (Homer-Dixon 2011).
A separate study similarly found that although the interplay between technology and prices for unconventional gas could significantly widen the possible range in which peak gas production may occur to from 2019 to 2062, the best estimate of peak production is around 2028: “While it was found that the production of unconventional gas was considerable, it was unable to mitigate conventional gas peaking” (Mohr 2010; Mohr et al. 2015).
Peak Coal
The United States is often said to have 250 years of coal reserves. But that estimate was made in 1974. A national academy of sciences report in 2007 said they thought the number might be closer to 100 years and recommended the USGS do another survey. And when the USGS did that, and reassessed America’s most important reserve, the Powder River Basin in Wyoming and Montana, where 42% of our coal is produced, they found that at most, 40 years of reserves were left. Not 250 years. This is the coal that keeps the lights on in much of America. But the only major news media that reported this were U.S. News and World Report and the Pittsburgh post gazette.
There are scientists who believe coal has already peaked globally or will soon. Estimates of global peak production range from 2015 to 2034, and U.S. peak from 2002 to 2015.
Wang (2017) estimates China’s peak coal production in 2020 at 4400 Mt/year (91.9 EJ/year), and India by 2050 (Wang 2018). But Wang doesn’t take into account that oil may have peaked in 2008 or 2018, and coal depends on oil for extraction and can’t substitute for diesel in many regions due to lack of water, low EROI, and high cost.
Coal especially depends on diesel fuel to be transported by rail or ship since it can’t flow through cheap pipelines like oil or natural gas. When I wrote “When Trucks Stop Running”, 40% of the cargo hauled by rail was coal!!!
Tad Patzek, former chairman of the Department of Petroleum and Geosystems Engineering at the University of Texas, Austin, found that energy-contentwise, global coal peak may have occurred already in 2011. By 2050, remaining coal will provide only half as much energy as today, and carbon emissions from coal will decline 50 % by 2050. Patzek used the same Hubbert methods that successfully predicted peak oil to come to this conclusion (Patzek et al. 2010).
A good percent of remaining coal reserves are lignite with an EROI so low it’s often not worth mining. Consider the knock-on effects of low quality coal and coal shortages on manufacturing, and supply chains in China:
China could face further power shortages this summer despite taking drastic measures to boost coal production, as much of the new supply is of lower quality than before and burns more quickly in power stations. Some utilities in southern China saw coal use rise by nearly 15% in late May from a year ago, but power generation volume remained nearly the same. Increased coal imports by European buyers keen to replace Russian coal and gas supplies have also reduced high-grade coal supplies and pushed international coal prices well above domestic Chinese prices, making imports economically unfeasible for many Chinese power firms. Higher than usual temperatures forecast in eastern and central China this summer may also push up demand for air conditioning, while expected flooding may disrupt power generation from hydropower during the upcoming rainy season (Xu 2022).
And this in turn is halting the production at numberous factories, including those supplying Apple and Tesla. Aluminum production has gone down 7%, cement production 29%, and it’s likely that steel, paper, chemicals, dyes, furniture, soymeal, and glass will production will also be affected(singh 2021)
Clearly other coal reserves need to be re-evaluated again too. It’s a good bet the reserves in Illinois will go down, since even though coal production is half of what it was 20 years ago, it’s still credited with reserves nearly the size of Montana.
And just as the easiest, best, shallow, high EROI of the best quality oil was drilled for first, the same is true of coal. We got the easy high energy density coal at the surface and less than a mile deep of coal first. The lowest quality coal, lignite, is often not worth mining. Consider the effect
Liquefied coal, also known as CTL, is seen as a way to cope with diesel shortages in the future, since we know this can be done because Sasol has been making CTL for 50 years in South Africa.
Coal is also one of the few substances that might scale up to replace oil, though whether it would be worth doing depends on a more realistic assessment of our reserves. Some geologists estimate America has as little as 60 years of coal left. If that’s correct and it was all converted CTL, then it would only last 30 years, since half the energy of coal is needed to make CTL. With Carbon Capture and Storage, another 40% of the energy would be used.
CTL has other limits too. Each ton of liquid coal requires 6 to 15 tons of water, so very little if any could be produced in dry states like Wyoming and Montana where there simply isn’t enough water.
Peak Natural Gas
Just four nations produced half the world’s natural gas: 23.7% U.S., 16.6% Russia, 6.5% Iran, and 5% China. It is possible that global peak gas production was in 2019, though perhaps not if it was due to supply chains being disrupted by the Covid-19 pandemic. If production is still less in 2024, then the peak of NG can be proclaimed. And that will make gas reserves far more valuable, raising prices for importers. Especially those importing the most — Europe and Asia. It is not likely American can supply Europe with more NG since the LNG infrastructure to do that isn’t in place. And yet only the U.S. and Asia could possibly produce more, since 88.8% of global gas reserves are in decline. And given that 7 of 8 fracked tight shale basins in the U.S. are in decline, it remains to see if the U.S. can increase production much (Michaux 2022).
Introduction
Energy is the backbone of any society’s economic development and, accounting for 84% of the current global primary energy consumption, fossil fuels are the largest contributors. However, the current energy mix leads to two problems: (i) fossil fuels are, by their very essence, non-renewable, meaning that cheap reserves will eventually dwindle; (ii) environmental impacts (water consumption, land-use change, induced seismic activity, public health and safety risks, etc.) and the CO2 emissions released by their ever-escalating use threaten every aspect of human societies as well as a large part of the living world. In this context, a rapid and global transition to low-carbon energy sources is deemed a necessity, although not without scrutiny of its feasibility.
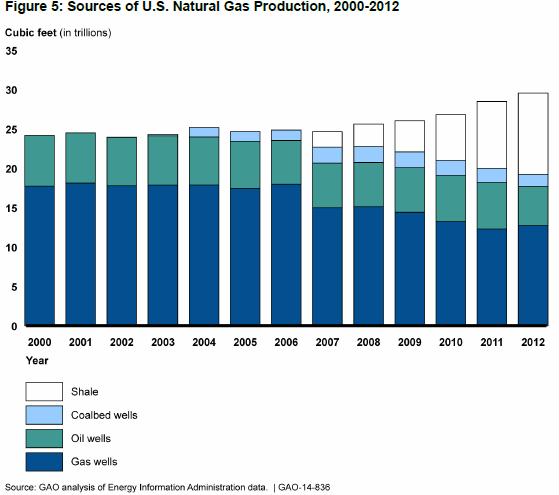
Natural gas is expected to play an important role in this transition, at least in the short- and middle-term. Its numerous strategic advantages (abundance, versatility, high gravimetric energy density, etc.) drove a steady 3.4% consumption increase since 2000, which is likely to persist for the current decade. To meet this growing demand, the industry turned to unconventional gas resources (the distinction between conventional and unconventional resources is rooted in the difficulty of extracting and producing the resource; however, there is no consensus on where to draw the line between the two, as it depends on either economic or geological issues), especially in the U.S., where, in 2018, shale gas made up 70% of the total production according to the U.S. Energy Information Administration (https://www.eia.gov/todayinenergy/detail.php?id=38372,accessed on 15 July 2021). This shift becomes interesting from a net-energy perspective (i.e., the energy available after accounting for the cost of its acquisition, usually inclusive of extraction, refinement and delivery), as unconventional production methods are usually more energy intensive, and energy returns tend to diminish over time.
The Net Energy Analysis (NEA) is a conceptual framework drawn up in the early 1970s, when energy-related concerns emerged after the oil crisis. According to the NEA, the net-energy (i.e., the energy available after accounting for the cost of its acquisition, usually inclusive of extraction, refinement and delivery) is the main driver of the economic development of societies and should become the standard basis of political decisions.
Despite the conceptual elegance and simplicity of previous equations, EROI has been at the center of theoretical and practical disputes, with the main one being the clear delimitation of energy output boundaries and energy input levels. This made the realistic comparison of EROI from different sources difficult. A first tentative attempt to solve EROI associated issues was made by Murphy et al. with a protocol proposition identifying standard boundaries for energy inputs and outputs. If several controversies remain, EROI has proved itself to be a powerful indicator when correctly applied. It also attracted a great deal of attention starting from the 2010s, as the energy transition from high-energy-yield fossil-fuels to low-energy-yield renewables might put pressure on the energy production system.
The weighted-average EROI of natural gas experiences a steady decrease from its initial value of 141.5 to an apparent plateau of 16.8. This reduction is, in large part, due to the decrease in conventional gases’ EROI, which begins to be inferior to: shale-tight gas EROI in 1992, offshore 500–1000 m in 2000, offshore 1000–2000 m in 2008, offshore +2000 m in 2016 and coal bed methane in 2022.
The energy required for the production of gases grows from 1.3 EJ in 1990 to 11 EJ in 2020 and 53 EJ in 2050, showing an exponential increase until the curve starts to flatten from 2040. This respectively represents 1.7%, 6.3% and 23.7% of the gross energy production
***
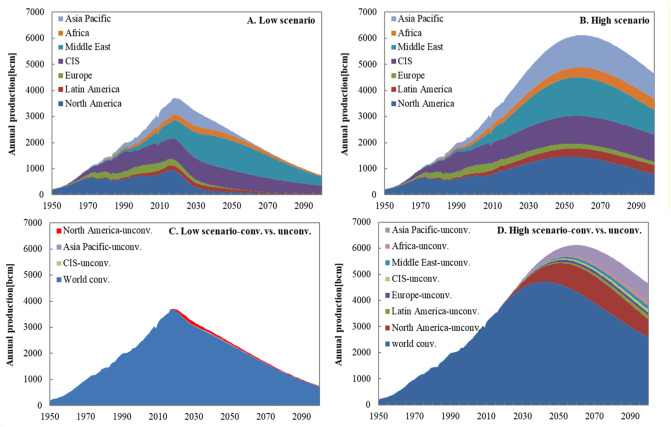
Figure 2 shows that world natural gas production is likely to peak in the range 3.7 to 6.1 trillion cubic meters per year (tcm/y) between 2019 and 2060 depending on assumptions made on the size of the global ultimately recoverable resource (URR) of natural gas (Wang and Bentley 2021). Source: Peak Natural Gas. Source: Wang and Bentley (2021) Modelling world natural gas production. Energy Reports
Given peak oil in 2018, the natural gas peak is likely closer to 2019 than it is to 2060 in Figure 2.
It’s hard to predict world peak natural gas, because there are huge amounts still. But many of these gas reservoirs are stranded because it would cost too much to build pipelines to get it to markets, and 20 to 40% is too expensive to process since they contain corrosive “sour” gas with toxic hydrogen sulfide or carbon dioxide.
And since shale “fracked” natural gas depletes rapidly, when U.S. shale gas peaks around 2020, or perhaps economically now due to the shale bubble bursting, it is not so good that the U.S. gets such a large, and increasing share of natural gas from fracking.
The Energy Information Administration estimates 57 years of global natural gas are left at current consumption rates. If we increased consumption by 7% a year, it would last 28.5 years, half as long.
Natural gas is not traded like oil world-wide because Liquefied natural gas import terminals cost billions and each LNG carrier $2 to 3 hundred million dollars. But in 2004, the U.S. was trying to build dozens after prices sky-rocketed and shortages loomed.
Conventional gas production peaked in 1973 and is declining at a rate of 5% a year. Fortunately, in 2005 fracked natural gas came to the rescue by yet another Wall Street scam that fleeced the middle class again like the mortgage bubble. Millions of Americans who invested in high-yield bond and stock funds were unwittingly lending money to shale companies that were losing money, who kept on drilling as long as Wall Street kept lending them money. Now shale companies are over $300 billion in debt and many have gone bankrupt. Even without the shale bubble popping, but both fracked natural gas and oil would have geologically peaked by 2020.
In order to keep trucks running our congressional leaders had hoped that by now 20% of trucks would be using compressed or liquefied natural gas to take advantage of what they’ve been told is 100 to 250 years of fracked natural gas and American Energy Independence.
But only 3.5% of trucks run on natural gas, mainly private fleets of delivery trucks and buses.
Truckers haven’t bought into natural gas because they have to refuel 2 to 4 times more often, natural gas trucks cost 50 to 100 thousand dollars more than diesel trucks, and any price advantage natural gas has is undercut by continual efficiency improvements in diesel engines.
There are very few trucks burning Liquefied natural gas, but not many since there are only 73 public LNG stations in the U.S., mainly in California.
Railroads don’t want to have to build a completely new gas distribution system and replace their 25,000 $2 million locomotives plus add a giant tank car of natural gas fuel that might explode in a derailment.
References for Peak Oil
- Aleklett, K., et al. 2012. Peeking at peak oil. Berlin: Springer.
- Baker A (2022) ‘Too Many Constraints’ to Rapidly Boost Lower 48 Oil, Natural Gas Production, Experts Say. Natural Gas Intel.
- Bardi, Ugo. 2014. Extracted: How the Quest for Mineral Wealth Is Plundering the Planet. Chelsea Green Publishing.
- Brandt A.R., et al. 2013. The energy efficiency of oil sands extraction: Energy return ratios from 1970 to 2010. Energy.
- Brown, J.J. June 10, 2013. Commentary: is it only a question of when the US once again becomes a net oil exporter? Resilience.org.
- BTC. 2010. Armed forces, capabilities and technologies in the 21st century environmental dimensions of security. Peak oil. Bundeswehr transformation centre, future analysis branch.
- CAPP. 2015. Canadian crude oil production forecast 2014–2030. Canadian Association of Petroleum Producers.
- Castillo-Mussot, Marcelo del, Pablo Ugalde-Véle, Jorge Antonio Montemayor-Aldrete, Alfredo de la Lama-García, and Fidel Cruz. 2016. Impact of Global Energy Resources Based on Energy Return on Their Investment (EROI) Parameters. Perspectives on Global Development and Technology 15(1–2): 290–299.
- Cleveland, C. J., et al. 2010. An assessment of the EROI of oil shale. Boston University.
- Cleveland, Cutler J., and Peter A. O’Connor. 2011. Energy Return on Investment (EROI) of Oil Shale. Sustainability 3(11): 2307–2322.
- CNEB. 2013. Canada’s energy future, energy supply and demand to 2035. Government of Canada National Energy Board.
- Davies, P. et al. 2000. Oil resources: a balanced assessment. Journal of the Center for Energy Petroleum & Mineral Law & Policy 6:15.
- DOE/EIA. 2015. Annual energy outlook 2015 with projections to 2040.
- EIA (2020) International Energy Statistics. Petroleum and other liquids. Data Options. U.S. Energy Information Administration. Select crude oil including lease condensate to see data past 2017
- GAO (2007) Crude oil. Uncertainty about future oil supply makes it important to develop a strategy for addressing a peak and Decline in Oil Production. U.S. Government Accountability Office.
- Hall, Charles A. S., and Kent A. Klitgaard. 2012. Energy and the Wealth of Nations. New York, NY: Springer New York.
- Hall, Charles A.S., Jessica G. Lambert, and Stephen B. Balogh. 2014. EROI of Different Fuels and the Implications for Society. Energy Policy 64: 141–152.
- Hallock, J. L., Jr, et al. 2014. Forecasting the limits to the availability and diversity of global conventional oil supply: validation. Energy 64:130–153.
- Hamilton, J.D. 2013. Historical Oil Shocks in Routledge handbook of major events of economic history. Routledge.
- Homer-Dixon, Thomas. 2011. Carbon Shift: How Peak Oil and the Climate Crisis Will Change Canada (and Our Lives). Toronto: Random House of Canada.
- Hirsch, R. L., et al. 2005. Peaking of world oil production: impacts, mitigation, & risk management. Department of energy.
- Hirsch, R.L., 2008. Mitigation of maximum world oil production: shortage scenarios. Energy Policy 36(2):881–889.
- Hook, M., et al. 2009. Giant oil field decline rates and their influence on world oil production. Energy Policy 37(6):2262–2272.
- House 112-176. 2012. The American energy initiative part 28: a focus on the outlook for achieving North American energy independence within the decade. U.S. House of Representatives hearing.
- House 112-4. 2011. The effects of Middle East events on U.S. energy markets. U.S. House of Representatives hearing.
- House 113-1. 2013. American energy security & innovation: an assessment of North America’s energy resources. U.S. House of Representatives hearing.
- House 113-2. 2013. American energy outlook: technology market and policy drivers. U.S. House of Representatives hearing.
- Hughes, J. D. 2014. Drilling deeper. Post carbon institute.
- IEA. 2008. World energy outlook 2008, 45. International Energy Agency.
- IEA. 2009. World Energy Outlook. Washington, DC: International Energy Agency.
- IEA. 2010. World energy outlook 2010, 116. International Energy Agency.
- IEA. 2013. World energy outlook 2013 executive summary. International Energy Agency.
- IEA (2018) International Energy Agency World Energy Outlook 2018, fgures 1.19 and 3.13. International Energy Agency
- Jackson, Peter M., and Leta K. Smith. 2014. Exploring the Undulating Plateau: The Future of Global Oil Supply. Philosophical Transactions of the Royal Society of London A: Mathematical, Physical and Engineering Sciences 372(2006): 20120491.
- Kelley, Colin P., Shahrzad Mohtadi, Mark A. Cane, Richard Seager, and Yochanan Kushnir. 2015. Climate Change in the Fertile Crescent and Implications of the Recent Syrian Drought. Proceedings of the National Academy of Sciences 112(11): 3241–3246.
- Kennedy C (2022) Libya Declares Force Majeure On Biggest Oilfield
- Kerr, R. 2011. Peak oil production may already be here. Science 331:1510–11.
- Macalister, T. 2009. Key oil figures were distorted by US pressure, says whistleblower. The Guardian.
- Michaux SP et al (2022) Assessment of the scope of tasks to completely phase out fossil fuels in Finland. Geological Survey of Finland. https://tupa.gtk.fi/raportti/arkisto/18_2022.pdf
- Mohr, Steve. 2010. Projection of World Fossil Fuel Production with Supply and Demand Interactions. Callaghan: University of Newcastle.
- Mohr, S.H., J. Wang, G. Ellem, J. Ward, and D. Giurco. 2015. Projection of World Fossil Fuels by Country. Fuel 141: 120–135
- Murphy, D.J., et al. 2011. Energy return on investment, peak oil, and the end of economic growth. Annals of the New York Academy of Sciences 1219: 52–72.
- Murray, J., et al. 2012. Oil’s tipping point has passed. Nature 481:43–4.
- Newby, J. 2011. Oil Crunch (Fatih Birol). Catalyst. ABC TV.
- NPC 2015. Arctic potential: realizing the promise of U.S. arctic oil and gas resources. National Petroleum Council.
- NRC. 2006. Trends in oil supply and demand. Potential for peaking of conventional oil production and mitigation options. National Research Council.
- Owen, Nick A., Oliver R. Inderwildi, and David A. King. 2010. The Status of Conventional World Oil reserves—Hype or Cause for Concern? Energy Policy 38(8): 4743–4749.
- Paraskova T (2022) What’s Keeping China From Buying More Russian Crude? Oilprice.com
- Patzek, T., et al. 2010. A global coal production forecast with multi-Hubbert cycle analysis.
Energy 35: 3109–3122 - Patzek, T. 2012. Oil in the Arctic. LifeItself blog.
- Pearce, F. 2012. The land grabbers: the new fight over who owns the earth. Beacon Press.
- RiskMetrics Group. 2010. Canada’s Oil Sands: Shrinking Window of Opportunity. Ceres, Inc. http://www.ceres.org/resources/reports/oil-sands-2010
- Sahagun, L. May 21, 2014. U.S. officials cut recoverable Monterey Shale oil by 96 %. Los Angeles Times.
- Senate 109-412. 2006. Energy independence. U.S. Senate hearing.
- Singh S (2021) China power crunch spreads, shutting factories and dimming growth outlook. Reuters. https://www.reuters.com/world/china/chinas-power-crunch-begins-weigh-economic-outlook-2021-09-27/
- Smith M (2022) Can Maduro Meet His Wildly Ambitious Crude Oil Production Targets? oilprice.com
- Soderbergh, B., et al. 2007. A crash programme scenario for the Canadian oil sands industry. Energy Policy 35.
- Takahashi P (2022) 13-Year Shell Journey to First Oil Shows Why USA Output Is Flat. Bloomberg.
- Udall, R. 2005. The illusive bonanza: oil shale in Colorado “pulling the sword from the stone”. ASPO-USA.
- Waldman, J. 2015. Rust. The longest war. Simon & Schuster.
- Xu M (2022) Analysis: Quantity over quality – China faces power supply risk despite coal output surge. Reuters
https://www.reuters.com/markets/commodities/quantity-over-quality-china-faces-power-supply-risk-despite-coal-output-surge-2022-06-21/ - Zittel, W, et al. 2013. Fossil and nuclear fuels. Energy Watch Group.
References for Peak Coal
- Croft G.D., and T.W. Patzek. 2009. Potential for coal-to-liquids conversion in the U.S.—resource base. Natural Resources Research.
- 2015. Table 6.2 Coal Consumption by sector. Washington, DC: Energy Information Admin.
- 2013. Fossil and nuclear fuels—the supply outlook. Energy Watch Group.
- Heinberg, R., and D. Fridley. 2010. The end of cheap coal. Nature 468:367–369.
- Höök, M., et al. 2009. Historical trends in American coal production and a possible future outlook. International Journal of Coal Geology 78(3):201–216.
- Höök, M., et al. 2010a. Global coal production outlooks based on a logistic model. Fuel 89: 3546–3558.
- Höök, M. 2010. Trends in U.S. recoverable coal supply estimates and future production outlooks (Gompertz curve p. 20). Natural Resources Research 19(3): 189–208.
- Höök, M., et al. 2010b. A review on coal-to-liquid fuels and its coal consumption (Fig. 3). International Journal of Energy Research 34: 848–864.
- Höök, M., et al. 2010c. Validity of the fossil fuel production outlooks in the IPCC emission scenarios. Natural Resources Research 19(2): 63–81.
- Höök, M., et al. 2014. Hydrocarbon liquefaction: viability as a peak oil mitigation strategy. Philosophical Transactions. Series A: Mathematical, Physical, and Engineering Science 372.
- Kong, Z., et al. 2015. EROI analysis for direct coal liquefaction without and with CCS: The case of the Shenhua DCL Project in China. Energies 8(2): 786–807.
- Luppens, J.A., et al., 2008. Assessment of coal geology, resources, and reserves in the Gillette coalfield, Powder River basin, Wyoming. U.S. Geological Survey Open-File Report. http://pubs.usgs.gov/of/2008/1202/.
- Luppens, J.A., et al. 2009. Coal resource availability, recoverability, and economic evaluations in the U.S. A summary. U.S. Geological Survey.
- Mohr, S.H., et al. 2009. Forecasting coal production until 2100. Fuel 88: 2059–2067.
- 2007. Hydrocarbon liquids, Chap. 11. Hard truths: Facing the hard truths about energy. National Petroleum Council.
- 2007. Coal. Research and development to support national energy policy. Washington (DC): National Academies Press.
- 2009. Liquid transportation fuels from coal and biomass: Technological status, costs, and environmental impacts. Washington (DC): National Academies Press.
- Patzek, T.W. et al. 2009. Potential for Coal-to-Liquids Conversion in the United States-Fischer-Tropsch Synthesis. Natural Resources Research 18(3).
- Patzek, T., et al. 2010. A global coal production forecast with multi-Hubbert cycle analysis. Energy 35: 3109–3122.
- Reaver, G.F., et al. 2014. Imminence of peak in US coal production and overestimation of reserves. International Journal of Coal Geology 131: 90–105.
- Rutledge, D. 2011. Estimating long-term world coal production with logit and probit transforms. International Journal of Coal Geology 85: 23–33.
- 2007. Crude oil. Uncertainty about future oil supply makes it important to develop a strategy for addressing a peak and decline in oil production. United States Government Accountability Office.
References for Natural Gas
- Berman, A., et al. 2015. Years not decades: proven reserves and the shale revolution. Houston: Houston Geological Society.
- Coyne, D. 2015. World natural gas shock model. peakoilbarrel.com, July 28.
- DOE/EIA. 2015. Annual energy outlook with projections to 2040. U.S. Energy Information Administration.
- Heinberg, R. 2013. Snake Oil: How fracking’s false promise of plenty imperils our future. California: Post Carbon.
- House 113-1. 2013. American energy security and innovation: An assessment of North America’s energy resources. U.S. House of Representatives Hearing.
- Hughes, J. David. 2014. Drilling Deeper. A reality check on U.S. government forecasts for a lasting tight oil & Shale gas boom. Part 1: Executive Summary. California: Post Carbon Institute.
- 2009. Second IMO GHG Study. International Maritime Organization.
- Inman, M. 2014. Natural gas: The fracking fallacy. Nature 516: 28–30.
- Krauss, C. 2012. After the Boom in natural gas. New York Times, October 20.
- Loder, A. 2015a. Shale drillers feast on junk debt to stay on treadmill. Bloomberg, April 30.
- Loder, A. 2015b. The Shale industry could be swallowed by its own debt. Bloomberg.com, June 18.
- 2015. Review of the 21st century truck partnership, 3rd report. Washington, DC: National Academies Press.
- Powers, B. 2013. Cold, hungry and in the dark: Exploding the natural gas supply myth. Gabriola: New Society Publishers.
- Senate 109-412. 2006. Energy independence. U.S. Senate Hearing, March 7.
- Senate 113-1. 2013. Natural gas resources. U.S. Senate Hearing, February 12.
- Senate 113-355. 2014. Crude oil exports. U.S. Senate Hearing, January 30.
- TIAX LLC. 2010. Demonstration of a Liquid Natural Gas Fueled Switcher Locomotive at Pacific Harbor Line, Inc, prepared for the Port of Long Beach.
- Tinker, S.W. 2014. Role of shale gas in North American and global power markets. Slide 45 Forecast vs. Actual. University of Texas, Bureau of Economic Geology.
- Urbina, I. 2011. Insiders sound an alarm amid a natural gas rush. New York Times, June 25. http://www.nytimes.com/2011/06/26/us/26gas.html?src=tptw&_r=3&.
- S. Census. 2000. Annual projections of the total resident population as of July 1: Middle, lowest, highest, and zero international migration series, 1999–2100. http://www.census.gov/population/projections/files/natproj/summary/np-t1.txt.
- Wang JL et al (2017) A review of physical supply and EROI of fossil fuels in China. Petroleum Science.
- Wang J et al (2018) Modeling India’s Coal Production with a Negatively Skewed Curve-Fitting Model. Natural Resources Research.
- Wang and Bentley (2021) Modelling world natural gas production. Energy Reports 6: 1363-1372.
- Yergin, D., et al. 2003. The next prize. Foreign Affairs, Council on Foreign Relations. https://www.foreignaffairs.com/articles/2003-11-01/next-prize.
One Response to Peak Fossil Fuels: overview of world peak oil, peak coal, & peak natural gas