
[ FYI the USDA recently updated the numbers on the energy balance of corn ethanol in 2015 Energy Balance for the Corn-Ethanol Industry. Todd “Ike” Kiefer has written a rebuttal that can be found here. Past articles of his include one critical of the Navy’s efforts to promote biofuels entitled Energy Insecurity: The False Promise of Liquid Biofuels (discussed here).
Alice Friedemann www.energyskeptic.com author of “When Trucks Stop Running: Energy and the Future of Transportation, 2015, Springer]
Jessica Lambert, Nov 2012. Charles Hall, et. al. EROI of Global Energy Resources Preliminary Status and Trends. State University of New York, College of Environmental Science and Forestry
This 41 page pdf is full of graphs, how EROI is calculated, and other information that is quite interesting. If you’re new to the concept of EROI, this is a good paper to read, and if you’re familiar with it, this is a good source of “where we are now” as we approach the energy cliff. The concept of EROI is essential to understanding why we’re headed for collapse. There’s an assumption that alternative energy resources like solar and wind can fill in for oil because people have no idea how huge the scale and quality of energy from oil is (especially as a transportation fuel). Also see Nature magazine’s Hydrocarbons and the evolution of human culture Alice Friedemann
Some key findings of this paper:
- The energy and material resources available to a society determines the growth and decline of a civilization.
- Only if there’s a surplus of energy can a division of labor, with artisans, specialists, and cities exist. Even more energy is needed to reach high levels of wide-spread wealth (a middle-class), education, health care, and culture.
- Fluctuations in the availability of cheap high-quality energy (oil) are far better at predicting and explaining booms and busts than what kind of political or economic system a country has. Four of the five recessions since 1970 can be explained by increased oil prices. A recession results in declining oil prices, leading to more consumption, a boom period, leading to higher energy consumption and energy prices, constraining growth (again).
- High energy prices mean society has to divert resources away from discretionary spending to pay for the higher-priced energy
- Fossil fuels supply more than 75% of the total energy used globally.
- The Energy Returned on Investment (EROI) has declined for all fossil fuel resources except coal since the 1950s. In the United States, the EROI of production iwas 30:1 in the 1970s and less than 10:1 now. Global EROI has gone from 30:1 in 1995 to around 18:1 in 2006.
- Although coal production has gone up, the quality of the coal has been declining since 1998.
- EROI of renewable energy is very low:
EROI Source
- 2:1 Biofuels are less than 2 to 1, negative or break-even
- 18:1 Wind (perhaps)
- 7:1 Photovoltaic solar
- Most renewable and nonconventional energy alternatives have substantially lower EROI values than conventional fossil fuels.
- Declining EROI, at the societal level, means that an increasing proportion of energy output is diverted to getting the energy needed to run an economy with less discretionary funds available for “non-essential” projects.
- The declining EROI of traditional fossil fuel energy sources and this eventual effect on the world economy are likely to result in a myriad of unforeseen consequences.
- For civilization as we know it to exist, the minimum EROI is:
Minimum EROI required Activity
- 1.1 : 1 Extract oil
- 1.2 : 1 Refine Oil
- 3 : 1 Transportation
- 5 : 1 Grow Food
- 7-8 : 1 Support Family of Workers
- 10 : 1 Education
- 12 : 1 Health Care
- 14 : 1 Arts and other culture Source: (Lambert)
Explanation: If oil EROI is 1.1 we can pump it up and see it. If it’s 1.2 : 1, you can both extract and refine it. To deliver the oil, you’d need at least a 3 to 1 EROI to build and maintain trucks, roads, and bridges. If the product is grain, not oil, then an EROI of about 5:1 because you need to add in the energy to grow and process the grain. And so on. Murphy et al., 2010 report that just prior to the financial collapse of 2008, the annual global increase of each conventional fossil fuel (oil, gas, and coal) was greater than the total annual production of all non-conventional, solar-based (i.e., wind turbines and photovoltaics) energy. This means that energy derived from nonconventional energy sources is not displacing fossil fuel use, it’s just contributing to annual global energy growth.
Energy and GDP (dotted line) & population (not shown) are directly related. Below you can see that the global use of hydrocarbons for fuel by humans has increased nearly 800-fold since 1750 and about 12-fold in the twentieth century. The most general result has been an enormous increase in the ability of humans to do all kinds of economic work, as represented by the increase in GDP. Source: (Hall):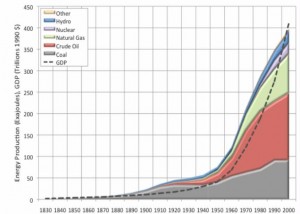
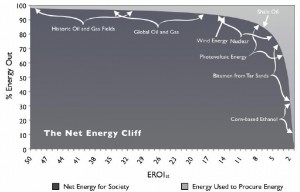
Figure 7: The “Net Energy Cliff” (figure adapted from Lambert and Lambert, in preparation and Murphy et al. 2010) As EROI approaches 1:1 the ratio of the energy gained (dark gray) to the energy used (light gray) from various energy sources decreases exponentially. High EROI fuels allow a greater proportion of that fuel’s energy to be delivered to society (e.g. a fuel with an EROI of 100:1 (horizontal axis) will delivers 99% of the useful energy (vertical axis) from that fuel to society. Conversely, lower EROI fuel delivers substantially less useful energy to society (e.g. a fuel with an EROI of 2:1 will deliver 50% of the energy from that fuel to society).
Therefore, large shifts in high EROI values (e.g. from 100 to 50:1) may have little or no impact on society while small variations in low EROI values (e.g. from 5 to 2.5:1) may have a far greater and potentially more “negative” impact on society (concept courtesy of Euan Mearns).
Most alternative renewable energy sources appear, at this time, to have a considerably lower EROI values than any of the nonrenewable fossil fuels. But wind and photovoltaic energy are touted as having environmental benefits which may be substantial. These benefits may in fact have larger initial carbon footprints than originally suggested. Factors such as the oil, natural gas and coal employed in the creation, transport and implementation of wind turbine and PV panels may not be adequately represented in some cost-benefit analysis nor have the energy costs pertaining to intermittency.
References (the report has 208 references, good, up-to-date material to read if you want to know more)
Hall, C.; Klitgaard, K. Energy and the Wealth of Nations: Understanding the Biophysical Economy; Springer Publishing Company: New York, USA, 2011.
Lambert, J.; Lambert, G. Life, Liberty, and the Pursuit of Energy: Understanding the Psychology of Depleting Oil Resources; Karnak Books: London, UK, In preparation.
Murphy, D.; Hall, C. Year in review—EROI or energy return on (energy) invested. Ann. N.Y. Acad. Sci. 2010, 1185, 102–118.