“Concentrating solar power plants that use wet cooling could significantly increase water demand, consuming up to twice as much water per unit of electricity produced as traditional fossil fuel power plants. Concerns with concentrating solar power plants are particularly acute in the Southwest because water supplies in the region are already limited. But according to DOE officials, concentrating solar power plants are generally being built with dry cooling systems in the Southwest to minimize water use. However, according to a 2009 DOE report to Congress, while dry cooling can eliminate over 90% of the water consumed by wet-cooled concentrating solar power plants, wet cooling is preferred to minimize cost and maximize efficiency” (USGAO 2012).
Alice Friedemann www.energyskeptic.com author of “When Trucks Stop Running: Energy and the Future of Transportation”, 2015, Springer and “Crunch! Whole Grain Artisan Chips and Crackers”]
CRS. 2009. Water Issues of Concentrating Solar Power (CSP) Electricity in the U.S. Southwest. Congressional Research Service.
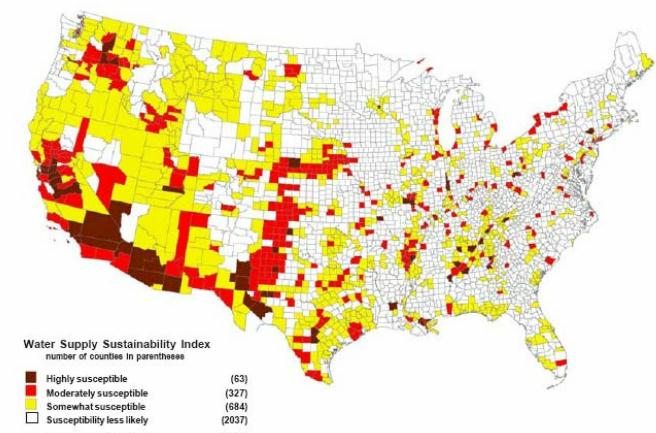
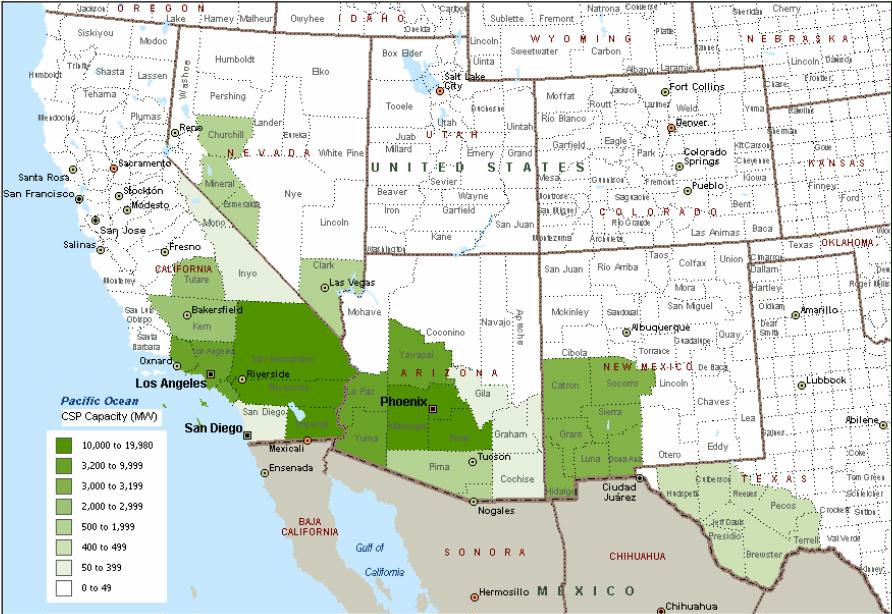
As you can see in the two maps below, the best sites for CSP are also the most water challenged.
Source: EPRI. 2003. A Survey of Water Use and Sustainability in the United States with a Focus on Power Generation
Source: N. Blair, Concentrating Solar Deployment Systems (CSDS) – A New Model for Estimating U.S. Concentrating solar Power Market Potential (undated).
Growing populations and changing values have increased demands on water supplies and river systems, resulting in water use and management conflicts throughout the country, particularly in the West. In many western states, agricultural water needs can be in direct conflict with urban needs, as well as with water for thermoelectric cooling, threatened and endangered species, recreation, and scenic enjoyment. Debate over western water resources revolves around the issue of how best to plan for and manage the use of this renewable, yet sometimes scarce and increasingly sought after, resource. Traditional users of water supplies often are wary of new water demands that may compete or result in reduced deliveries to farms (leading to lost agricultural production). Deployment of CSP would add an additional demand to existing freshwater competition in the Southwest.
The Western Governors’ Association has established a goal of 8 GW by 2015 for solar energy capacity. 15 If this goal is achieved through wet-cooled CSP without storage (i.e., with a 25% capacity factor), the water requirements would be roughly 43,000 acre-feet per year.If the premium solar sites are selected for these first investments, they likely would be concentrated in Arizona and California. To provide a sense of scale for this water consumption, it can be compared to the overall state-level water consumption. For example, if all of the 8 GW was constructed in Arizona, the increased water demand would represent roughly 1% of the state’s consumptive water use.
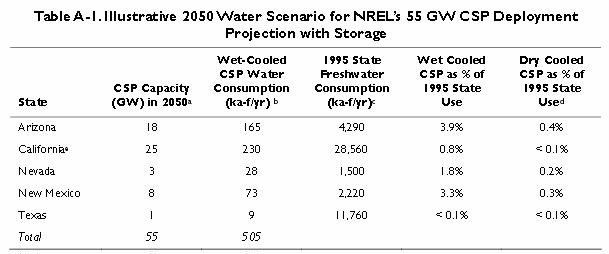
NREL projected as part of its Concentrating Solar Deployment System (CSDS) that 55 GW of CSP would be deployed by 2050 and assumed that the CSP facilities would all have six hours of storage. 18 NREL estimated the mean capacity factor for these facilities at 43%. If 55 GW of capacity by 2050 is achieved using wet cooling, the water requirements would be roughly 505 acre feet per year. CSP water use would be less if more water-efficient cooling is employed and if not all the facilities under the 55 GW deployment projection have thermal storage. Alternatively, electricity generated and water use could be higher if 12 hours of thermal storage are employed in some or all facilities.
A Department of Energy (DOE) report, Concentrating Solar Power Commercial Application Study: Reducing Water Consumption of Concentrating Solar Power Electricity Generation , found that dry cooling could reduce water consumption to roughly 80 gal/MWh for solar troughs and 90 gal/MWh for solar towers, compared to the cooling water consumption shown in Table 1. However, DOE also found that electricity generation at a dry-cooled facility dropped off at ambient temperatures above 100°F. Dry cooling, thus, would reduce generation on the same hot days when summer peak electricity demand is greatest. For parabolic troughs in the Southwest, the benefit in the reduction in water consumption from dry cooling resulted in cost increases of 2% to 9% and a reduction in energy generation of 4.5% to 5%. The cost and energy generation penalties for dry cooling depend largely on how much time a facility has ambient temperature above 100°F.
Many of the counties identified as potential locations for CSP also were identified by EPRI as having some level of susceptibility to water supply constraints. The potential use of water by CSP in moderately constrained counties (e.g., Grant and Luna, NM) and in highly constrained counties (e.g., La Paz and Maricopa, AZ) may lead to the adoption of or requirement for more freshwater-efficient CSP facilities. For some Southwest counties with relatively low water use, large-scale deployment of CSP, even with water-efficient cooling technologies, could significantly increase the demand for water in the county (e.g., Grant, NM, and Mineral, NV).
According to NREL’s analysis, significant amounts of the 55 GW generated would be transmitted outside of the CSP-generating states, thereby resulting in a virtual export of the water resources of the producing states to the consuming states. The higher the water consumed per kilowatt-hour, the more the Southwest’s limited water resources would be virtually exported to other regions. The virtual export of water raises policy questions about concentrating electricity generation and its impacts in a few counties and states while its benefits are distributed more broadly. Virtual water imports and exports, however, are not unique to electricity. For example, water is embedded in locally produced agricultural products and manufactured goods that are distributed nationally or globally.
CSP facilities using wet cooling can consume more water per unit of electricity generated than traditional fossil fuel facilities with wet cooling. Options exist for reducing the freshwater consumed by CSP and other thermoelectric facilities. Available freshwater-efficient cooling options, however, often reduce the quantity of electricity produced and increase electricity production costs, and generally do not eliminate water resource impacts.
No water is used or consumed in dry cooling. Air, however, has a much lower capacity to carry heat than water; therefore, dry cooling generally is less efficient than wet cooling in removing heat. Often, massive cooling fans are used to remove the heat from the pipe array in dry cooling. These fans consume a portion of the electricity generated by the power plant. Although dry cooling reduces water use, its consumption of energy for cooling fans and reduction of thermal efficiency of the steam turbines, especially on the hottest days of the year, when summer-peaking utilities most need power, is a significant factor impeding its adoption.
The Electric Power Research Institute (EPRI) developed an index of the susceptibility of U.S. counties to water supply constraints. The index was derived by combining information on the extent of development of available renewable water supply, groundwater use, endangered species, drought susceptibility, estimated growth in water use, and summer deficits in water supply. EPRI produced Figure 1 , which shows the susceptibility to constrained water supplies. Comparing the water constraint index to NREL’s projection of CSP deployment by 2050, in Figure 2, shows overlap, particularly in Arizona and California. NREL’s analysis did not consider water availability as a constraint on CSP deployment.
Source: Unless otherwise noted, data calculated from DOE, Energy Demands on Water Resources: Report to Congress on the Interdependency of Energy and Water , Dec. 2006. Notes: a. Data is for cooling tower technology, b. DOE, Energy Demands on Water Resources: Report to Congress on the Interdependency of Energy and Water, included some of the other water consumed onsite at the generation facility, but appears not to have captured all of the non-cooling water consumed. Collection and dissemination of data that captures all non-cooling water consumed would improve comparison across technologies. c. DOE, Concentrating Solar Power Commercial Application Study: Reducing Water Consumption of Concentrating Solar Power Electricity Generation (undated) This source captured more of the non-cooling water consumed during generation than the source cited in note b. d. NREL, Fuel from the Sky: Solar Power’s Potential for Western Energy Supply , NREL/SR-550-32160 (July 2002), p. 99. e. CRS provided note. f. Cooling ponds, which are commonly used at nuclear facilities, consume roughly 720 gal/MWh. g. IGCC is Integrated Gasification Combined-Cycle.
Capacity factors for CSP plants with storage are highly uncertain given the early stage of CSP storage technology. As the cost of thermal storage is reduced, future parabolic trough plants could yield capacity factors greater than 70%, competing directly with future baseload combined cycle plants or coal plants. Increased capacity factors mean more energy is generated at a facility, and represent an increase in the quantity of water consumed for each MW of installed capacity. Therefore, without knowing the capacity factor, projections of installed capacity in the Southwest provide incomplete information for producing reliable estimates of the water that may be required for future CSP installations.
This concentration of CSP in a region of the country with water constraints has raised questions about whether, and how, to invest in large-scale deployment of CSP. Most electricity generation requires and consumes water (see Table 1). Wind is an exception, and PV consumes water only for washing mirrors and surfaces. The water consumed per megawatt- hour (MWh) of electricity produced is referred to as the energy technology’s water intensity.
Why is there concern specifically about the CSP water footprint? CSP using wet cooling (i.e., solar trough and solar tower) consumes more water per MWh than some other generation technologies, as shown in Table 1. The water intensity of electricity from a CSP plant with wet cooling generally is higher than that of fossil fuel facilities with wet cooling. However, its water intensity is less than that of geothermal-produced electricity.
As previously discussed and as shown by comparing the second and third columns in Table 1 , the majority of water consumption at a CSP facility occurs during the cooling process. The fourth column in Table 1 depicts the water consumed in producing the fuel source; this water consumption generally does not occur at the same location as generation. Although CSP cooling technologies are generally the same as those used in traditional thermoelectric facilities, the CSP water footprint is greater due to CSP’s lower net steam cycle efficiency. Options exist for reducing the water consumed by thermoelectric facilities, including CSP facilities; however, with current technology, these options reduce the quantity of energy produced and increase the energy production cost.
A February 2009 memo from the Regional Director of the Pacific West Region of the National Park Service (NPS) to the Acting State Director for Nevada of the Bureau of Land Management illustrates the trend toward more freshwater-efficient cooling. The memo identifies water availability and water rights issues as impacts to be evaluated in permitting of renewable energy projects on federal lands. The memo states: “In arid settings, the increased water demand from concentrating solar energy systems employing water-cooled technology could strain limited water resources already under development pressure from urbanization, irrigation expansion, commercial interests and mining.” The memo also cites rulings in 2001 and 2002 by the Nevada State Engineer identifying reluctance to grant new water rights for water-cooled power plants.
References
USGAO. September 2012. ENERGY-WATER NEXUS. Coordinated Federal Approach Needed to Better Manage Energy and Water Tradeoffs GAO-12-880 U.S. Government Accountability Office. 38 pages.


