
[ Trainer argues that when you consider how the capacity factor of wind and solar are to fossil plants, seasonality of wind and solar the number of facilities is quite large to deal with the intermittency problem. Therefore the storage (hydropower, batteries, biomass, etc) must be included in the EROI calculation, the renewable system can’t operate without them. Plus the capacity factors of wind and solar are getting lower, because the best sites have already been built on, so the future capacity factor will be less, not equal or more than today’s. The lifetime of 25-30 years is questionable, plus the erosion of their performance over time usually isn’t included (i.e. dust impairing solar panels). Trainer makes a case that boundaries need to be as wide as possible, including the EROI of the workers, transmission, and so on. Prieto, Hall and others have pointed this out too. In summary, Trainer makes a good argument that the EROI values for wind and solar are far lower than commonly assumed, and that what would be more effective is reduction in demand, De-growth. He writes that “a core claim of The Simpler Way project (2017) is that a sustainable and just society based on 100% renewable energy supply is desirable and could be easily achieved, but only if there is a radical transition to new settlement patterns, economies, political systems, and most difficult of all, new values and non-affluent conceptions of the good life”.
Alice Friedemann www.energyskeptic.com author of “When Trucks Stop Running: Energy and the Future of Transportation”, 2015, Springer and “Crunch! Whole Grain Artisan Chips and Crackers”. Podcasts: Derrick Jensen, Practical Prepping, KunstlerCast 253, KunstlerCast278, Peak Prosperity , XX2 report ]
Trainer, Ted. August 14, 2017. The overlooked significance of the EROI for renewable energy supply systems. $$$ awaiting publication
Abstract. Until recently it has not been possible to estimate the energy return on energy invested (EROI) for 100% renewable energy supply systems, because simulations of the amount of capacity required have not been available. This study takes the finding of a simulation for Australian electricity, along with commonly quoted EROI values for the technologies assumed, and derives a conclusion for total system EROI. The EROI values for individual renewable technologies do not provide a reliable guide to this value because of the large amount of redundant plant that must be on hand to enable whole systems to meet demand reliably despite intermittency. Problems and uncertainties regarding commonly assumed EROI values for renewables are discussed and it is argued that in future more defensible values are likely to indicate lower system values than this study arrives at. The general finding is that 100% renewable supply systems could have values that are too low to sustain energy intensive societies.
Introduction.
Although considerable attention has been given to the energy return on energy invested (EROI) for individual renewable technologies, especially for PV, there does not appear to have been any attempt to estimate the significance of this factor for whole renewable systems. This is somewhat remarkable as the impact can be expected to be significant because in order to deal with intermittency whole renewable systems have to involve a large amount of differing types of renewable plant that remains idle much of the time. Whereas 1.2 GW of coal-fired generating plant is capable of meeting a constant 1 GW demand (taking into account a 0.8 capacity factor), various studies have found that for a 100% renewable system to do this would require enough plant to generate 4 – 6 GW. This much greater amount of generating equipment would involve a greater embodied energy cost of construction.
No generally valid conclusion on system embodied energy cost can be arrived at. Any finding would depend on the particular mix of renewable technologies involved in a specified system, and this mix would be determined by the climatic conditions characteristic of the region. It has not been possible to carry out meaningful studies of whole system embodied energy costs until recently, because simulations providing estimates of renewable technology mixes have only recently been attempted. These estimate the amounts of various technologies that seem to be required to meet demand reliably, and therefore they enable estimation of the associated total system capacities and embodied energy costs.
Method.
The following discussion explores the significance of embodied energy costs for a 100% renewable electricity supply for Australia. It is based on the mix and quantities of various renewable technologies found by Lenzen et al (2015) to be capable of meeting 2010 demand reliably at minimum cost. The approach has been to take estimates of the embodied energy costs of each of the technologies involved in the simulation, to multiply theses by the quantities of each that were found to be needed, to derive a total cost, and to consider its significance.
In principle this approach is relatively straight forward but it is complicated by uncertainties to do with the embodied energy concept and the estimation of EROI values. Some of these will be discussed later, along with their probably significant implications for calculating system EROI. However at this point it is important to say that it is not appropriate to approach the question of system EROI by using estimates of “buffered” EROIs for each renewable technology. Some studies have attempted to deal with the effect of intermittency on a technology’s EROI by estimating the effect of including the plant needed to enable energy supply from it taking into account its intermittency. For instance Weissbach et al. (2013) do this assuming that the lowest back-up cost option for this purpose, i.e., pumped hydro storage. The effects found are large; the wind EROI value falls from 16 to 3.9.
However, these values are of little or no use when it comes to estimating the EROI of a whole supply system. These systems are designed so that technologies can complement and substitute for each other as much as possible. If wind input falls for a period it might not be necessary to draw on any “buffering” capacity specifically provided for wind if solar or some other input happens to be high in that period. Thus it is not that in a whole system each component technology would need to come equipped with its own “buffering” capacity capable of allowing it to go on contributing despite no availability of its particular energy source. The way the problem is tackled in the main simulations is simply to provide one or a few back-up sources capable of topping up combined input from all components when necessary. System EROI can therefore be estimated using the “un-buffered” EROI values for each component along with that of the backup system.
Results.
This study begins by taking commonly stated EROI values for the main renewable technologies(…see Table 1), and derives a system EROI for a particular combination of these. As noted, some difficulties with these values will be considered later. The values to be used are close to those Hall (2017) gives in his review of the energy return field.
What capacities might be needed?
The following analysis will be based on the findings of the simulation of a 100% electricity supply carried out by Lenzen et al. (2015.) Though secondary to their main findings, they consider a case which “…might come close to what would be implemented in the real world.” Their Table 2 gives the capacities of various renewable technologies that would be needed to meet demand in this scenario. These add to 162 GW, about 7 times average Australian demand. Others arrive at significant multiples; for instance in their earlier simulation of Australian supply Elliston, Diesendorf and MacGill (2012) arrive at a multiple of 3.3, and Hart and Jacobson (2011) arrive at 4.3.
The use of biomass for energy supply is controversial, including questions to do with quantities available. Lenzen et al. note that if no biomass is to be used in the Australian situation total renewable capacity would have to be in far greater, in the region of 320 GW, 14 times average demand. However it is likely that use of “Turkey Nest” pumped hydro storage would be the best option. Substituting this for the contribution biomass makes in this case would not alter total system capacity needed.
Table1 below makes transparent the simple derivation of an overall system EROI given the quantities set out by Lenzen et al. for the scenario they describe.
Table 1: Derivation of a system embodied energy estimate.
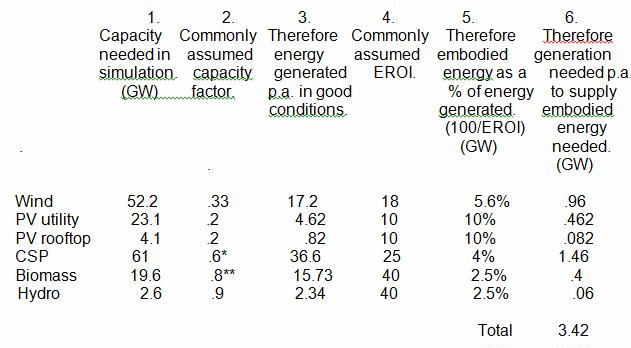
* Uncertain: Lenzen et al. assume 15 hour storage.
** Uncertain: Plant lifetime assumed to equal coal-fired plant.
These figures indicate that the embodied energy of the whole system corresponds to a constant flow of approximately 3.42 GW, or 26 TWh/y. Lenzen et al. report total system output at 287 TWh/y for the case being considered, corresponding to a constant flow of 32.7 GW. The EROI for energy generated would therefore be c. 32.7/3.41 = 9.6.
However this is not the most appropriate measure; what matters most is the energy cost in relation to the amount of energy needed and thus delivered for use. Lenzen et al. find that the system must spill 61 TWh/y, meaning that the ER value that is of most concern relates to the c. 220TWh/y the system would deliver for use. Thus the EROI of a system capable of meeting the average demand of c. 220 TWh/y or 25.1 GW would be 25.1/3.42 = 7.3. This means that in order to meet demand the amount of additional electricity that must be generated to cover embodied energy costs would be an amount more or less equal to 3.42/25.1 = 14% of demand.
This analysis does not include the energy cost of the extensive transmission system that the Lenzen et al., simulation found would be required to connect remote generating areas and demand sites across the nation.
There are reasons for suspecting that actual EROI values for the specific renewable technologies would be significantly lower than those used in column 1 of Table1 above.
Complications regarding capacity factors.
Debates over the EROI of renewables has focused almost exclusively on the denominator in the ratio, leaving concerns about the numerator almost largely unexamined. Central among these are the actual generating conditions and therefore capacity factors to assume. The convention is to assume capacity factors achieved in favourable conditions.
Table 2 in Lenzen et al. shows that except for PV the capacity factors achieved by the major renewables wind and CSP in the locations they occupy in the cost-minimizing solution are much lower than is commonly assumed. For instance the figure for wind is 0.18 whereas the usually quoted figure is 0.33 – 0.4, and for CSP it is only 0.26 despite the 15 hour storage assumed which should enable approximately three times that value in ideal conditions. This is because 100% renewable scenarios have to involve a mix of renewables and locations that will minimize overall system production cost while achieving the reliability standard all through the year. The resulting pattern requires many of the renewable components to be located at less than ideal sites. The task is to ensure that enough renewables are in sites that can contribute to meeting demand all through the year and during periods when all renewable input is low and at times when wind for instance is only at significant strength in a few locations.
This is the downside of common claim that “…the wind is always blowing somewhere.” It is, but if a system is designed to maintain input by locating many farms in many locations to ensure that enough are where wind is blowing at any time, then it is likely that there will be times when a few farms are providing the input and the rest are more or less idle. This means the capacity factor of the wind sector within a 100% renewable system will be much lower than normally assumed 0.33 – 0.4.
Thus the energy contributed by the wind sector in the Lenzen et al. case would be only around 0.18/0.33 = 55% of the amount that would be contributed had all the farms been located in the favourable conditions assumed for normal EROI estimation, and therefore the EROI of turbines in this “real-world” situation is likely to be in the region of 10, not the usually assumed18.
It is important to recognize that wind farms installed to date have probably not been significantly affected by this factor. They have been located at the best available sites for wind performance, not in the regions that will enable them to contribute to maintaining system output in difficult times even though these might not be ideal for wind. Despite this it is somewhat sobering to find that the world average capacity factor has been reported at 0.15. (Damn the Matrix, 2017.) This suggests that large scale development of wind energy in future will see movement to less ideal sites and thus an even lower value.
Another issue involved in the numerator of the EROI ratio concerns the lifetime assumed for renewable devices. These assumptions must be tentative as it will take time to provide confident data. For wind turbines and PV modules the assumption is often 25 to 30 years but some believe it is less than 20 years. (Damn the Matrix, 2017.) The decline in PV module output with age also affects life time output, (…although it is usually included in estimates of their “performance factor”.)
It is appropriate to compare the above renewable system value with that for existing fossil-fueled systems. About 90+% of the present Australian electricity supply system is made up of fossil-fuelled generators, and most of the rest is hydro. If an EROI of 40 is assumed for both, then the total system EROI would be about 40. Therefore the value for the renewable system arrived at above is less than one-fifth of this.
These issues to do with capacity factors also add to the case against the value of estimating “buffered” values for renewable technologies. They show that the EROI of a renewable technology depends primarily on what its role in a particular system is, especially on where it is located and the extent to which it is called upon to maintain system performance in conditions that are less than ideal for it. In Europe where there might be no solar contribution for long periods in winter, along with calm conditions providing little wind, capacity factors for very large wind or solar sectors spread over less than ideal sites would probably be quite low.
In addition renewable systems must spill energy (even with hydrogen or PHS storage; see Trainer 2017b) and the effect of this cannot be estimated from preconceived “buffered” values for each component technology.
To summarise, when interpreting standard EROI values it needs to be kept in mind that these assume output in good conditions, but output in the locations and conditions in which various technologies must be placed in order to play their role in a renewable system may well be around half as high.
The significance of CSP efficiency on system EROI.
In the above case taken from Lenzen et al. CSP is called upon to make a major contribution, providing 59% of energy generated. It’s role is especially significant In their Fig. 5 illustration of how the system arrived at would get through the worst five days in the year. This task required about 1,680 GWh, 61 % of supply, to come from CSP plus biomass storage, and (from inspection of the plot) CSP made up just over half of this of this, averaging c. 15.6 GW and rising to 19.4 GW for a time. It is therefore important to consider reasons for suspecting that this very significant contribution would have required far more capacity than the simulation found to be necessary.
In view of the complexity of the modeling task it made sense for the simulation not to take into account embodied energy costs or to delve into the unsettled issue of the efficiency of CSP in poor conditions. Trainer (2017b) explored the efficiency question and found that the effect evident in data from various studies was likely to be large; in fact it could mean that to get through difficult periods in winter would require three or more times as much CSP capacity as the simulation found to be necessary.
If this is correct it would show that meeting demand would require significant upward revision of the amount of renewables the approach Lenzen et al. estimated to be sufficient, and this would markedly reduce the 7.3 system EROI value derived above.
How sound are the EROI values used above?
There are reasons for thinking that the EROI values assumed above and set out in Table 1 are much too high, i.e., favourable to renewables. Unfortunately there has been relatively little study of EROI values for renewable plant apart from PV and even in that case there is intense debate. The EROI field in general is unsettled and difficult to interpret, especially in view of differing definitions and items included in embodied energy tallies.
The main issue has been the “boundaries” that should be set when deciding which energy costs to include. For instance in addition to the energy used in the factory making PV panels energy is used “upstream” to make the refineries etc. providing the aluminum. Should the energy used to make the bulldozers that mined the alumina that eventually went into module frames be included? Should the worker’s clothes, and the energy used in their travel to the factory be included?
In addition there are many “downstream” energy costs and losses, including losses in transmission and in inverters, breakdowns, dust on panels, poor maintenance and alignment etc. Prieto and Hall (2013) demonstrate the marked effect of drawing relatively wide boundaries. In their study of the Spanish PV system they list many factors that detract from the useful energy delivered by the system and when several but not all of these are taken into account they find that the system EROI is not the commonly claimed 8 – 14 but around 2.4.
It can be argued that there should be no dispute or confusion regarding the concept or definition of EROI or where to draw boundaries. The core question is, what is the total amount of net energy a technology can deliver, and therefore all factors detracting from this should be taken into account, meaning that in principle no boundaries should be set. They only become relevant and important in the practical task of getting actual measures. At some point it will be too inconvenient or impossible to estimate energy used far “upstream”, or what the fraction of energy used at some point (e.g., in producing the bulldozer) should be accounted to module production. (The fact that had the worker not been producing PV modules the energy cost of his clothes or tools or lunches would still have been paid if he had been working on something else, is irrelevant; these were costs of module production.) In other words, at some point in the path upstream an inevitable “truncation” in the chain of cost factors taken into account will occur, and the sum of those cut out of consideration could be significant. (For steel production Lenzen and Dey (2000) estimate that 50% of actual costs might not be included.)
It would seem therefore that total system EROI studies should follow the Prieto and Hall approach to the Spanish PV system, attempting to use the widest possible boundaries. Many of the (relatively few) pronouncements on wind and CSP values are either clearly not based on wide boundaries (at times only the embodied energy of construction materials is included) or no information is given on factors included. The fact that when Prieto and Hall attempted to take into account (almost) all possible costs and losses in a whole system and arrived at an EROI value less that one-third the commonly stated value for PV modules suggests that when similarly inclusive studies are carried out for wind or CSP farms values reported will be significantly lower than those in column 2 of Table 1 above.
Conclusions and policy implications.
This has been a tentative first exploration of what seems to have been a neglected issue and its main value might be in indicating the kind of analysis that needs to be carried out more thoroughly. Nevertheless its findings add difficulties to the quest for 100% renewable supply.
Hall, Balough and Murphy (2009) are among those who have considered the minimum EROI for an energy supply system that would enable rich world societies to maintain their present levels of economic and cultural activity. Although quite speculative at this point in time, the estimates ventured tend to be around 7 -10.
The total system EROI for rich societies is presently estimated by people like Hall (2017) to be in the region of 18, which means that if 18 units of energy are produced a net 17 are available for use. If a renewable supply involved a fall of EROI to 7.3 then the amount of net energy available for use per unit produced would be only 6.3/17 = 37% of the present amount. This suggests that the critical level would be well above 7.
Trainer (2017a) outlines a case that 100% renewable supply of all energy, including the 80% that is not presently in the form of electricity, would be unaffordable. That case was based on the dollar costs associated with the Lenzen et al. study which did not take into account any embodied energy costs. Taking them into account appears from above to increase the amount that needs to be generated by 3.42/25.1 = 14%. This in turn suggests that the 20c/kWh production cost Lenzen et al. arrive at would rise to 23 c/kWh. Trainer (2017c) lists 10 factors operating on production cost that the study did not deal with (e.g., added cost for remote area construction, a higher cost now for imported components…) and when the four that could be quantified were taken into account production cost was multiplied by 2.3. This indicates a production cost of 52.4 c/kWh when embodied energy costs are included, and adding distribution and related costs might bring the retail price to 74 c/kWh, around three times the price at the time the study was carried out.
Electricity makes up only 20% of total energy demand, but to provide the other 80% from renewable sources would involve more than scaling up production by four, given the need to convert electricity to other energy forms and the energy inefficiency of doing this. It would also involve embodied energy costs for conversion equipment, such for hydrogen production, pumping and storage. If the embodied energy costs of 100% renewable systems are in the region of those arrived at above then including these would add significantly to the weight of the case that 100% renewable energy supply is unaffordable.
These issues set formidable policy problems and choices. This study and that of Trainer (2017a) add to the grounds for thinking that 100% electricity supply for Australia would be at least severely economically disruptive and that 100% total energy supply would not be affordable. If so it would seem that the energy problems being encountered can only be solved on the supply side by an extremely large commitment to fourth generation breeder reactors. The alternative, on the demand side, is De-growth. A core claim of The Simpler Way project (2017) is that a sustainable and just society based on 100% renewable energy supply is desirable and could be easily achieved, but only if there is a radical transition to new settlement patterns, economies, political systems, and most difficult of all, new values and non-affluent conceptions of the good life.
REFERENCES
Damn the Matrix, (2017), Questions about EROI at researchgate.net 2015-2017l, 29th May. https://damnthematrix.wordpress.com/2017/05/
Elliston B., Diesendorf, M., and I. MacGillll, (2012). “Simulations of scenarios with 100% renewable electricity in the Australian National Electricity Market”, Energy Policy, 45, 606 – 613.
Hall, C. A. S., (2017), Energy Return on Energy Investment, Dordrecht, Springer.
Hall, C. A. S., S. Balogh, S. and D. J. R. Murphy, (2009), “What is the minimum EROI that a sustainable society must have?”, Energies, 2, 25–47.
Hart, E. K., and M. Z. Jacobson, (2011), “A Monte Carlo approach to generator portfolio planning and carbon emissions assessments of systems with large penetrations of variable renewables”, Renewable Energy, 36, 2278 – 2286.
Lenzen, M., and C. Dey, (2000), “Truncation error in embodied energy analyse of basic iron and steel products”, Energy, 25, 577 – 585.
Lenzen, M., B. McBain, T. Trainer, S. Jutte, O. Rey-Lescure, and J. Huang, (2016), “Simulating low-carbon electricity supply for Australia”, Applied Energy, 179, Oct., 553 – 564.
The Simpler Way Project, (2017), thesimplerway.info/
Trainer, T., (2017), “Can renewables meet total Australian energy demand: A “disaggregated” approach”, Energy Policy,109, 539-544.
Trainer, T., (2017) “Some difficulties in storing renewable energy”, Energy Policy, (In press.)
Weißbach, D., G. Ruprecht, A. Huke, K. Czerski, S. Gottlieb, A. Hussein,
(2013), “Energy intensities, EROIs (energy returned on invested),
and energy payback times of electricity generating power plants”, Energy, 52, 210-221.
3 Responses to Renewable EROI must include storage, low capacity factor, wide boundaries