Energy Watch Group. March 2013. Fossil and Nuclear Fuels – the Supply Outlook (172 pages)
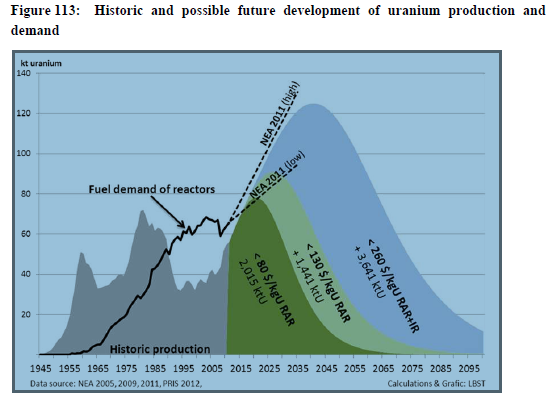
Uranium production peaks for the same reasons as oil, coal, and natural gas: the depletion of easy and cheap to develop mines. EWG’s guess is peak will happen between 2020 and 2035.
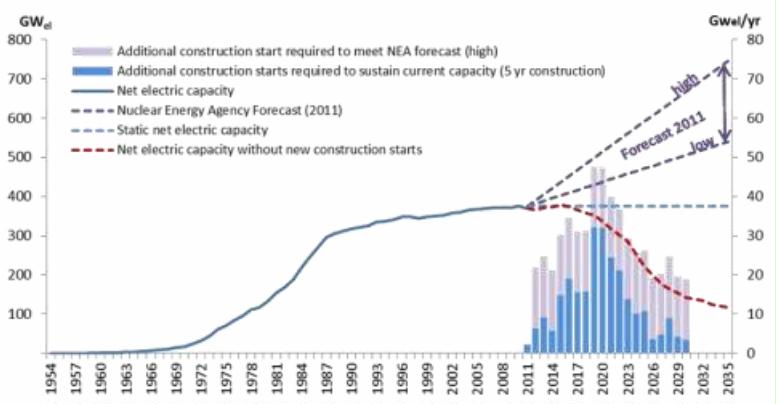
150 reactors have already been shut down. The 437 reactors still in operation are an average of 26 years old. The average operation time of reactors already shut down was 23 years, even though some reactors achieved operation time s close to 50 years. For the scenario projections , it is assumed that reactors now in operation will on average be shut down after 40 years of service. If no new reactors were constructed, global nuclear capacity would decline by about 70% until 2030 (red broken line in Figure 23). The figure also shows how many new reactors must be grid connected each year just to keep electric power capacity constant (blue bars). This would require a substantial increase in new construction starts with up to 30 GW/yr of total new capacity, plus 7 GW of new construction to match the low scenario forecast by NEA 2011 (lower purple broken line). In order to match the high forecast by NEA 2011, more than 15 GW would need to be added a year (pink bars which correspond to the upper purple broken line).
Figure 23: Historical development of nuclear power capacity and scenario until 2035. Source: International Atomic Energy Agency (PRIS), September 2012
Nuclear Power Plants Worldwide
435 operational reactors allocate a total net electric capacity of 370 GW
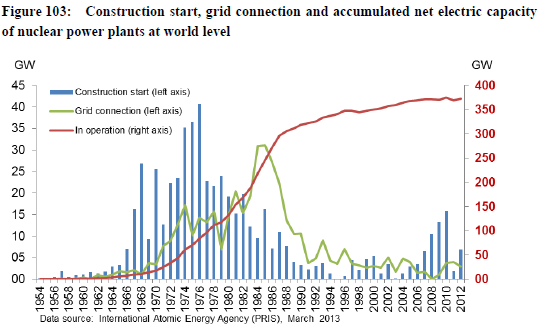
- Green Line: net electrical capacity of plants connected to the grid.
- Red line (right axis) accumulates the net capacity of all operational nuclear power plants worldwide.
- Blue Bars: construction starts
In recent years the construction start of nuclear power plants has gained momentum. Since 2006, the construction of reactors with an additional capacity of 48 GW started. Currently a total of 62 GW are under construction including 10 GW of electric capacity with a construction start prior to 2000. Some of those reactors are under construction since the 1980s. If and when this 10 GW reactor capacity will ever go online is very uncertain. The capacity which was shutdown each year is not shown.
The service life for most reactors is between fifteen and forty years. Today the majority of the reactors (and capacity) in operation are more than 25 years old. Only 10 percent of the net electrical capacity is below 20 years of age. This means that the majority of operating reactors will be shut down permanently within the next two decades.
China, Russia, Korea (Rep. of) and India account for 85 percent of the net electrical capacity being under construction right now (not counting construction starts prior to 2000). With a share of over 50 percent, China is currently constructing the largest capacities. The European share (without Russia) adds up to only 6 percent.
To sustain the current net capacity of 375 GW about 250 GW (equalling 66 percent of current global capacity) have to be added until 2035.
The additional required capacity can be supplied either with newly constructed reactors, and/or the prolongation of the life-span of operating reactors, and/or the reactivation of existing reactors currently having the status “longterm shutdown”. The capacity that can be supplied from long-term shutdown reactors is minimal and amounts to only 3 GW (five reactors, shutdown since 1995 and 1997). If the average reactor lifespan is extended from the assumed 40 years to an average of 50 years, the need to construct new reactors is reduced by 95 GW until 2035. With an extended reactor lifespan of 50 years a total of about 150 GW have to be constructed until 2035 to keep the nuclear electricity production at current level.
Assuming a construction time of 5 years, on average the construction of 8 GW per year (50 years reactor lifetime) respectively 14 GW/a (40 years reactor lifetime) has to commence every year between 2012 and 2030 in order to sustain the current production level. To meet the NEA 2011 low case scenario, on average every year a capacity of between 17 GW/yr (50 years reactor lifetime) and 22 GW/yr (40 years reactor lifetime) has to be added.
Future uranium demand and supply
The NEA 2011 forecast on nuclear power capacity (540 GW in the low case, 746 GW in the high case) leads to a uranium fuel demand between 95 and 130 ktU/yr in 2035. Assuming a linear capacity growth, a total of 2,000 to 2,500 kt uranium are needed until 2035 to power all reactors. The reasonable assured resources with extraction costs below 80 $/kgU are not sufficient to meet this demand. If the uranium supply is extended to the cost category <130 $/kgU RAR, this would be barely enough to meet the fuel demand in the NEA low case scenario for the next 10 – 20 years.
Figure 113 shows the fuel demand for both NEA 2011 forecasts. The dark green area indicates the possible future uranium production from Reasonable Assured Resources with extraction costs below 80 $/kgU. The light green area indicates additional uranium (+ 1,441 kt RAR) that can be produced at cost of 80 to 130 $/kgU. The blue area shows the maximal amount of additional fuel (+ 3,641 ktU) that can be produced at costs below 260$/kgU while also including Inferred Resources.
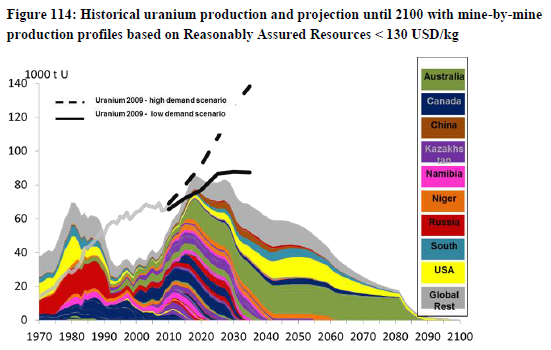
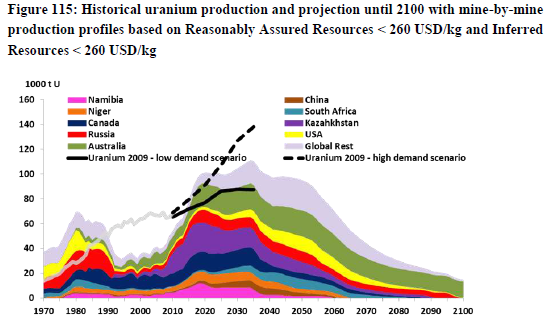
EWG’s best guess at likely uranium production is somewhere in between Figure 114 and 115 (My comment: but with oil having peaked in 2012 and being needed to grow food rather than mine uranium, and the likelihood aging plants will have a meltdown or other major disaster like Fukushima, means that far fewer nuclear plants are likely to be built than forecast, and far less uranium mined as well):
ccccccc

