[ Tar sand production is peaking now in 2016 due to low oil prices, but even when oil prices go back up again, tar sands are one of the most expensive unconventional oil reserves to produce, and perhaps last in line for future development, and the first to go down again when prices go so high that another depression results.
Canadian oil sands contributed 2.1 Mb/d of oil in 2014 (2.7 % of world oil production).
There are about 170 billion barrels thought to be recoverable, equal to 6 years of
world oil consumption. But even if there were a crash program to ramp up production as quickly as possible, production would likely peak in 2040 at 5–5.8 Mb/d (NEB. 2013. Canada’s energy future, energy supply and demand to 2035. Government of Canada National Energy Board; Soderbergh, B., et al. 2007. A crash programme scenario for the Canadian oil sands industry. Energy Policy 35.)
Alice Friedemann www.energyskeptic.com author of “When Trucks Stop Running: Energy and the Future of Transportation”, 2015, Springer]
David Hughes. July 17, 2015. Opinion: Is B.C.’s natural gas bounty for LNG export real or imagined? The Vancouver Sun.
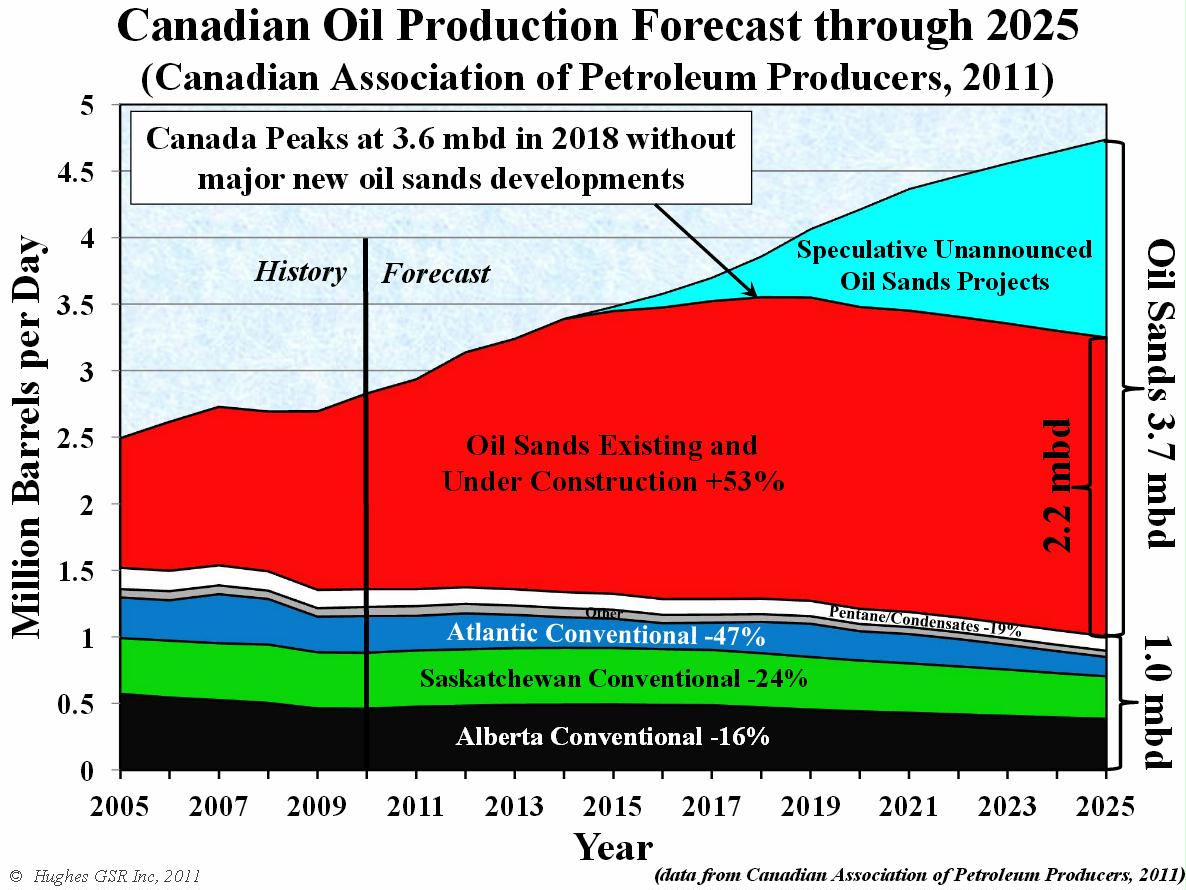
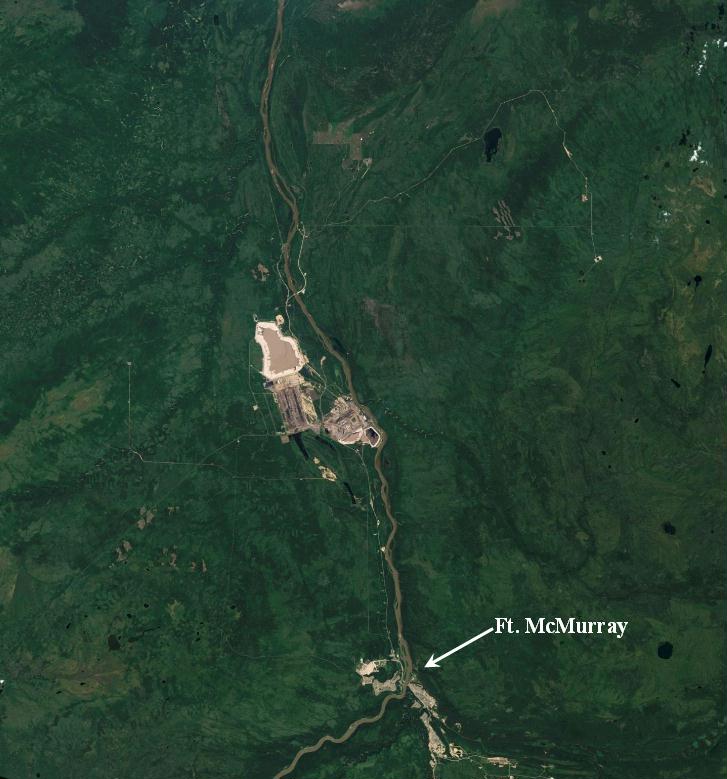
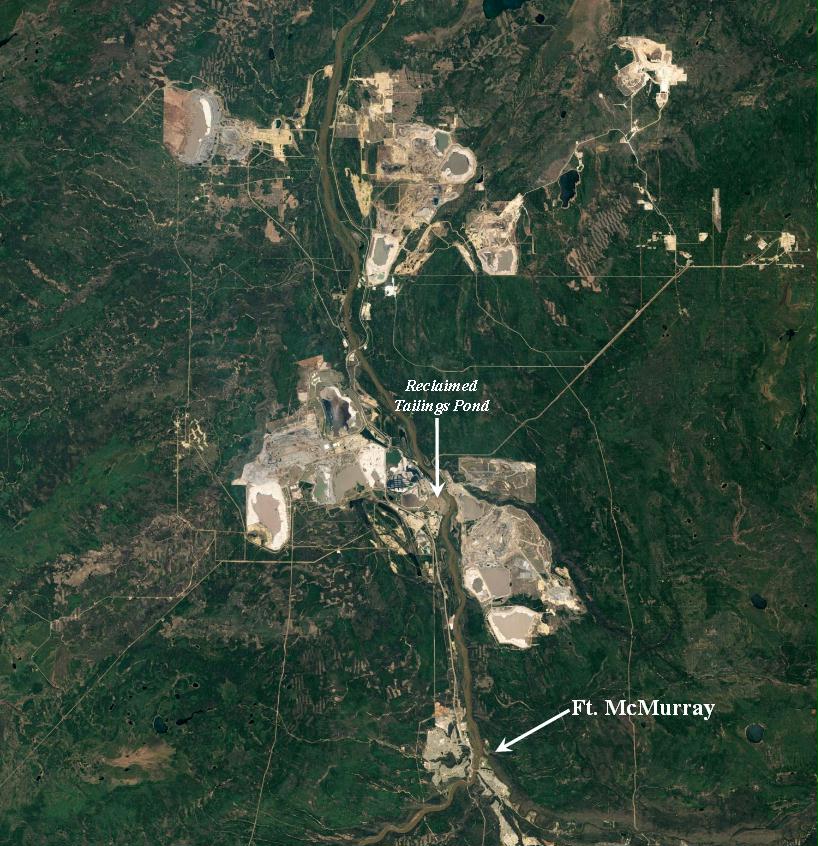
Oil Sands peak 2018 @ 3.6 Mb/d + photos 1984 & 2011
OIL SANDS GROWTH 1984-2011 A Visual Chronology – and Forecasts for the Future
Canada Peaks at 3.6 mbd in 2018 without major new oil sands developments
The Oil Sands Footprint from Space SO FAR


