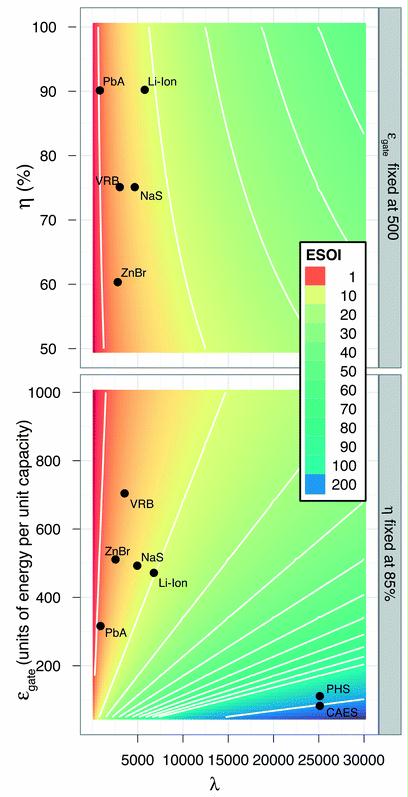
Fig. 6 Two contour plots show how ESOI depends on cycle life (x-axis), efficiency (y-axis of upper plot) and embodied energy (y-axis of lower plot).

← Utility scale energy storage doesn’t scale up: limits to minerals and geography
Fig. 6 Two contour plots show how ESOI depends on cycle life (x-axis), efficiency (y-axis of upper plot) and embodied energy (y-axis of lower plot).
Proudly powered by WordPress.
Weaver by WeaverTheme.com
|