
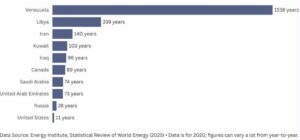
Venezuela has an incredibly high oil reserves-to-production ratio
This is calculated b dividing proved oil reserves by its annual production. That tells us how many years proved reserves would last if production stayed constant, and no new reserves were discovered or became economic. Since these numbers can change it shouldn’t be interpreted as the number of years before the country “runs out”. Source: Ritchie H (2026) Five(ish) charts that give some context to Venezuelan oil.
Preface. This is from Perplexity after I grew frustrated trying to explain why
Some experts distrust the oil R/P (reserves‑to‑production) ratio because it is a static, accounting-style snapshot that hides huge uncertainties and dynamics in both the numerator (reserves) and the denominator (production), so it has misled people many times about how long oil will actually last. It is mainly a backward‑looking stock/flow indicator, not a model of depletion physics, field decline, economics, or politics.[1][2][3][4][5]
What the R/P ratio actually is
- The R/P ratio is simply proved reserves divided by current annual production, often interpreted as “years of supply remaining at today’s rate.”[2][6]
- Historically, this number has stayed in the same ballpark for decades even as cumulative production rose, which shows it is not a countdown clock to “running out of oil.”[7][2]
Problems with the “R” (reserves)
Proved reserves are estimates, not directly measured quantities; they change with price, technology, and reporting rules, sometimes swinging dramatically over a few years.[3][5][7]
Many reserves are reported by national oil companies with little transparency and strong political incentives, so headline reserve figures—especially in some OPEC states—may be strategically inflated, making the R/P ratio look reassuringly high.[8][5][9][1]
Problems with the “P” (production)
Production is cyclical and path‑dependent: fields and basins follow discovery, buildup, plateau, and decline curves; using one year’s flow as if it were constant for decades ignores depletion physics and investment cycles.[4][5][7]
If a country deliberately under‑produces (for price or risk‑aversion reasons), its R/P can soar to 50–100 years, which signals low production intensity rather than genuine security or huge remaining potential.[5][8]
Why R/P misleads about future supply
A “40–50 years of oil left” R/P has repeatedly coexisted with growing reserves and production, so simple extrapolation of R/P has generated false “we will run out by year X” predictions since early in the oil industry.[2][3]
The ratio ignores decline rates, project lead times, and flow constraints: the world can hit a production plateau or decline while the R/P ratio still appears comfortable, because the issue is maximum sustainable flow, not just remaining stock.[10][4][7]
Better uses and alternatives
At company or basin level, R/P can be a rough indicator of how aggressively assets are being produced or whether reserves are being replaced, but even there it is used with other metrics like reserve‑replacement ratio and decline analysis.[11][12][4]
For long‑term oil security, experts tend to rely on discovery and production histories, field‑level decline modeling, URR estimates, cost curves, and scenario analysis, viewing R/P at best as a crude, supporting indicator rather than a trustworthy predictor.[4][7][5]
- https://visualizingenergy.org/is-the-reserve-to-production-ratio-for-fossil-fuels-a-meaningful-indicator/
- https://en.wikipedia.org/wiki/Reserves-to-production_ratio
- https://www.investopedia.com/terms/r/reserves-to-production-ratio.asp
- https://www.facetsjournal.com/doi/10.1139/facets-2017-0097
- https://www.sciencedirect.com/science/article/pii/S2666049022000524
- https://energyeducation.ca/encyclopedia/Reserves/production_ratio
- https://www.bbvaresearch.com/wp-content/uploads/mult/WP_0905_tcm348-212932.pdf
- https://www.iaee.org/en/publications/newsletterdl.aspx?id=636
- https://pmc.ncbi.nlm.nih.gov/articles/PMC7184024/
- https://carbontracker.org/reports/the-decline-rate-delusion/
- https://blog.gorozen.com/blog/the-incredible-shrinking-oil-majors
- https://rbnenergy.com/daily-posts/blog/ma-drove-2024-ep-reserve-replacement-surge-organic-growth-lagged
- https://www.linkedin.com/posts/abdulghani-jaghman-09243229_what-is-the-reservestoproduction-r-activity-7354856010232004608-c2JU
- https://www.linkedin.com/pulse/what-makes-pe-unreliable-metric-sachin-shah
- https://www.reuters.com/markets/commodities/us-oil-producers-face-new-challenges-top-oilfield-flags-2025-03-27/