Notes from 41 page: National Petroleum Council. 2012. Chapter 11: Hydrocarbon Liquids.
Hydrocarbon liquids have properties that make them high-quality transportation fuels and allow the supply chain to operate at large scale and efficiency, which reduces cost. A well-established distribution system ensures widespread availability.
The supply outlook for the United States and North America has improved in recent years. Oil production in the United States and Canada is expected to continue to increase with unconventional oil from tight oil, heavy oil, and oil sands playing an increasing role.
U.S. oil imports have decreased since 2005 and are forecast to continue to decline slowly to 2035. Key factors in reducing imports are recent reductions in demand, limiting future demand growth, and increasing U.S. oil and biofuels production.
Canada is the largest source of U.S. imports and is expected to become even more predominant in the future.
Long-term development of alternative hydrocarbon liquids (gas-to-liquids, coal-to-liquids, oil shale) will require higher prices than are currently forecast, unless capital costs are reduced significantly.
The refining industry should be able to manage changes in product demand over time.
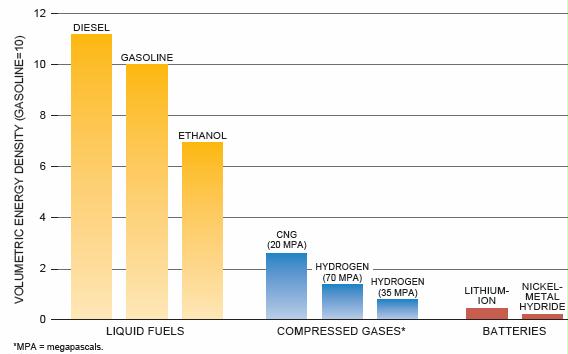
Hydrocarbon liquids have unique properties that make them high-quality transportation fuels. One of the most significant properties is energy density, which is compared to other transportation energy sources in Figure 11-1. Other desirable characteristics include: Liquid form, easy to transport Adjustable combustion characteristics for use in a wide range of engines
The scale of the supply chain is large and touches every corner of the country. For example, approximately 168,000 miles of pipeline combine to deliver crude oil from producing fields and import hubs to refineries and products from refineries to distribution terminals. This infrastructure combined with linkage to an even larger global supply chain provides efficiency and diversity. Due to ease of transport, hydrocarbon liquids can be shifted globally and regionally in response to market forces and disruptions.
U.S. transportation fuel demand is approximately 14 million barrels per day (MMB/D). According to the Energy Information Administration’s (EIA) Annual Energy Outlook 2010 (AEO2010), gasoline for light-duty vehicles is 61% of the total. Although biofuel volumes have grown, petroleum-based hydrocarbons represent more than 95% of current supply on an energy content basis.
Unconventional oils are petroleum liquids not historically available to the supply chain due to low quality or restricted flow. Unconventional oil sources were traditionally more expensive than conventional resources but due to increasing oil price and technology improvements are becoming more competitive. Development of new unconventional oil plays is having a large impact on the U.S. supply chain leading to increased supply and investment. Unlike conventional oil, unconventional resources are most heavily concentrated in North and South America. North American unconventional resources include Canadian oil sands, Canadian heavy oil, U.S. oil sands, Canadian and U.S. tight oil, and U.S. oil shale.
The Venezuela Orinoco Heavy Oil Belt the predominant unconventional resource in South America. Application of technology is improving the prospects for development of unconventional oil, and such resources are playing an increasing role in North American oil production. The reader is referred to the 2011 NPC report for a more complete analysis on unconventional hydrocarbon supply and demand.
The process energy efficiency in converting natural gas to liquid products is 58–65%. There are GTL plants operating in Malaysia, South Africa,
Natural gas can also be converted to other transportation fuels such as methanol, dimethyl ether (DME), or methanol-to-gasoline (MTG). Both methanol and DME require significant fueling and vehicle infrastructure investments, which makes them less attractive than other liquid fuels produced from natural gas.
Methanol can also be used as a high-level blend with gasoline, but requires more extensive vehicle upgrading for use in a flexible-fueled-vehicle than ethanol. Since U.S. gasoline fuels currently contain up to 10% ethanol, addition of methanol would result in excessive fuel oxygen content. Therefore methanol would likely displace ethanol in the gasoline blend.
DME has high cetane and can substitute for diesel in compression ignition engines but would require significant vehicle and distribution infrastructure addition due to high vapor pressure (similar to LPG) and use of pressurized tanks.
Alternative hydrocarbon liquids can also be derived from coal. There are two main technologies available for coal conversion: indirect and direct liquefaction. Indirect liquefaction is similar to GTL. Coal is transformed into synthesis gas and then converted to liquid hydrocarbon fuels using the processes described above (FT diesel, MTG, methanol, DME). The direct liquefaction process shown in Figure 11-10 involves addition of hydrogen to coal to increase the hydrogen-to-carbon ratio from ~0.8 in coal to ~1.8 typical of various petroleum products. The potential for CTL is contingent on a number of factors: coal and petroleum prices, risk threshold, capital cost, and return on capital requirements. Coal is generally the least expensive fossil fuel but capital costs for CTL are higher than GTL due to extra steps needed to convert solid coal to synthesis gas.
Combined coal- and biomass-to-Liquids (cbtL). In this process, mixtures of coal and biomass are converted into liquid transportation fuels. The plant operates like a CTL plant except that biomass is gasified in addition to the coal. Coal provides the necessary scale, which improves economics compared to stand-alone biomass-to-liquids processes. Consolidating and transporting biomass is expensive, so the biomass fraction is generally limited to 15% of total input.
Liquid hydrocarbon fuels must have known and consistent properties for specific types of combustion systems.
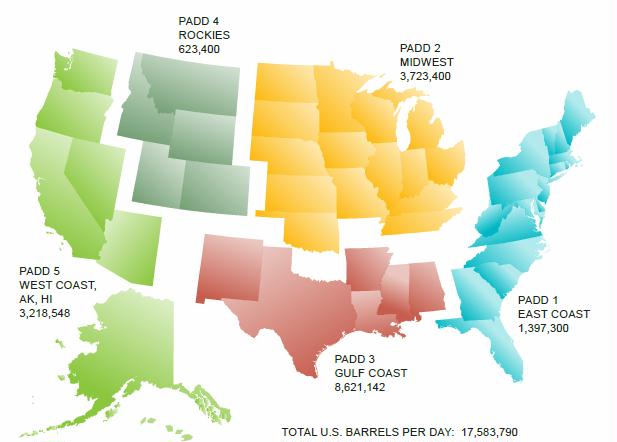
Note: During World War II, the then-War Department delineated PADDs to facilitate oil allocation.
Source: U.S. Energy Information Administration, “Number and Capacity of Petroleum Refineries,” as of January 1, 2010.
TOTAL U.S. BARRELS PER DAY: 17,583,790
Figure 11-23. Fuel Refining Capacity by Petroleum Administration for Defense District
(Barrels per Day)
The refining industry also plays a role in other industrial value chains: asphalt for road construction and roofing, lubricants for use in transportation and industry, high-quality petroleum coke for use in the metals industry, waxes, solvents, and other products.
Many of these specialty products are difficult to manufacture and highly specialized.
Refinery processes can be divided into six categories: Separation of Crude Oil. 1. Separates crude into Restructuring Hydrocarbon Molecules. 2. Restructuring processes change molecular size or structure in a variety of ways. Some processes break apart bigger molecules while others combine small gas molecules to make liquids, and others change molecular structure. Treating. Examples are listed in Table 11-1.3. Treating processes are used to remove contaminants such as sulfur, nitrogen, and heavy metals, which are present in crude oil, blending Hydrocarbon Products. from various streams.
Refinery units are carefully integrated to provide high product yield with minimum waste and energy consumption. While each refinery is unique, refineries can be classified into three broad groups based on processing complexity, which in turn determines ability to convert crude oil into lighter transportation fuels. Hydro-skimming refineries contain a crude oil distillation unit (CDU) and naphtha reformers, which increase gasoline octane and produce hydrogen that can be used in desulfurization units. Medium conversion, or cracking, refineries have the same elements plus fluid catalytic cracking (FCC) and alkylation units, which allows greater conversion of crude oil to transportation fuels. High conversion refineries also have cokers, hydrocrackers, and hydrogen plants, as shown in Figure 11-22. High conversion refineries are common in the United States and convert large proportions of crude oil feedstock to transportation fuels and have greater ability to upgrade heavy or sour crude oil. Integration and optimization becomes more important as the number of process streams increase. Modern refineries contain networks of sensors, logic devices, and computers to control and optimize the complex reactions and flows within and among process and for logistics and planning of crude oil inputs and product output. industry State Geographic Distribution.
Many streams are blended to make gasoline and other hydrocarbon products.
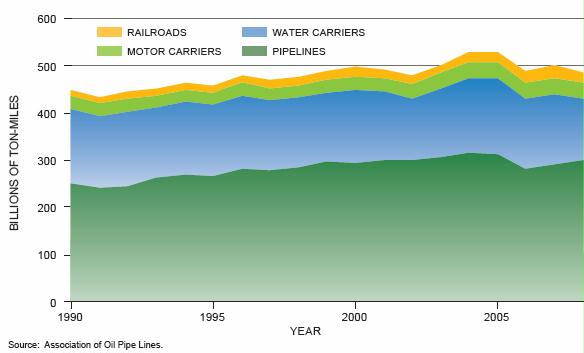
Approximately 75% of the existing pipeline infrastructure was constructed between 1940 and 1980. The average pipeline lifespan is 33 years (Humphreys). Pipelines accounted for 71% of all petroleum transportation in 2008, up from approximately 54% in 1990.
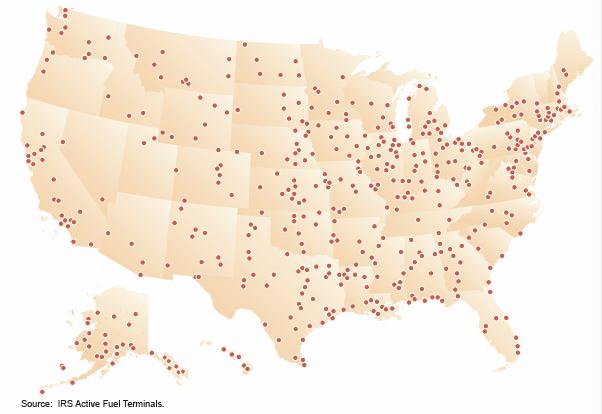
The Distribution of hydrocarbon liquid product terminals has grown to span the entire country, as shown in figure 11-26.
These terminals are located in demand centers and along pipeline routes to deliver hydrocarbon fuels and biofuels to the end customer. The legacy value of these terminals is significant, for a competing energy pathway to replicate this coverage and redundancy is a very large hurdle.
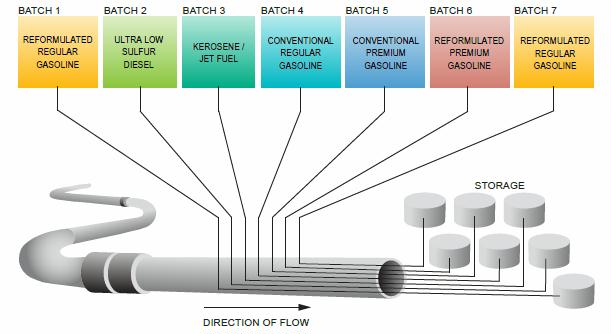
Depending upon the specifications of adjacent batches, it may be possible to downgrade the commingled product interface between two batches into a succeeding lower quality material (such as premium gasoline into regular gasoline). Downgrading from one batch to another cannot always occur. In those situations it becomes necessary to segregate the interface (called transmix) and arrange for it to be sent back to the refinery or other processing facility. Today, pipelines are controlled by the use of computers often referred to as programmable logic controllers (PLCs). The data from the PLCs are transferred by secured wide-area network to a centralized database. The data are then compiled and formatted in such a way that a control room operator can make decisions to start or stop the pipeline, adjust flow rates, raise or reduce the operating pressure, as well as open and close valves. The system of computers and the communications network is collectively referred to as a Supervisory Control and Data Acquisition (SCADA) system. The SCADA system can also feed various real time data into business computers to support pipeline scheduling, product accounting, and other business functions (Figure 11-29).
The volumes and the percentage of products transported within the Association of Oil Pipe Lines (AOPL) data do not include ethanol. Pipeline operators have been reluctant to ship ethanol, or gasoline-ethanol blends on a commercial scale due to ethanol’s corrosive properties and water solubility. Ethanol will clean the internal surfaces of a pipeline and can result in the pipeline becoming more susceptible to internal stress corrosion cracking, which is difficult to detect and manage. Likewise, ethanol has an affinity for moisture and is completely soluble in water. Water enters the pipeline system through terminal and refinery tank roofs and can be dissolved in fuels during the refining process. If the ethanol or gasoline-ethanol blend picks up water in the pipeline, it could “phase separate” resulting in off-specification product. An E10 gasoline-ethanol blend can typically contain up to 0.5 volume percent water at 60 F before phase separation occurs. Lesser amounts of water can induce separation at lower temperatures. Also, lower blend levels of ethanol such as 5.7% or 7.7% tolerate less water.
Trains, trucks, and water carriers are the primary means by which ethanol is transported from origin to market. The majority of the ethanol production is in the Midwest, with the heaviest demand along the East Coast, West Coast, and Southeast. In 2005, approximately 75% of ethanol produced was transported by rail. Implementation of the Renewable Fuel Standard calls for ethanol consumption to increase to 36 billion gallons (2.4 MMB/D) in 2022.
The ability to ship ethanol by pipeline or unit trains will be important to ensuring quick and affordable ethanol shipments. Unit trains are a more efficient mode of transportation than single manifest cars; however, the transportation of ethanol from trans-loading facilities to terminals by truck may become problematic in terms of highway congestion and air emissions. Technology improvements to address ethanol’s water affinity and corrosion issues could result in the wider use of pipelines to transport ethanol. The construction of new pipeline infrastructure or the expansion of existing pipeline infrastructure can be costly when considering right-of-way acquisition, intermediate tanks and terminals, as well as permits. Although this section of the report focuses on ethanol, the same issues are present when discussing the introduction, infrastructure, and logistics of other biofuels.
Conventional oil is increasingly located in remote areas or geographically concentrated in a few countries with large remaining resources. Access to these resources, technology development, and safe and environmentally sound operations are critical to meeting projected increases in demand. Unconventional resources are also important, with technology development to reduce cost and improve environmental Prudent Development performance an important challenge. The crude oil production profiles shown in Figure 11-19 foresee an increase in North American unconventional oil production. The crude oil slate shift will provide an incentive for upgrading of heavy crude oil in existing infrastructure. The most efficient disposition of this heavy crude oil production will likely be in existing high conversion refineries discussed previously in this chapter.
As the crude oil profiles change, so will the demand barrel as illustrated in the Reference and Alternative scenarios shown in Figure 11-31. The AEO2012 Early Release and the IEA outlooks show the potential pressure on refined gasoline from a volume and yield perspective due to light-duty fleet efficiency, increased biofuels, and growth in diesel for medium-/heavy-duty vehicles. The challenge for refining will be to make the product slates required by customer demands. Although the changes are substantial in some outlooks, they occur over a very long period, giving industry time to respond. The flexibility of the refinery fleet to manage this shift will be discussed in the next section.
Refinery Capability to Address Shape of Barrel Shifts
The U.S. refining industry has responded in the past to changing customer demand by shifting refinery yields.
Figure 11-31. Demand Shifts in Various Outlooks versus 2010
The result has been a higher overall yield of gasoline and diesel, with an increasing diesel fraction (see Figure 11-33).
The results of an EIA study show that U.S. refineries have the ability to increase annual average distillate yields on crude oil and unfinished oil inputs 3 to 5% with no or small investments for distillation improvements. There should be no near-term constraint in meeting slowly increasing distillate consumption, given the capability to adjust to market demands as evidenced in previous cycles and recent additions to capacity. In fact, distillate yield increases will likely enable U.S. refiners to increase distillate exports when economics are attractive.
According to the IEA’s 2010 World Energy Outlook, very large infrastructure investments will be needed globally to meet projected future oil demand, roughly $8 trillion over a 25-year period, as shown in Table 11-2. Most of the investment will occur outside OECD countries to find and develop new sources of oil production.
Spending in the United States is projected to be only 11% of the global total. The total cost of new infrastructure is roughly $10 per barrel produced and processed
Refinery capital investment will be required to: Upgrade capacity to meet increasing diesel demand Increase production of low sulfur distillate and marine fuel. Process heavy crudes over the 25-year outlook period.
Major service station components that may need to be upgraded include: fuel dispensers, pumps, piping, and storage tanks. A wide range of costs is possible, depending on service station design and how much equipment needs to be replaced. Replacing a single dispenser costs $17,000 to $40,000. To replace underground equipment involves permitting and higher costs. Costs for a single dispenser and storage tank range from $71,000 to $185,000. Costs would be higher to upgrade an entire station. A typical station has four or more dispensers and two or more storage tanks.
There were 161,000 service stations in the United States in 2008, equivalent to 0.65 fueling stations per 1,000 vehicles. A typical dispenser lifetime is 10 years, while a storage tank can last 30 years.
Fatty acid methyl ester (FAME) biodiesel are not currently blended in refineries or shipped in most pipelines. This increases transportation cost relative to gasoline and diesel.
To improve distribution economics, biofuels would require additional processing either in stand-alone units or potentially as a refinery feedstock. Use of biomass-derived feedstock in refineries raises a number of issues. First, such stocks contain significant amounts of oxygen that must be rejected as water that refineries are not designed to handle. Second, pyrolysis of biomass to produce bio-oil yields many unstable compounds that refineries are not designed to process or remove. Third, many bio-derived nitrogen and oxygen compounds are poisons to the catalysts employed in the refining process. In addition, removal of the nitrogen, oxygen, sulfur, and unstable compounds requires hydrogen, which will increase supply costs at a refinery.
These hurdles will limit the amount of biomass-derived feedstock existing refining infrastructure can handle.
Potential for Hydrocarbon Liquids Production from Coal and Gas Resources. The conditions under which a large domestic industry to convert gas, coal, and biomass to liquids (XTL) might develop were investigated. Because few such plants have been constructed worldwide, there is considerable long-term uncertainty in the economics of XTL relative to petroleum and the large potential resource.
There is a considerable range of estimates of capital costs for the GTL plants that have been built and for those still in construction or in the planning stage. This range is between about $35,000/daily barrel for the Sasol Oryx plant that was constructed over 5 years ago and about $200,000/daily barrel for the Escravos plant in Nigeria. The Escravos project is expected to cost $8.4 billion for 33,000 barrels per day of GTL liquids product, and is 70% complete (although it was originally expected to cost ~$3 billion). The large Shell Pearl GTL plant that has recently completed construction in Qatar will produce 140,000 barrels per day of FT fuels and about 120,000 barrels per day of natural gas liquids. This plant is expected to cost in the region of $18 billion. There are many reasons for this large range including plant size, location, timing, project scope, products, gas processing needed, financing assumptions, etc.
Figures 11-35 and 11-36 show estimates of the RSP of diesel fuel produced from CTL and CBTL plants sized to produce 50,000 barrels/day of diesel fuel and naphtha based on the capital costs Zeus Syngas Refining
Carbon capture and storage (CCS) is used to capture the carbon dioxide produced during the conversion process. Note that CCS has a moderate impact on plant costs representing about 10% of capital expense. The base CTL capital cost is assumed to be $150,000/daily barrel and the high Capex is $300,000/daily barrel. If the coal price is $1.50/million BTU (equivalent to about $35 per ton) the RSP on a crude oil equivalent basis would be $120/barrel for the base Capex. For the high Capex case it would be over $220/barrel. The base CBTL capital cost is assumed to be $157,000/ daily barrel and the red line shows the high Capex case ($314,000/daily barrel). If the coal price is $1.50/ million BTU (equivalent to about $35 per ton) the RSP on a crude oil equivalent basis would be about $130/barrel for the base Capex. For the high Capex case, it would be over $230/barrel. In all cases, the potential Supply curves for xtL biomass feedstock cost was assumed to be constant at $71/dry ton.
The assumptions regarding Capex have a large effect on the RSP and hence on the economic viability of CTL and CBTL. Note that coal provides the necessary scale, which improves economics compared to stand-alone BTL. Transporting biomass is expensive so a BTL plant would operate at much smaller scale and much higher $/barrel capital cost than the CBTL plant analyzed here.
Figure 11-37 shows estimates of the RSP of diesel fuel (crude oil equivalent basis) produced from a GTL plant sized to produce 34,000 barrels per day of diesel and naphtha from about 300 million standard cubic feet per day of natural gas. With natural gas at $5.00/million BTU, the cost for diesel from a GTL plant with a capital cost of $70,000/ daily barrel is estimated to be about $90/barrel. If natural gas prices escalate to $10/million BTU, then the RSP on a crude oil equivalent basis increases to about $130/barrel. Costs are much higher for the high Capex case.
Figure 11-38 shows two potential diesel fuel supply curves for XTL to 2050. The gold curve uses the low capital cost case, and red the high cost case. Both cases assume the AEO2010 Reference Case for oil, gas, and coal pricing. As discussed above, projected volumes are sensitive to capital costs and relative costs of petroleum, gas, and coal. In the low capital cost case, a sizeable XTL industry develops producing 2 MMB/D of diesel by 2050. This represents 65% of U.S. highway diesel in the Reference Case and 26% of all distillate and would have a significant impact on oil imports and refining. Using the AEO2010 price outlook, GTL is more economic than CTL or CBTL. Roughly 70% of the XTL is from GTL. However, under the high Capex case, no XTL is produced. As expected, forecast oil prices also impact projected volumes. With low oil prices, no XTL is produced under the low oil price case, while 3 MMB/D is produced under the high oil price scenario. Based on this analysis, XTL can be considered a backstop that could supplement petroleum under certain economic conditions.
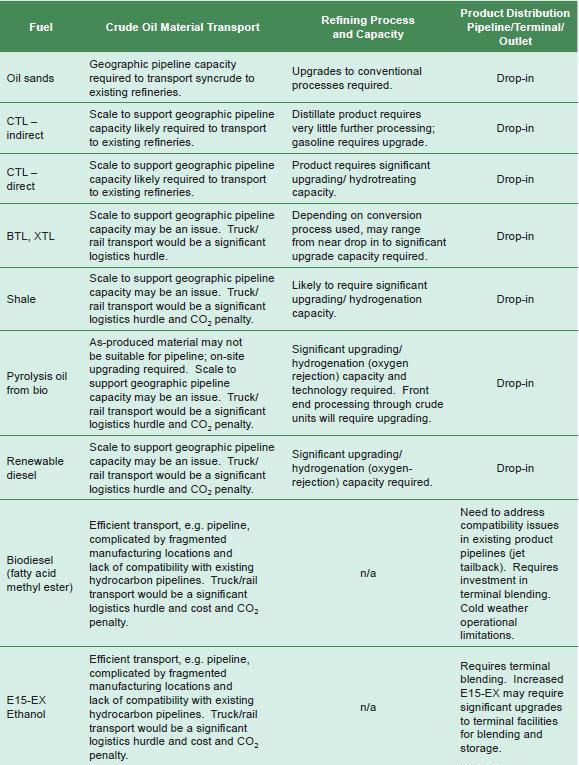
Production of alternative and renewable fuels will require varying levels of capital investment to integrate into the existing hydrocarbon fuels distribution system. This investment is above and beyond that required for fuel production and will depend upon whether the product meets current fuel specifications when used in existing infrastructure at high concentrations (neat) or as a blend product. Such fuels are referred to as “drop in” fuels. Specific capital required to establish alternative and renewable fuel manufacture is described elsewhere in this report. A qualitative summary of the infrastructure integration capital required for each fuel pathway is shown in Table 11-4.
Considering the large lower-cost resource base, and the legacy investment in refineries, existing infrastructure, and plentiful dispensing network, hydrocarbon liquids can be expected to continue to provide the majority of transportation fuel for the outlook period.
GHG emissions associated with use of hydrocarbon liquids are best analyzed on a well-to-wheel (WTW) basis, which includes emissions associated with production, refining, transportation, and use of hydrocarbon liquids. WTW GHG emissions for gasoline, as predicted by the GREET model, are shown in Figure 11-39. The petroleum life-cycle upstream of the vehicle is efficient and most of the energy content of petroleum is retained in the finished fuel such that over 80% of GHG emissions are associated with vehicle fuel use. Most of the remainder results from fuel production, which includes refining and product transportation. Feedstock production from crude oil production and transportation has the smallest emissions. As shown in Figure 11-39, improving vehicle efficiency can lower permile emissions significantly. Any reduction in demand reduces both vehicle and fuel-cycle emissions upstream of the vehicle.
References
Alberta Energy Research Institute. Life Cycle Emission Comparison of North American and Imported
Crudes. Prepared by Jacobs Consultancy and Lifecycle Associates, July 2009.
American Petroleum Institute. API RFS2 Comments, Attachment 4: E85 Retail Fueling Cost Study. 2009.
Association of Oil Pipe Lines and American Petroleum Institute. “In the Pipe” (newsletter). April 2006.
Association of Oil Pipe Lines. Liquid Pipeline Industry in the United States, Where It’s Been: Where It’s Going. April 2004.
Association of Oil Pipe Lines. Report on Shifts in Petroleum Transportation: 1990–2009. February
2012. http://www.aopl.org/pdf/AOPL_Shift_Report_Press_Release_Feb_7_20121.pdf.
Borensztein, Eduardo, and Carmen M. Reinhart. The Macroeconomic Determinants of Commodity Prices. University of Maryland. 1994.
BP. BP Statistical Review of World Energy. June 2011.
Clean Fuels Foundation and the Nebraska Ethanol Board. In cooperation with the U.S. Department of
Agriculture. E85 and Blender Pumps: A Resource Guide to Ethanol Refueling Infrastructure. 2011.
CME Group. The Role of WTI as a Crude Oil Benchmark. January 2010.
The Conference Board of Canada. “Getting the Balance Right: The Oil Sands, Exporting and Sustainability.” Briefing January 2010.
Congressional Research Service. Intermediate-Level Blends of Ethanol in Gasoline, and the Ethanol “Blend Wall.” October 2010.
Congressional Research Service. The U.S. Oil Refining Industry: Background in Changing Markets and
Fuel Policies. November 2010.
Europia. “White Paper on EU Refining.” 2011.
GREET Model: The Greenhouse Gases, Regulated Emissions, and Energy Use in Transportation
Model, Argonne National Laboratory. http://greet.es.anl.gov/.
Humphreys, S. June 2010. Economic Outlook Brightens For Pipeline Coating Developments. Pipeline and Gas Journal. Vol. 237 No. 6
Iandoli, Carmine L., and Signe Kjelstrup. “Exergy Analysis of a GTL Process Based on Low-Temperature Slurry F-T Reactor Technology with a Cobalt Catalyst,” Energy Fuels 21, no. 4 (2007):pages 2317-2324. http://www.chem.ntnu.no/nonequilibrium-thermodynamics/pub/176-Iandoli-EnergyFuels.pdf.
International Energy Agency. World Energy Outlook 2008.
International Energy Agency. World Energy Outlook 2010.
Japan Clean Air Program (JCAP). 4th JCAP Conference, June 1, 2005, Session 2 “3. CO2 Emissions
Study Workgroup Report.” http://www.pecj.or.jp/english/jcap/jcap2/jcap2_4th.html.
Japan Clean Air Program (JCAP). 5th JCAP Conference, February 22, 2007, Session 1, “2. Gasoline
Work Group Report.” http://www.pecj.or.jp/english/jcap/jcap2/jcap2_5th.html.
Jessen, Holly. “Riding the Rails.” Ethanol Producer Magazine. October 2006.
Kheshgi, Haroon S., Hans Thomann, Nazeer A. Bhore, Robert B. Hirsch, Michael E. Parker, and Gary
Teletzke. “Perspectives on CCS Cost and Economics,” SPE International Conference on CO2 Capture,
Storage, and Utilization, New Orleans, LA. November 2010.
Laboratory for Energy and Environment, MIT, Factor
of Two: Halving the Fuel Consumption of New US
Automobiles by 2035, 2007.
National Academy of Sciences, National Academy of Engineering, and National Research Council of
the National Academies, Liquid Transportation Fuels from Coal and Biomass: Technological Status,
Costs, and Environmental Impacts. 2009.
National Association of Convenience Stores. Challenges Remain Before E15 Usage is Widespread.
2011. http://www.nacsonline.com/NACS/Resources/campaigns/GasPrices_2011/Pages/
ChallengesRemainBeforeE15UsageIsWidespread.aspx.
National Energy Technology Laboratory and U.S. Department of Energy, Affordable, Low-Carbon
Diesel Fuel from Domestic Coal and Biomass, DOE/NETL 2009/1349. 2009.
National Petroleum Council. “Appendix C: History and Fundamentals of Refining Operations.” In U.S.
Petroleum Refining. June 2000.
National Petroleum Council. “Appendix D: The U.S. Petroleum Distribution System (A Tutorial).” In U.S. Petroleum Refining. June 2000.
National Petroleum Council. Hard Truths: Facing the Hard Truths about Energy. 2007.
National Petroleum Council. Prudent Development: Realizing the Potential for North America’s Abundant Natural Gas and Oil Resources. 2011.
National Petroleum Council. U.S. Petroleum Refining – Assuring the Adequacy and Affordability of Cleaner Fuels. 2000.
Petroleum Equipment Institute. Compatibility Assessment Survey. 2008.
Shell (website). “Pearl GTL: An Overview.” 2011. http://www.shell.com/home/content/aboutshell/
our_strategy/major_projects_2/pearl/overview/, and references in that website.
Solomon Associates, private communication.
U.S. Department of Energy, Alternative Fuels Data Center (website). “Propane.” http://www.afdc.
energy.gov/vehicles/propane.html.
U.S. Department of Energy, Oak Ridge National Laboratory, “Chapter 4” in Transportation Energy Data Book. http://cta.ornl.gov/data/chapter4.shtml.
U.S. Energy Information Administration. “Atlantic Basin Refining Dynamics from U.S. Perspective.”
Presentation by Joanne Shore and John Hackworth at Platts 4th Annual European Refining Markets
Conference, September 2010.
U.S. Energy Information Administration. Annual Energy Outlook 2010—With Projections to 2035.
April 2010.
U.S. Energy Information Administration. Annual Energy Outlook 2011—With Projections to 2035.
April 2011.
U.S. Energy Information Administration. Annual Energy Outlook 2012 Early Release. December 2011.
U.S. Environmental Protection Agency, and National Highway Traffic Safety Administration.
Draft Regulatory Impact Analysis, Proposed Rulemaking to Establish Greenhouse Gas Emissions
Standards and Fuel Efficiency Standards for Medium- and Heavy-Duty Engines and Vehicles,
October 2010. http://www.epa.gov/otaq/climate/regulations/420d10901.pdf.
U.S. Environmental Protection Agency, National Highway Traffic Safety Administration, and California
Air Resources Board. Interim Joint Technical Assessment Report: Light-Duty Vehicle Greenhouse
Gas Emission Standards and Corporate Average Fuel Economy Standards for Model years 2017-2025. September 2010. http://www.epa.gov/otaq/climate/regulations/ldv-ghg-tar.pdf.
U.S. Environmental Protection Agency, Office of Air Quality Planning and Standards. Available and
Emerging Technologies for Reducing Greenhouse Gas Emissions from the Petroleum Refining Industry. October 2010.
U.S. Environmental Protection Agency. Draft Regulatory Impact Analysis: Changes to Renewable Fuel
Standard Program, Section 4.2.1.1.6. May 2009.
Valero (website), Industry Fundamentals. “Basics of Refining and Coking.” January 2011.
Zeus Intelligence, Zeus Syngas Refining Report,
March 1, 2011. Similar estimates have been published.

