
Preface. If peak oil did indeed happen in 2018 as the EIA world production data shows, then let’s use the oil we still have, before it is rationed, to clean up the 126,000+ sites that threaten to pollute groundwater for thousands of years as this report from the National Research Council explains. And while we’re at it, nuclear waste, which will pollute for hundreds of thousands of years.
Pollution in the news:
Westenhaus B (2022) The environmental consequence of burning rubber. oilprice.com. Have you ever wondered what happens to the rubber tread that wears off a vehicle’s tires? On a planet with hundreds of millions of vehicles there has to be quite a lot somewhere. New modeling at the University of British Columbia Okanagan (UBCO) campus suggests an increasing amount of what are microplastics, the fragments from tires and roadways, are ending up in lakes and streams.The researchers found that more than 50 metric tons of tire and road wear particles are released into waterways annually in an area like the Okanagan valley of British Columbia. With1.5 billion tires produced every year globally, thatl’s six million tonnes of tire and road wear particles plus chemical additives, contaminating fresh water.
Alice Friedemann www.energyskeptic.com Author of Life After Fossil Fuels: A Reality Check on Alternative Energy; When Trucks Stop Running: Energy and the Future of Transportation”, Barriers to Making Algal Biofuels, & “Crunch! Whole Grain Artisan Chips and Crackers”. Women in ecology Podcasts: WGBH, Jore, Planet: Critical, Crazy Town, Collapse Chronicles, Derrick Jensen, Practical Prepping, Kunstler 253 &278, Peak Prosperity, Index of best energyskeptic posts
***
NRC. 2013. Alternatives for Managing the Nation’s Complex Contaminated Groundwater Sites. National Research Council, National Academies Press.
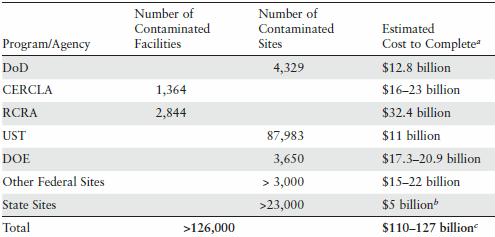 TABLE 2-6 Rough Estimate of the total number of currently known facilities or contaminated sites and estimated costs to complete
CONCLUSIONS AND RECOMMENDATIONS At least 126,000 sites across the country have been documented that have residual contamination at levels preventing them from reaching closure.
This number is likely to be an underestimate of the extent of contamination in the United States for a number of reasons. For some programs data are available only for contaminated facilities rather than individual sites, and the total does not include sites that likely exist but have not yet been identified, such as dry cleaners or small chemical-intensive businesses (e.g., electroplating, furniture refinishing). Information on cleanup costs incurred to date and estimates of future costs, as shown in Table 2-6, are highly uncertain. Despite this uncertainty, the estimated “cost to complete” of $110-$ 127 billion is likely an underestimate of future liabilities. Remaining sites include some of the most difficult to remediate sites, for which the effectiveness of planned remediation remains uncertain given their complex site conditions. Furthermore, many of the estimated costs do not fully consider the cost of long-term management of sites that will have contamination remaining in place at high levels for the foreseeable future.
Despite nearly 40 years of intensive efforts in the United States as well as in other industrialized countries worldwide, restoration of groundwater contaminated by releases of anthropogenic chemicals to a condition allowing for unlimited use and unrestricted exposure remains a significant technical and institutional challenge.
Recent estimates by the U.S. Environmental Protection Agency (EPA) indicate that expenditures for soil and groundwater cleanup at over 300,000 sites through 2033 may exceed $200 billion (not adjusted for inflation), and many of these sites have experienced groundwater impacts.
One dominant attribute of the nation’s efforts on subsurface remediation efforts has been lengthy delays between discovery of the problem and its resolution. Reasons for these extended timeframes are now well known: ineffective subsurface investigations, difficulties in characterizing the nature and extent of the problem in highly heterogeneous subsurface environments, remedial technologies that have not been capable of achieving restoration in many of these geologic settings, continued improvements in analytical detection limits leading to discovery of additional chemicals of concern, evolution of more stringent drinking water standards, and the realization that other exposure pathways, such as vapor intrusion, pose unacceptable health risks. A variety of administrative and policy factors also result in extensive delays, including, but not limited to, high regulatory personnel turnover, the difficulty in determining cost-effective remedies to meet cleanup goals, and allocation of responsibility at multiparty sites.
There is general agreement among practicing remediation professionals, however, that there is a substantial population of sites, where, due to inherent geologic complexities, restoration within the next 50 to 100 years is likely not achievable. Reaching agreement on which sites should be included in this category, and what should be done with such sites, however, has proven to be difficult. A key decision in that Road Map is determining whether or not restoration of groundwater is “likely.
Summary
The nomenclature for the phases of site cleanup and cleanup progress are inconsistent between federal agencies, between the states and federal government, and in the private sector. Partly because of these inconsistencies, members of the public and other stakeholders can and have confused the concept of “site closure” with achieving unlimited use and unrestricted exposure goals for the site, such that no further monitoring or oversight is needed. In fact, many sites thought of as “closed” and considered as “successes” will require oversight and funding for decades and in some cases hundreds of years in order to be protective.
At hundreds of thousands of hazardous waste sites across the country, groundwater contamination remains in place at levels above cleanup goals. The most problematic sites are those with potentially persistent contaminants including chlorinated solvents recalcitrant to biodegradation, and with hydrogeologic conditions characterized by large spatial heterogeneity or the presence of fractures. While there have been success stories over the past 30 years, the majority of hazardous waste sites that have been closed were relatively simple compared to the remaining caseload.
At least 126,000 sites across the country have been documented that have residual contamination at levels preventing them from reaching closure. This number is likely to be an underestimate of the extent of contamination in the United States
Significant limitations with currently available remedial technologies persist that make achievement of Maximum Contaminant Levels (MCL) throughout the aquifer unlikely at most complex groundwater sites in a time frame of 50-100 years. Furthermore, future improvements in these technologies are likely to be incremental, such that long-term monitoring and stewardship at sites with groundwater contamination should be expected.
IMPLICATIONS OF CONTAMINATION REMAINING IN PLACE
Chapter 5 discusses the potential technical, legal, economic, and other practical implications of the finding that groundwater at complex sites is unlikely to attain unlimited use and unrestricted exposure levels for many decades. First, the failure of hydraulic or physical containment systems, as well as the failure of institutional controls, could create new exposures. Second, toxicity information is regularly updated, which can alter drinking water standards, and contaminants that were previously unregulated may become so. In addition, pathways of exposure that were not previously considered can be found to be important, such as the vapor intrusion pathway. Third, treating contaminated groundwater for drinking water purposes is costly and, for some contaminants, technically challenging. Finally, leaving contamination in the subsurface may expose the landowner, property manager, or original disposer to complications that would not exist in the absence of the contamination, such as natural resource damages, trespass, and changes in land values. Thus, the risks and the technical, economic, and legal complications associated with residual contamination need to be compared to the time, cost, and feasibility involved in removing contamination outright.
New toxicological understanding and revisions to dose-response relationships will continue to be developed for existing chemicals, such as trichloroethene and tetrachloroethene, and for new chemicals of concern, such as perchlorate and perfluorinated chemicals. The implications of such evolving understanding include identification of new or revised ARARs (either more or less restrictive than existing ones), potentially leading to a determination that the existing remedy at some hazardous waste sites is no longer protective of human health and the environment.
Introduction
Since the 1970s, hundreds of billions of dollars have been invested by federal, state, and local government agencies as well as responsible parties to mitigate the human health and ecological risks posed by chemicals released to the subsurface environment. Many of the contaminants common to these hazardous waste sites, such as metals and volatile organic compounds, are known or suspected to cause cancer or adverse neurological, reproductive, or developmental conditions.
Over the past 30 years, some progress in meeting mitigation and remediation goals at hazardous waste sites has been achieved. For example, of the 1,723 sites ever listed on the National Priorities List (NPL), which are considered by the U.S. Environmental Protection Agency (EPA) to present the most significant risks, 360 have been permanently removed from the list because EPA deemed that no further response was needed to protect human health or the environment (EPA, 2012).
Seventy percent of the 3,747 hazardous waste sites regulated under the Resource Conservation and Recovery Act (RCRA) corrective action program have achieved “control of human exposure to contamination,” and 686 have been designated as “corrective action completed”. The Underground Storage Tank (UST) program also reports successes, including closure of over 1.7 million USTs since the program was initiated in 1984. The cumulative cost associated with these national efforts underscores the importance of pollution prevention and serves as a powerful incentive to reduce the discharge or release of 13 hazardous substances to the environment, particularly when a groundwater resource is threatened. Although some of the success stories described above were challenging in terms of contaminants present and underlying hydrogeology, the majority of sites that have been closed were relatively simple (e.g., shallow, localized petroleum contamination from USTs) compared to the remaining caseload.
Indeed, hundreds of thousands of sites across both state and federal programs are thought to still have contamination remaining in place at levels above those allowing for unlimited land and groundwater use and unrestricted exposure (see Chapter 2). According to its most recent assessment, EPA estimates that more than $209 billion dollars (in constant 2004 dollars) will be needed over the next 30 years to mitigate hazards at between 235,000 to 355,000 sites (EPA, 2004). This cost estimate, however, does not include continued expenditures at sites where remediation is already in progress, or where remediation has transitioned to long-term management.
It is widely agreed that long-term management will be needed at many sites for the foreseeable future, particularly for the more complex sites that have recalcitrant contaminants, large amounts of contamination, and/or subsurface conditions known to be difficult to remediate (e.g., low-permeability strata, fractured media, deep contamination).
According to the most recent annual report to Congress, the Department of Defense (DoD) currently has almost 26,000 active sites under its Installation Restoration Program where soil and groundwater remediation is either planned or under way. Of these, approximately 13,000 sites are the responsibility of the Army, the sponsor of this report. The estimated cost to complete cleanup at all DoD sites is approximately $12.8 billion. (Note that these estimates do not include sites containing unexploded ordnance.)
Complex Contaminated Sites
Although progress has been made in remediating many hazardous waste sites, there remains a sizeable population of complex sites, where restoration is likely not achievable in the next 50-100 years. Although there is no formal definition of complexity, most remediation professionals agree that attributes include a really extensive groundwater contamination, heterogeneous geology, large releases and/or source zones, multiple and/or recalcitrant contaminants, heterogeneous contaminant distribution in the subsurface, and long time frames since releases occurred.
Complexity is also directly tied to the contaminants present at hazardous waste sites, which can vary widely and include organics, metals, explosives, and radionuclides. Some of the most challenging to remediate are dense nonaqueous phase liquids (DNAPLs), including chlorinated solvents.
Each of the NRC studies has, in one form or another, recognized that in almost all cases, complete restoration of contaminated groundwater is difficult, and in a substantial fraction of contaminated sites, not likely to be achieved in less than 100 years.
Trichloroethene (TCE) and tetrachloroethene are particularly challenging to restore because of their complex contaminant distribution in the subsurface.
Three classes of contaminants that have proven very difficult to treat once released to the subsurface: metals, radionuclides, and DNAPLs, such as chlorinated solvents. The report concluded that “removing all sources of groundwater contamination, particularly DNAPLs, will be technically impracticable at many Department of Energy sites, and long-term containment systems will be necessary for these sites.”
An example of the array of challenges faced by the DoD is provided by the Anniston Army Depot, where groundwater is contaminated with chlorinated solvents (as much as 27 million pounds of TCE and inorganic compounds. TCE and other contaminants are thought to be migrating vertically and horizontally from the source areas, affecting groundwater downgradient of the base including the potable water supply to the City of Anniston, Alabama. The interim Record of Decision called for a groundwater extraction and treatment system, which has resulted in the removal of TCE in extracted water to levels below drinking water standards. Because the treatment system is not significantly reducing the extent or mobility of the groundwater contaminants in the subsurface, the current interim remedy is considered “not protective.” Therefore, additional efforts have been made to remove greater quantities of TCE from the subsurface, and no end is in sight. Modeling studies suggest that the time to reach the TCE MCL in the groundwater beneath the source areas ranges from 1,200 to 10,000 years, and that partial source removal will shorten those times to 830–7,900 years.
The Department of Defense
The DoD environmental remediation program, measured by the number of facilities, is the largest such program in the United States, and perhaps the world.
The Installation Restoration Program (IRP), which addresses toxic and radioactive wastes as well as building demolition and debris removal, is responsible for 3,486 installations containing over 29,000 contaminated sites
The Military Munitions Response Program, which focuses on unexploded ordnance and discarded military munitions, is beyond the scope of this report and is not discussed further here, although its future expenses are greater than those anticipated for the IRP.
The CERCLA program was established to address hazardous substances at abandoned or uncontrolled hazardous waste sites. Through the CERCLA program, the EPA has developed the National Priorities List (NPL). There are 1,723 facilities that have been on the NPL.
As of June 2012, 359 of the 1,723 facilities have been “deleted” from the NPL, which means the EPA has determined that no further response is required to protect human health or the environment; 1,364 remain on the NPL.
Statistics from EPA (2004) illustrate the typical complexity of hazardous waste sites at facilities on the NPL. Volatile organic compounds (VOCs) are present at 78 percent of NPL facilities, metals at 77 percent, and semivolatile organic compounds (SVOCs) at 71 percent. All three contaminant groups are found at 52 percent of NPL facilities, and two of the groups at 76 percent of facilities
RCRA Corrective Action Program Among other objectives, the Resource Conservation and Recovery Act (RCRA) governs the management of hazardous wastes at operating facilities that handle or handled hazardous waste.
Although tens of thousands of waste handlers are potentially subject to RCRA, currently EPA has authority to impose corrective action on 3,747 RCRA hazardous waste facilities in the United States
Underground Storage Tank Program In 1984, Congress recognized the unique and widespread problem posed by leaking underground storage tanks by adding Subtitle I to RCRA.
UST contaminants are typically light nonaqueous phase liquids (LNAPLs) such as petroleum hydrocarbons and fuel additives.
Responsibility for the UST program has been delegated to the states (or even local oversight agencies such as a county or a water utility with basin management programs), which set specific cleanup standards and approve specific corrective action plans and the application of particular technologies at sites. This is true even for petroleum-only USTs on military bases, a few of which have hundreds of such tanks.
At the end of 2011, there were 590,104 active tanks in the UST program
Currently, there are 87,983 leaking tanks that have contaminated surrounding soil and groundwater, the so-called “backlog.” The backlog number represents the cumulative number of confirmed releases (501,723) minus the cumulative number of completed cleanups (413,740).
Department of Energy
The DOE faces the task of cleaning up the legacy of environmental contamination from activities to develop nuclear weapons during World War II and the Cold War. Contaminants include short-lived and long-lived radioactive wastes, toxic substances such as chlorinated solvents, “mixed wastes” that include both toxic substances and radionuclides, and, at a handful of facilities, unexploded ordnance. Much like the military, a given DOE facility or installation will tend to have multiple sites where contaminants may have been spilled, disposed of, or abandoned that can be variously regulated by CERCLA, RCRA, or the UST program. T
The DOE Environmental Management program, established in 1989 to address several decades of nuclear weapons production, “is the largest in the world, originally involving two million acres at 107 sites in 35 states and some of the most dangerous materials known to man”.
Given that major DOE sites tend to be more challenging than typical DoD sites, it is not surprising that the scope of future remediation is substantial. Furthermore, because many DOE sites date back 50 years, contaminants have diffused into the subsurface matrix, considerably complicating remediation.
More recent reports suggest that about 7,000 individual release sites out of 10,645 historical release sites have been “completed,” which means at least that a remedy is in place, leaving approximately 3,650 sites remaining. In 2004, DOE estimated that almost all installations would require long-term stewardship
As of April 1995, over 3,000 contaminated sites on 700 facilities, distributed among 17 non-DoD and non-DOE federal agencies, were potentially in need of remediation. The Department of Interior (DOI), Department of Agriculture (USDA), and National Aeronautics and Space Administration (NASA) together account for about 70 percent of the civilian federal facilities reported to EPA as potentially needing remediation (EPA, 2004). EPA estimates that many more sites have not yet been reported, including an estimated 8,000 to 31,000 abandoned mine sites, most of which are on federal lands, although the fraction of these that are impacting groundwater quality is not reported. The Government Accountability Office (GAO) (2008) determined that there were at least 33,000 abandoned hardrock mine sites in the 12 western states and Alaska that had degraded the environment by contaminating surface water and groundwater or leaving arsenic-contaminated tailings piles.
State Sites
A broad spectrum of sites is managed by states, local jurisdictions, and private parties, and thus are not part of the CERCLA, RCRA, or UST programs. These types of sites can vary in size and complexity, ranging from sites similar to those at facilities listed on the NPL to small sites with low levels of contamination.
States typically define Brownfields sites as industrial or commercial facilities that are abandoned or underutilized due to environmental contamination or fear of contamination. EPA (2004) postulated that only 10 to 15 percent of the estimated one-half to one million Brownfields sites have been identified.
As of 2000, 23,000 state sites had been identified as needing further attention that had not yet been targeted for remediation (EPA, 2004). The same study estimated that 127,000 additional sites would be identified by 2030. Dry Cleaner Sites Active and particularly former dry cleaner sites present a unique problem in hazardous waste management because of their ubiquitous nature in urban settings, the carcinogenic contaminants used in the dry cleaning process (primarily the chlorinated solvent PCE, although other solvents have been used), and the potential for the contamination to reach receptors via the drinking water and indoor air (vapor intrusion) exposure pathways. Depending on the size and extent of contamination, dry cleaner sites may be remediated under one or more state or federal programs such as RCRA, CERCLA, or state mandated or voluntary programs discussed previously, and thus the total estimates of dry cleaner sites are not listed separately in
In 2004, there were an estimated 30,000 commercial, 325 industrial, and 100 coin-operated active dry cleaners in the United States (EPA, 2004). Despite their smaller numbers, industrial dry cleaners produce the majority of the estimated gallons of hazardous waste from these facilities (EPA, 2004). As of 2010, the number of dry cleaners has grown, with an estimated 36,000 active dry cleaner facilities in the United States—of which about 75 percent (27,000 dry cleaners) have soil and groundwater contamination (SCRD, 2010b). In addition to active sites, dry cleaners that have moved or gone out of business—i.e., inactive sites—also have the potential for contamination. Unfortunately, significant uncertainty surrounds estimates of the number of inactive dry cleaner sites and the extent of contamination at these sites. Complicating factors include the fact that (1) older dry cleaners used solvents less efficiently than younger dry cleaners thus enhancing the amount of potential contamination and (2) dry cleaners that have moved or were in business for long amounts of time tend to employ different cleaning methods throughout their lifetime. EPA (2004) documented at least 9,000 inactive dry cleaner sites, although this number does not include data on dry cleaners that closed prior to 1960. There are no data on how many of these documented inactive dry cleaner sites may have been remediated over the years. EPA estimated that there could be as many as 90,000 inactive dry cleaner sites in the United States.
Department of Defense The Installation Restoration Program reports that it has spent approximately $31 billion through FY 2010, and estimates for “cost to complete” exceed $12 billion
Implementation costs for the CERCLA program are difficult to obtain because most remedies are implemented by private, nongovernmental PRPs and generally there is no requirement for these PRPs to report actual implementation costs.
EPA (2004) estimated that the cost for addressing the 456 facilities that have not begun remedial action is $16-$23 billion.
A more recent report from the GAO (2009) suggests that individual site remediation costs have increased over time (in constant dollars) because a higher percentage of the remaining NPL facilities are larger and more complex (i.e., “megasites”) than those addressed in the past. Additionally, GAO (2009) found that the percentage of NPL facilities without responsible parties to fund cleanups may be increasing. When no PRP can be identified, the cost for Superfund remediation is shared by the states and the Superfund Trust Fund. The Superfund Trust Fund has enjoyed a relatively stable budget—e.g., $1.25 billion, $1.27 billion, and $1.27 billion for FY 2009, 2010, and 2011, 8 respectively—although recent budget proposals seek to reduce these levels. States contribute as much as 50 percent of the construction and operation costs for certain CERCLA actions in their state. After ten years of remedial actions at such NPL facilities, states become fully responsible for continuing long-term remedial actions.
In 2004, EPA estimated that remediation of the remaining RCRA sites will cost between $31 billion and $58 billion, or an average of $11.4 million per facility
Underground Storage Tank Program
There is limited information available to determine costs already incurred in the UST program. EPA (2004) estimated that the cost to close all leaking UST (LUST) sites could reach $12-$19 billion or an average of $125,000 to remediate each release site (this includes site investigations, feasibility studies, and treatment/disposal of soil and groundwater). Based on this estimate of $125,000 per site, the Committee calculated that remediating the 87,983 backlogged releases would require $11 billion. The presence of the recalcitrant former fuel additive methyl tert-butyl ether (MTBE) and its daughter product and co-additive tert-butyl alcohol could increase the cost per site. Most UST cleanup costs are paid by property owners, state and local governments, and special trust funds based on dedicated taxes, such as fuel taxes. Department of Energy
The Department’s FY 2011 report to Congress, which shows that DOE’s anticipated cost to complete remediation of soil and groundwater contamination ranges from $17.3 to $20.9 billion. The program is dominated by a small number of mega-facilities, including Hanford (WA), Idaho National Labs, Savannah River (SC), Los Alamos National Labs (NM), and the Nevada Test Site. Given that the cost to complete soil and groundwater remediation at these five facilities alone ranges from $16.4 to $19.9 billion (DOE, 2011), the Committee believes that the DOE’s anticipated cost-to-complete figure is likely an underestimate of the Agency’s financial burden; the number does not include newly discovered releases or the cost of long-term management at all sites where waste remains in the subsurface. Data on long-term stewardship costs, including the expense of operating and maintaining engineering controls, enforcing institutional controls, and monitoring, are not consolidated but are likely to be substantial and ongoing.
Stewardship costs for just the five facilities managed by the National Nuclear Security Administration (Lawrence Livermore National Laboratory, CA, Livermore’s Site 300, Pantex, TX, Sandia National Laboratories, NM, and the Kansas City Plant, MO) total about $45 million per year (DOE, 2012c).
Other Federal Sites EPA (2004) reports that there is a $15-$22 billion estimated cost to address at least 3,000 contaminated areas on 700 civilian federal facilities, based on estimates from various reports from DOI, USDA, and NASA. States EPA (2004) estimated that states and private parties together have spent about $1 billion per year on remediation, addressing about 5,000 sites annually under mandatory and voluntary state programs. If remediation were continued at this rate, 150,000 sites would be completed over 30 years, at a cost of approximately $30 billion (or $20,000 per site). IMPACTS TO
DRINKING WATER SUPPLIES
The Committee sought information both on the number of hazardous waste sites that impact a drinking water aquifer—that is, pose a substantial near-term risk to public water supply systems that use groundwater as a source. Unfortunately, program-specific information on water supply impacts was generally not available. Therefore, the Committee also sought other evidence related to the effects of hazardous waste disposal on the nation’s drinking water aquifers.
Despite the existence of several NPL and DoD facilities that are known sources of contamination to public or domestic wells (e.g., the San Fernando and San Gabriel basins in Los Angeles County), there is little aggregated information about the number of CERCLA, RCRA, DoD, DOE, UST, or other sites that directly impact drinking water supply systems. None of the programs reviewed in this chapter specifically compiles information on the number of sites currently adversely affecting a drinking water aquifer. However, the Committee was able to obtain information relevant to the groundwater impacts from some programs, i.e. the DoD. The Army informed the Committee that public water supplies are threatened at 18 Army installations
Also, private drinking water wells are known to be affected at 23 installations. A preliminary assessment in 1997 showed that 29 Army installations may possibly overlie one or more sole source aquifers. Some of the best known are Camp Lejeune Marine Corps Base (NC), Otis Air National Guard Base (MA), and the Bethpage Naval Weapons Industrial Reserve Plant (NY).
CERCLA. Each individual remedial investigation/feasibility study (RI/FS) and Record of Decision (ROD) should state whether a drinking water aquifer is affected, although this information has not been compiled. Canter and Sabatini (1994) reviewed the RODs for 450 facilities on the NPL. Their investigation revealed that 49 of the RODs (11 percent) indicated that contamination of public water supply systems had occurred. “A significant number” of RODs also noted potential threats to public supply wells. Additionally, the authors note that undeveloped aquifers have also been contaminated, which prevents or limits the unrestricted use (i.e., without treatment) of these resources as a future water supply.
The EPA also compiles information about remedies implemented within Superfund. EPA (2007) reported that out of 1,072 facilities that have a groundwater remedy, 106 specifically have a water supply remedy, by which we inferred direct treatment of the water to allow potable use or switching to an alternative water supply. This suggests that 10 percent of NPL facilities adversely affect or significantly threaten drinking water supply systems.
RCRA. Of the 1,968 highest priority RCRA Corrective Action facilities, EPA (2008) reported that there is “unacceptable migration of contaminated groundwater” at 77 facilities. Also, 17,042 drinking water aquifers have a RCRA facility within five miles, but without additional information, it is impossible to know if these facilities are actually affecting the water sources.
UST. In 2000, 35 states reported USTs as the number one threat to groundwater quality (and thus indirectly to drinking water). However, more specific information on the number of leaking USTs currently impacting a drinking water aquifer is not available. Other Evidence That Hazardous Waste Sites Affect Water Supplies The U.S. Geological Survey (USGS) has compiled large data sets over the past 20 years regarding the prevalence of VOCs in waters derived from domestic (private) and public wells. VOCs include solvents, trihalomethanes (some of which are solvents [e.g., chloroform], but may also arise from chlorination of drinking water), refrigerants, organic synthesis compounds (e.g., vinyl chloride), gasoline hydrocarbons, fumigants, and gasoline oxygenates. Because many (but not all) of these compounds may arise from hazardous waste sites, the USGS studies provide further insight into the extent to which anthropogenic activities contaminate groundwater supplies
Zogorski et al. (2006) summarized the presence of VOCs in groundwater, private domestic wells, and public supply wells from sampling sites throughout the United States. Using a threshold level of 0.2 µg/L—much lower than current EPA drinking water standards for individual VOCs (see Table 3-1)—14 percent of domestic wells and 26 percent of public wells had one or more VOCs present. The detection frequencies of individual VOCs in domestic wells were two to ten times higher when a threshold of 0.02 µg/L was used (see Figures 2-2 and 2-3). In public supply wells, PCE was detected above the 0.2 µg/L threshold in 5.3 percent of the samples and TCE in 4.3 percent of the samples. The total percentage of public supply wells with either PCE or TCE (or both) above the 0.2 µg/L threshold is 7.3
Chloroform Methyl tert-butyl ether (MTBE) Perchloroethene (PCE) 1,1,1-Trichloroethane (TCA) Dichlorodifluoromethane (CFC-12) Toluene Chloromethane Trichloroethene (TCE) Dibromochloropropane (DBCP) Methylene chloride Trichlorofluoromethane (CFC-11) Bromodichloromethane 1,2-Dichloropropane Dibromochloromethane 1,2,3-Trichloropropane
FIGURE 2-2 Detection frequencies in domestic well samples for 15 most frequently detected VOCs at levels of 0.2 and 0.02 mg/L. SOURCE: Zogorski et al. (2006) with illustration provided by USGS National Water Quality Assessment program. Figure 2-2 Chloroform Methyl tert-butyl ether (MTBE) Perchloroethene (PCE) Bromoform Dibromochloromethane Trichloroethene (TCE) Bromodichloromethane 1,1,1-Trichloroethane (TCA) 1,1-Dichloroethane (1,1-DCA) Dichlorodifluoromethane (CFC-12) cis-1,2-Dichloroethene (cis-1,2-DCE) 1,1-Dichloroethene (1,1-DCE) Trichlorofluoromethane (CFC-11) trans-1,2-Dichloroethene (trans-1,2-DCE) Toluene
FIGURE 2-3 The 15 most frequently detected VOCs in public supply wells. SOURCE: Zogorski et al. (2006) with illustration provided by USGS National Wa ter Quality Assessment program.Figure
Further analysis of domestic wells by DeSimone et al. (2009) showed that organic contaminants were detected in 60 percent of 2,100 sampled wells. Wells were sampled in 48 states in parts of 30 regionally extensive aquifers used for water supply. Aquifers were randomly selected for sampling and there was no prior knowledge of contamination.
Of 30 regionally extensive aquifers used for water supply. Aquifers were randomly selected for sampling and there was no prior knowledge of contamination.
Toccalino and Hopple (2010) and Toccalino et al. (2010) focused on 932 public supply wells across the United States. The public wells sampled in this study represent less than 1 percent of all groundwater that feeds the nation’s public water systems. The samples, however, were widely distributed nationally and were randomly selected to represent typical aquifer conditions. Overall, 60 percent of public wells contained one or more VOCs at a concentration of = 0.02 µg/L, and 35 percent of public wells contained one or more VOCs at a concentration of = 0.2 µg/L.
Overall detection frequencies for individual compounds included 23 percent for PCE, 15 percent for TCE, 14 percent for MTBE, and 12 percent for 1,1,1-TCA (see Figure 2-5). PCE and TCE exceeded the MCL in approximately 1 percent of the public wells sampled.
PERCENT FIGURE 2-4 VOCs (in black) and pesticides (in white) detected in more than 1 percent of domestic wells at a level of 0.02 µg/L.
FIGURE 2-5 VOCs and pesticides with detection frequencies of 1 percent or greater at assessment levels of 0.02 µg/L in public wells in samples collected from 1993–2007. SOURCE: Toccalino and Hopple (2010) and Toccalino et al. (2010)
Overall, the USGS studies show that there is widespread, very low level contamination of private and public wells by VOCs, with a reasonable estimate being 60 to 65% of public wells having detectable VOCs. According to the data sets of Toccalino and Hopple (2010) and Toccalino et al. (2010), approximately 1% of sampled public wells have levels of VOCs above MCLs. Thus, water from these wells requires additional treatment to remove the contaminants before it is provided as drinking water to the public. EPA (2009b) compiled over 309,000 groundwater measurements of PCE and TCE from raw water samples at over 46,000 groundwater-derived public water supplies in 45 states. Compared to the USGS data, this report gives a lower percentage of water supplies being contaminated: TCE concentration exceeded its MCL in 0.34 percent of the raw water samples from groundwater-derived drinking water supply systems. There are other potential sources of VOCs in groundwater beyond hazardous waste sites. For example, chloroform is a solvent but also a disinfection byproduct, so groundwater sources impacted by chlorinated water (e.g., via aquifer storage/recharge, leaking sewer pipes) would be expected to show chloroform detections. Another correlation seen in the USGS data is that domestic and public wells in urban areas are more likely to have VOC detections that those in rural areas. This finding is not unexpected given the much higher level of industrial practices in urban areas that can result in releases of these chemicals to the subsurface. Another way to estimate the number of public water supplies affected by contaminated groundwater is to consider the number of water supply systems that specifically seek to remove organic contaminants. The EPA Community Water System Survey (EPA, 2002) reports that 2.3 to 2.6 percent of systems relying solely on groundwater have “organic contaminant removal” as a treatment goal. For systems that use both surface water and groundwater, 10.3 to 10.5 percent have this as a treatment goal.
In summary, it appears that the following conclusions about the contamination of private and public groundwater systems can be drawn: (1) there is VOC contamination of many private and public wells (upwards of 65%) in the U.S., but at levels well below MCLs; the origin of this contamination is uncertain and the proportion caused by releases from hazardous waste sites is unknown; (2) approximately one in 10 NPL facilities is impacting or significantly threatening a drinking water supply system relying on groundwater, requiring wellhead treatment or the use of alternative water sources; and (3) public wells are more susceptible to contamination than private wells, due their higher likelihood of being in urban areas and their higher pumping rates and hydraulic capture zones.
All of these issues suggest that there can be no generalizations about the condition of sites referred to as “closed,” particularly assumptions that they are “clean,” meaning available for unlimited use and unrestricted exposure. Indeed, the experience of the Committee in researching “closed sites” suggests that many of them contain contaminant levels above those allowing for unlimited use and unrestricted exposure, even in those situations where there is “no further action” required.
Furthermore, it is clear that states are not tracking their caseload at the level of detail needed to ensure that risks are being controlled subsequent to “site closure.” Thus, reports of cleanup success should be viewed with caution.
CONCLUSIONS AND RECOMMENDATIONS
The Committee’s rough estimate of the number of sites remaining to be addressed and their associated future costs is presented in Table 2-6, which lists the latest available information on the number of facilities (for CERCLA and RCRA) and contaminated sites (for the other programs) that have not yet reached closure, and the estimated costs to remediate the remaining sites.
water/contaminated
TABLE 2-6 Rough Estimate of the total number of currently known facilities or contaminated sites that have Not reached closure and estimated costs to complete
At least 126,000 sites across the country have been documented that have residual contamination at levels preventing them from reaching closure. This number is likely to be an underestimate of the extent of contamination in the United States for a number of reasons. First, for some programs data are available only for contaminated facilities rather than individual sites; for example, RCRA officials declined to provide an average number of solid waste management units per facility, noting that it ranged from 1 to “scores.” CERCLA facilities frequently contain more than one individual release site. The total does not include DoD sites that have reached remedy in place or response complete, although some such sites may indeed contain residual contamination. Finally, the total does not include sites that likely exist but have not yet been identified, such as dry cleaners or small chemical-intensive businesses (e.g., electroplating, furniture refinishing).
Information on cleanup costs incurred to date and estimates of future costs, as shown in Table 2-6, are highly uncertain. Despite this uncertainty, the estimated “cost to complete” of $110-$ 127 billion is likely an underestimate of future liabilities. Remaining sites include some of the most difficult to remediate sites, for which the effectiveness of planned remediation remains uncertain given their complex site conditions. Furthermore, many of the estimated costs (e.g., the CERCLA figure) do not fully consider the cost of long-term management of sites that will have contamination remaining in place at high levels for the foreseeable future.
Remedial Objectives, Remedy Selection, and Site Closure
The issue of setting remedial objectives touches upon every aspect and phase of soil and groundwater cleanup, but none perhaps as important as defining the conditions for “site closure.” Whether a site can be “closed” depends largely on whether remediation has met its stated objectives, usually stated as “remedial action objectives.” Such determinations can be very difficult to make when objectives are stated in such ill-defined terms as removal of mass “to the maximum extent practicable.” More importantly, there are debates at hazardous waste sites across the country about whether or not to alter long-standing cleanup objectives when they are unobtainable in a reasonable time frame. For example, the state of California is closing a large number of petroleum underground storage tank sites that are deemed to present a low threat to the public, despite the affected groundwater not meeting cleanup. In other words, some residual contamination remains in the subsurface, but this residual contamination is deemed not to pose unacceptable future risks to human health and the environment. Other states have pursued similar pragmatic approaches to low-risk sites where the residual contaminants are known to biodegrade over time, as is the case for most petroleum-based chemicals of concern (e.g., benzene, naphthalene). Many of these efforts appear to be in response to the slow pace of cleanup of contaminated groundwater; the inability of many technologies to meet drinking water-based cleanup goals in a reasonable period of time, particularly at sites with dense nonaqueous phase liquids (DNAPLs) and complicated hydrogeology like fractured rock; and the limited resources available to fund site remediation.
There is considerable variability in how EPA and the states consider groundwater as a potential source of drinking water. EPA has defined groundwater as not capable of being used as a source of drinking water if (1) the available quantity is too low (e.g., less than 150 gallons per day can be extracted), (2) the groundwater quality is unacceptable (e.g., greater than 10,000 ppm total dissolved solids, TDS), (3) background levels of metals or radioactivity are too high, or (4) the groundwater is already contaminated by manmade chemicals (EPA, 1986, cited in EPA, 2009a). California, on the other hand, establishes the TDS criteria at less than 3,000 ppm to define a “potential” source of drinking water. And in Florida, cleanup target levels for groundwater of low yield and/or poor quality can be ten times higher than the drinking water standard (see Florida Administrative Code Chapter 62-520 Ground Water Classes, Standards, and Exemptions). Some states designate all groundwater as a current or future source of drinking water (GAO, 2011).
The Limits of Aquifer Restoration
As shown in many previous reports (EPA, 2003; NRC, 1994, 1997, 2003, 2005), at complex groundwater contamination sites (particularly those with low solubility or strongly adsorbed contaminants), conventional and alternative remediation technologies have not been capable of reducing contaminant concentrations (particularly in the source area) to drinking water standards quickly.
One Response to There are over 300,000 contaminated groundwater sites in the U.S.