
 Preface. I summarize two major research papers on the state of the Ogallal below. It and many other aquifers are depleting rapidly, and polluted from pesticides, feedlot waste, intruding salts, and other pollution. Rainfall isn’t replenishing the Ogallala. Many won’t be recharged until after the next ice age.
Globally, aquifers are “highly stressed” in 17 countries that hold one-quarter of the world’s population, according to the World Resources Institute. Water and food supplies for billions of people are under threat.
The Ogallala is one of Earth’s largest aquifers. This water is used in 10 great Plains states and produces 20% of U.S. food and 40% of the grain fed to cattle. Over the last century, two-thirds of the total water has been pumped up, enough to fill Lake Erie. Many geologists expect parts of the Ogallala to run out of water in 25 to 30 years.
The “tragedy of the commons” is writ large over the Ogallala. Underground water ignores property lines, so farming and ranching owners pump as much as they can because their neighbors are doing likewise (Hayes 2015).
Like climate change, aquifer depletion is the type of problem that human minds aren’t well designed to handle. We operate day to day, but this problem spans generations.
Groundwater pumping in the High Plains Aquifer currently supports 30% of the irrigated agriculture in the USA and has transformed the region into the “Breadbasket of the World”. Peak groundwater depletion from over-tapping aquifers beyond recharge rates happened in 1999 Texas, 2002 New Mexico, 2010 Kansas, 2012 Oklahoma, 2023 Colorado and peaks for Nebraska, South Dakota and Wyoming won’t occur until 2110 (Steward 2015).
Cows are polluting the Ogallala (and other aquifers). The aquifer’s water was once of such fine quality that you could drink it unfiltered and untreated. Now, however, the EPA says that pesticides, fertilizers, feedlot wastes, trace metals, and volatile organic compounds have contaminated much of it.
Aquifers in the news:
Stokstad E (2020) Deep Deficit. Droughts highlighted California’s unsustainable use of groundwater. Now, the state is trying to refill its aquifers. Science 368: 230-233. Researchers estimate that in the Central Valley, half of the aquifers are dangerously depleted. California’s Central Valley—one of the richest agricultural regions in the world—is sinking. During a recent intense drought, from 2012 to 2016, parts of the valley sank as much as 60 centimeters per year. For decades, farmers have relentlessly pumped groundwater to irrigate their crops, draining thick, water-bearing clay layers deep underground. As the clays compress, roads, bridges, and irrigation canals have cracked, causing extensive and expensive damage. Such sagging can leave canals carrying less water. Excessive pumping also jeopardizes water quality, as pollutants accumulate within groundwater and the clays release arsenic. Worst of all, the persistent pumping means that, one day, aquifers might run out of usable water. Geologists are working to identify the best places to replenish aquifers by flooding farm fields, including some with especially permeable geology.
Schreiner-McGraw AP et al (2020) Woody Plant Encroachment has a Larger Impact than Climate Change on Dryland Water Budgets. Scientific Reports. Grasslands across the globe, which support the majority of the world’s grazing animals, have been transitioning to shrublands. This study found that shrub encroachment on slopes can increase the amount of water that goes into groundwater storage. The effect is so powerful that it even counterbalances the lower annual rainfall amounts expected during climate change.
Alice Friedemann www.energyskeptic.com Author of Life After Fossil Fuels: A Reality Check on Alternative Energy; When Trucks Stop Running: Energy and the Future of Transportation”, Barriers to Making Algal Biofuels, & “Crunch! Whole Grain Artisan Chips and Crackers”. Women in ecology Podcasts: WGBH, Planet: Critical, Crazy Town, Collapse Chronicles, Derrick Jensen, Practical Prepping, Kunstler 253 &278, Peak Prosperity, Index of best energyskeptic posts
***
Konikow, L.F. 2013. Groundwater depletion in the United States (1900−2008): U.S. Geological Survey Scientific Investigations Report 2013−5079.
According to the USGS Groundwater Depletion in the United States 1900-2008:
- Groundwater depletion in the United States between 1900–2008 was 240 cubic miles (1,000 cubic km3).
- That’s twice as much water in Lake Erie (480 km3).
- For many areas the rate is unsustainable
- This rate increased dramatically after 1950
- The consumption rate nearly tripled from 2000-2008 over past rates. Some of this was due to drought and decreased snowmelt.
- In 2000-2008 about 25% of all water taken during the previous century was removed. This large volume of depletion represents a serious problem in the United States because much of this storage loss cannot be easily or quickly recovered and affects the sustainability of some critical water supplies and base flow to streams, among other effects
- The Ogallala aquifer won’t be replenished until after the next ice age and underlies 10 states (175,000 square miles). It is the main source of drinking and agricultural water. In 2000-2008, as much water was taken out as during the entire previous century from 1900 to 1999.
- Another dark side to depleting aquifers is that the extra water runs into the ocean and adds 2% of the global sea-level rise seen so far.
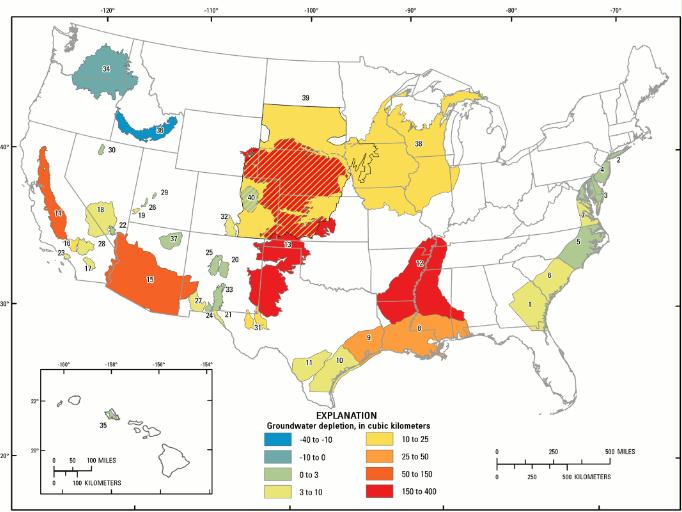
Map of the United States showing cumulative groundwater depletion 1900-2008 in 40 assessed aquifer systems or subareas. Colors are hatched in the Dakota aquifer (area 39) where the aquifer overlaps with other aquifers having different values of depletion (page 16).
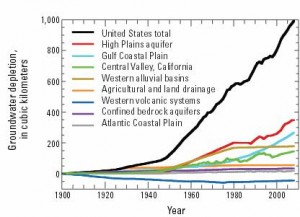 Cumulative groundwater depletion in the United States and major aquifer systems or categories, 1900 through 2008
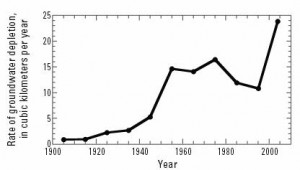 Decadal scale rate of groundwater depletion in the United States, 1900 through 2008. Final value represents average rate during an 8-year period, 2001 through 2008.
Agricultural and Land Drainage in the United States
During the 20th century, many agricultural and civil engineering projects were completed for land reclamation, flood control, and agricultural drainage purposes in the United States. This led to significant losses of wetland areas throughout the Nation. On farms, crop yields can be increased by keeping the water table some distance below the land surface, thereby precluding water logging of land and allowing salts to be removed from the soil profile. Drainage projects can result in permanently lowered water-table elevations both locally and regionally. Where the seasonal or average annual position of the water table is permanently lowered, the net decline represents a long-term depletion of the volume of groundwater in storage below the land surface.
The first half of the 20th century was marked by emerging technologies for land drainage. Farmers joined together in drainage organizations to build drainage and flood control measures. Large-scale drainage projects backed by drainage organizations and Federal agencies affected both large and small wetland areas. Agricultural and urban expansion persisted throughout the United States. Use of drained lands usually occurred in a succession, from undrained wetlands to agricultural lands to urban areas. These factors led to the drainage of over 100,000 square miles of wetlands in the lower 48 states during the 20th century, which is about 55 km3 of permanently lost water.
Institute of Medicine. The Nexus of Biofuels, Climate Change, and Human Health: Workshop Summary. Washington, DC: The National Academies Press, 2014.
The session’s first speaker was Lester Brown, founder and president of the Earth Policy Institute and one of the world’s best-known environmental analysts. He spoke on the importance of biofuels in the world food economy.
Brown said that last year 129 million tons of grain were converted into ethanol in the United States, and because there are about 400 million tons of grain produced in the country each year, that means that the share going to biofuels is roughly 30%. The amount of grain going to biofuels production exceeded the amount of grain being used to feed livestock and poultry. “We are now diverting more grain to fuel than to feed.”
To put the 129 million tons into perspective, Brown pointed out that this is more grain than Russia produces in total. “So, we have taken out of the food/feed economy a chunk of grain, variety of factors are making it difficult for farmers to keep up with the record growth in the demand for grain.
The four most important are water shortages, climate change, soil erosion, and hitting the ceiling on grain yields.
“Water shortages aren’t entirely new, but water shortages on the scale we are seeing today are unique.”
Half of the world’s people live in countries where water tables are falling as a result of overpumping, including the 3 major grain producers: China, India, and the United States.
“The World Bank estimates that in India, 175 million people are being fed with grain produced by overpumping,” he said. “My estimate for China is 130 million.”
In the United States, the irrigated areas in California and Texas, the country’s 2 largest agricultural states, are steadily shrinking, Brown said. In Texas, that is mostly because the wells are going dry. Many of the wells there rely on the Ogallala Aquifer, which is a fossil aquifer. In California, the shrinkage is partly due to wells going dry, but part of the reason is that substantial irrigation water is being diverted to cities.
And for the first time, there is a sub-region of the world with declining grain production as a result of water shortages; the Arab Middle East, including Iraq, Jordan, Saudi Arabia, Syria, and Yemen. In those countries, grain production is not only falling, but falling at a fairly substantial rate because the wells are going dry.
In Saudi Arabia, much of the pumping has come from a fossil aquifer, and it is almost gone now. “As it goes, so will their wheat production go.”
With the second major factor affecting food supply—climate change—there is still much that is not known, Brown commented. A recent study that drew on data from hundreds of counties in the United States indicates that a 17% decline in grain yields for each 1° Celsius rise in temperature is likely.
The root of the issue lies in the relationship between temperature and photosynthesis. As temperature rises, Brown said, so does photosynthesis— but only up to 68°Fahrenheit (F). From 68°F degrees to 95°F, the photosynthesis remains constant, and above 95°F it begins to drop. Once the average temperature reaches 104°F, plants go into thermal shock and photosynthesis stops. Thus, he said, as the world’s average temperature edges up, it will affect grain yields adversely, unless the problem can be somehow offset through plant breeding, which researchers are now trying to do.
Climate change will bring other changes as well, such as changes in rainfall patterns. “The main point,” Brown said, “is that the agricultural system that we have now evolved over an 11,000-year period of rather remarkable climate stability. Now, suddenly, the climate system is changing.” Farmers no longer know exactly what to expect and do not have enough information to do long-term planning.
A third factor affecting food supply is soil erosion. The world is seeing more soil erosion than at any time in history. The United States experienced a dust bowl in the 1930s. To get it under control, farmers turned some of the land back into grasslands and instituted a variety of farming practices designed to minimize soil erosion. When the Soviet Union experienced a similar problem in the late 1950s, they reacted in a similar way.
“There are now two dust bowls forming in the world,” Brown said, “both far larger than either the one in the United States in the 1930s or the one in Russia in the late 1950s.” They are in northern China and the African Sahel. Indeed, the entire northern part of China is becoming a huge dust bowl. Rather than overplowing, however, the main reason is overgrazing. “The vegetation is simply being destroyed,” he said. China has about the same grazing capacity as the United States, but it has far more animals. Although both countries have close to 100 million head of cattle, the United States has only 9 million sheep and goats, while China has 284 million. “They are literally just destroying the vegetation throughout northern China,” Brown said. The government seems politically unable to deal with the problem, because of the potential unrest that would be caused by trying to reduce flocks to a sustainable level.
The fourth factor affecting food supply is that grain yields seem to have reached a point where it will be very difficult to increase them much more. In Japan and South Korea, rice yields were rising for decades. “Suddenly, about 15 years ago, they stopped rising and they have been flat as a pancake since then,” Brown said. China is just now reaching the same yields that Japan has, and unless China can take its rice yields beyond those in Japan—which Brown doubts will happen— that country is also about to hit a ceiling on rice yields. In Europe, wheat yields in the three major producers—France, Germany, and the United Kingdom—have all been flat now for more than a decade. “In none of these countries that have hit the glass ceiling, has anyone been able to break out of it,” Brown said, “because they are being boxed in by the limits of photosynthesis itself. Unless someone can figure out a process that is more efficient than photosynthesis or somehow modify photosynthesis, which is not an easy thing, we are going to have to face the reality of more and more agriculturally advanced countries hitting these glass ceilings.”
What can be done?
Stabilize population, which will go hand in hand with eradicating poverty. “There are millions of women in the world today who want to plan their families, but who do not have access to family planning services,” Brown said. “Just getting them the services they want would take care of much of the population growth in the world today.”
REFERENCES
Hayes, Denis and Gail. 2015. Cowed: The Hidden Impact of 93 Million Cows on America’s Health, Economy, Politics, Culture, and Environment. W.W. Norton & Company.
One Response to USGS Groundwater Depletion study of aquifer decline in the U.S.