Michael Klare: Twenty-First-Century Energy Wars

Twenty-First-Century Energy Wars by Michael Klare, originally published by Tomdispatch

Iraq, Syria, Nigeria, South Sudan, Ukraine, the East and South China Seas: wherever you look, the world is aflame with new or intensifying conflicts.  At first glance, these upheavals appear to be independent events, driven by their own unique and idiosyncratic circumstances.  But look more closely and they share several key characteristics — notably, a witch’s brew of ethnic, religious, and national antagonisms that have been stirred to the boiling point by a fixation on energy.

In each of these conflicts, the fighting is driven in large part by the eruption of long-standing historic antagonisms among neighboring (often intermingled) tribes, sects, and peoples.  In Iraq and Syria, it is a clash among Sunnis, Shiites, Kurds, Turkmen, and others; in Nigeria, among Muslims, Christians, and assorted tribal groupings; in South Sudan, between the Dinka and Nuer; in Ukraine, between Ukrainian loyalists and Russian-speakers aligned with Moscow; in the East and South China Sea, among the Chinese, Japanese, Vietnamese, Filipinos, and others.  It would be easy to attribute all this to age-old hatreds, as suggested by many analysts; but while such hostilities do help drive these conflicts, they are fueled by a most modern impulse as well: the desire to control valuable oil and natural gas assets.  Make no mistake about it, these are twenty-first-century energy wars.

It should surprise no one that energy plays such a significant role in these conflicts.  Oil and gas are, after all, the world’s most important and valuable commodities and constitute a major source of income for the governments and corporations that control their production and distribution.  Indeed, the governments of Iraq, Nigeria, Russia, South Sudan, and Syria derive the great bulk of their revenues from oil sales, while the major energy firms (many state-owned) exercise immense power in these and the other countries involved.  Whoever controls these states, or the oil- and gas-producing areas within them, also controls the collection and allocation of crucial revenues.  Despite the patina of historical enmities, many of these conflicts, then, are really struggles for control over the principal source of national income.

Moreover, we live in an energy-centric world where control over oil and gas resources (and their means of delivery) translates into geopolitical clout for some and economic vulnerability for others.  Because so many countries are dependent on energy imports, nations with surpluses to export — including Iraq, Nigeria, Russia, and South Sudan — often exercise disproportionate influence on the world stage.  What happens in these countries sometimes matters as much to the rest of us as to the people living in them, and so the risk of external involvement in their conflicts — whether in the form of direct intervention, arms transfers, the sending in of military advisers, or economic assistance — is greater than almost anywhere else.

The struggle over energy resources has been a conspicuous factor in many recent conflicts, including the Iran-Iraq War of 1980-1988, the Gulf War of 1990-1991, and the Sudanese Civil War of 1983-2005.  On first glance, the fossil-fuel factor in the most recent outbreaks of tension and fighting may seem less evident.  But look more closely and you’ll see that each of these conflicts is, at heart, an energy war.

Iraq, Syria, and ISIS

The Islamic State of Iraq and Syria (ISIS), the Sunni extremist group that controls large chunks of western Syria and northern Iraq, is a well-armed militia intent on creating an Islamic caliphate in the areas it controls.  In some respects, it is a fanatical, sectarian religious organization, seeking to reproduce the pure, uncorrupted piety of the early Islamic era.  At the same time, it is engaged in a conventional nation-building project, seeking to create a fully functioning state with all its attributes.

As the United States learned to its dismay in Iraq and Afghanistan, nation-building is expensive: institutions must be created and financed, armies recruited and paid, weapons and fuel procured, and infrastructure maintained.  Without oil (or some other lucrative source of income), ISIS could never hope to accomplish its ambitious goals.  However, as it now occupies key oil-producing areas of Syria and oil-refining facilities in Iraq, it is in a unique position to do so.  Oil, then, is absolutely essential to the organization’s grand strategy.

Syria was never a major oil producer, but its prewar production of some 400,000 barrels per day did provide the regime of Bashar al-Assad with a major source of income.  Now, most of the country’s oil fields are under the control of rebel groups, including ISIS, the al-Qaeda-linked Nusra Front, and local Kurdish militias.  Although production from the fields has dropped significantly, enough is being extracted and sold through various clandestine channels to provide the rebels with income and operating funds.  “Syria is an oil country and has resources, but in the past they were all stolen by the regime,” said Abu Nizar, an anti-government activist.  “Now they are being stolen by those who are profiting from the revolution.”

At first, many rebel groups were involved in these extractive activities, but since January, when it assumed control of Raqqa, the capital of the province of that name, ISIS has been the dominant player in the oil fields.  In addition, it has seized fields in neighboring Deir al-Zour Province along the Iraq border.  Indeed, many of the U.S.-supplied weapons it acquired from the fleeing Iraqi army after its recent drive into Mosul and other northern Iraqi cities have been moved into Deir al-Zour to help in the organization’s campaign to take full control of the region.  In Iraq, ISIS is fighting to gain control over Iraq’s largest refinery at Baiji in the central part of the country.

It appears that ISIS sells oil from the fields it controls to shadowy middlemen who in turn arrange for its transport — mostly by tanker trucks — to buyers in Iraq, Syria, and Turkey.  These sales are said to provide the organization with the funds needed to pay its troops and acquire its vast stockpiles of arms and ammunition.  Many observers also claim that ISIS is selling oil to the Assad regime in return for immunity from government air strikes of the sort being launched against other rebel groups.  “Many locals in Raqqa accuse ISIS of collaborating with the Syrian regime,” a Kurdish journalist, Sirwan Kajjo, reported in early June.  “Locals say that while other rebel groups in Raqqa have been under attack by regime air strikes on a regular basis, ISIS headquarters have not once been attacked.”

However the present fighting in northern Iraq plays out, it is obvious that there, too, oil is a central factor.  ISIS seeks both to deny petroleum supplies and oil revenue to the Baghdad government and to bolster its own coffers, enhancing its capacity for nation-building and further military advances.  At the same time, the Kurds and various Sunni tribes — some allied with ISIS — want control over oil fields located in the areas under their control and a greater share of the nation’s oil wealth.

Ukraine, the Crimea, and Russia

The present crisis in Ukraine began in November 2013 when President Viktor Yanukovych repudiated an agreement for closer economic and political ties with the European Union (EU), opting instead for closer ties with Russia.  That act touched off fierce anti-government protests in Kiev and eventually led to Yanukovych’s flight from the capital.  With Moscow’s principal ally pushed from the scene and pro-EU forces in control of the capital, Russian President Vladimir Putin moved to seize control of the Crimea and foment a separatist drive in eastern Ukraine.  For both sides, the resulting struggle has been about political legitimacy and national identity — but as in other recent conflicts, it has also been about energy.

Ukraine is not itself a significant energy producer.  It is, however, a major transit route for the delivery of Russian natural gas to Europe.  According to the U.S. Energy Information Administration (EIA), Europe obtained 30% of its gas from Russia in 2013 — most of it from the state-controlled gas giant Gazprom — and approximately half of this was transported by pipelines crossing Ukraine.  As a result, that country plays a critical role in the complex energy relationship between Europe and Russia, one that has proved incredibly lucrative for the shadowy elites and oligarchswho control the flow of gas, whille at the same time provoking intense controversy. Disputes over the price Ukraine pays for its own imports of Russian gas twice provoked a cutoff in deliveries by Gazprom, leading to diminished supplies in Europe as well.

Given this background, it is not surprising that a key objective of the “association agreement” between the EU and Ukraine that was repudiated by Yanukovych (and has now been signed by the new Ukrainian government) calls for the extension of EU energy rules to Ukraine’s energy system — essentially eliminating the cozy deals between Ukrainian elites and Gazprom.  By entering into the agreement, EU officials claim, Ukraine will begin “a process of approximating its energy legislation to the EU norms and standards, thus facilitating internal market reforms.”

Russian leaders have many reasons to despise the association agreement.  For one thing, it will move Ukraine, a country on its border, into a closer political and economic embrace with the West.  Of special concern, however, are the provisions about energy, given Russia’s economic reliance on gas sales to Europe — not to mention the threat they pose to the personal fortunes of well-connected Russian elites.  In late2013 Yanukovych came under immense pressure from Vladimir Putin to turn his back on the EU and agree instead to an economic union with Russia and Belarus, an arrangement that would have protected the privileged status of elites in both countries.  However, by moving in this direction, Yanukovych put a bright spotlight on the crony politics that had long plaguedUkraine’s energy system, thereby triggering protests in Kiev’s Independence Square (the Maidan) — that led to his downfall.

Once the protests began, a cascade of events led to the current standoff, with the Crimea in Russian hands, large parts of the east under the control of pro-Russian separatists, and the rump western areas moving ever closer to the EU.  In this ongoing struggle, identity politics has come to play a prominent role, with leaders on all sides appealing to national and ethnic loyalties.  Energy, nevertheless, remains a major factor in the equation.  Gazprom has repeatedly raised the price it charges Ukraine for its imports of natural gas, and on June 16th cut off its supply entirely, claiming non-payment for past deliveries.  A day later, an explosion damaged one of the main pipelines carrying Russian gas to Ukraine — an event still being investigated.  Negotiations over the gas price remain a major issue in the ongoing negotiations between Ukraine’s newly elected president, Petro Poroshenko, and Vladimir Putin.

Energy also played a key role in Russia’s determination to take the Crimea by military means.  By annexing that region, Russia virtually doubled the offshore territory it controls in the Black Sea, which is thought to house billions of barrels of oil and vast reserves of natural gas.  Prior to the crisis, several Western oil firms, including ExxonMobil, were negotiating with Ukraine for access to those reserves.  Now, they will be negotiating with Moscow.  “It’s a big deal,” said Carol Saivetz, a Eurasian expert at MIT.  “It deprives Ukraine of the possibility of developing these resources and gives them to Russia.”

Nigeria and South Sudan

The conflicts in South Sudan and Nigeria are distinctive in many respects, yet both share a key common factor: widespread anger and distrust towards government officials who have become wealthy, corrupt, and autocratic thanks to access to abundant oil revenues.

In Nigeria, the insurgent group Boko Haram is fighting to overthrow the existing political system and establish a puritanical, Muslim-ruled state.  Although most Nigerians decry the group’s violent methods (including the kidnapping of hundreds of teenage girls from a state-run school), it has drawn strength from disgust in the poverty-stricken northern part of the country with the corruption-riddledcentral government in distant Abuja, the capital.

Nigeria is the largest oil producer in Africa, pumping out some 2.5 million barrels per day.  With oil selling at around $100 per barrel, this represents a potentially staggering source of wealth for the nation, even after the private companies involved in the day-to-day extractive operations take their share.  Were these revenues — estimated in the tens of billions of dollars per year — used to spur development and improve the lot of the population, Nigeria could be a great beacon of hope for Africa.  Instead, much of the money disappears into the pockets (and foreign bank accounts) of Nigeria’s well-connected elites.

In February, the governor of the Central Bank of Nigeria, Lamido Sanusi, told a parliamentary investigating committee that the state-owned Nigerian National Petroleum Corporation (NNPC) had failed to transfer some $20 billion in proceeds from oil sales to the national treasury, as required by law.  It had all evidently been diverted to private accounts.  “A substantial amount of money has gone,” he told the New York Times.  “I wasn’t just talking about numbers.  I showed it was a scam.”

For many Nigerians — a majority of whom subsist on less than $2 per day — the corruption in Abuja, when combined with the wanton brutality of the government’s security forces, is a source of abiding anger and resentment, generating recruits for insurgent groups like Boko Haram and winning them begrudging admiration.  “They know well the frustration that would drive someone to take up arms against the state,” said National Geographic reporter James Verini of people he interviewed in battle-scarred areas of northern Nigeria.  At this stage, the government has displayed zero capacity to overcome the insurgency, while its ineptitude and heavy-handed military tactics have only further alienated ordinary Nigerians.

The conflict in South Sudan has different roots, but shares a common link to energy.  Indeed, the very formation of South Sudan is a product of oil politics.  A civil war in Sudan that lasted from 1955 to 1972 only ended when the Muslim-dominated government in the north agreed to grant more autonomy to the peoples of the southern part of the country, largely practitioners of traditional African religions or Christianity.  However, when oil was discovered in the south, the rulers of northern Sudan repudiated many of their earlier promises and sought to gain control over the oil fields, sparking a second civil war, which lasted from 1983 to 2005.  An estimated two million people lost their lives in this round of fighting.  In the end, the south was granted full autonomy and the right to vote on secession.  Following a January 2011 referendum in which 98.8% of southerners voted to secede, the country became independent on that July 9th.

The new state had barely been established, however, when conflict with the north over its oil resumed.  While South Sudan has a plethora of oil, the only pipeline allowing the country to export its energy stretches across North Sudan to the Red Sea.  This ensured that the south would be dependent on the north for the major source of government revenues.  Furious at the loss of the fields, the northerners charged excessively high rates for transporting the oil, precipitating a cutoff in oil deliveries by the south and sporadic violence along the two countries’ still-disputed border.  Finally, in August 2012, the two sides agreed to a formula for sharing the wealth and the flow of oil resumed. Fighting has, however, continued in certain border areas controlled by the north but populated by groups linked to the south.

With the flow of oil income assured, the leader of South Sudan, President Salva Kiir, sought to consolidate his control over the country and all those oil revenues.  Claiming an imminent coup attempt by his rivals, led by Vice President Riek Machar, he disbanded his multiethnic government on July 24, 2013, and began arresting allies of Machar.  The resulting power struggle quickly turned into an ethnic civil war, with the kin of President Kiir, a Dinka, battling members of the Nuer group, of which Machar is a member.  Despite several attempts to negotiate a cease-fire, fighting has been under way since December, with thousands of people killed and hundreds of thousands forced to flee their homes.

As in Syria and Iraq, much of the fighting in South Sudan has centered around the vital oil fields, with both sides determined to control them and collect the revenues they generate.  As of March, while still under government control, the Paloch field in Upper Nile State was producing some 150,000 barrels a day, worth about $15 million to the government and participating oil companies.  The rebel forces, led by former Vice President Machar, are trying to seize those fields to deny this revenue to the government.  “The presence of forces loyal to Salva Kiir in Paloch, to buy more arms to kill our people… is not acceptable to us,” Machar said in April.  “We want to take control of the oil field.  It’s our oil.”  As of now, the field remains in government hands, with rebel forces reportedly making gains in the vicinity.

The South China Sea

In both the East China and South China seas, China and its neighbors claim assorted atolls and islands that sit astride vast undersea oil and gas reserves.  The waters of both have been the site of recurring naval clashes over the past few years, with the South China Sea recently grabbing the spotlight. 

An energy-rich offshoot of the western Pacific, that sea, long a focus of contention, is rimmed by China, Vietnam, the island of Borneo, and the Philippine Islands.  Tensions peaked in May when the Chinese deployed their largest deep-water drilling rig, the HD-981, in waters claimed by Vietnam.  Once in the drilling area, about 120 nautical miles off the coast of Vietnam, the Chinese surrounded the HD-981 with a large flotilla of navy and coast guard ships.  When Vietnamese coast guard vessels attempted to penetrate this defensive ring in an effort to drive off the rig, they were rammed by Chinese ships and pummeled by water cannon.  No lives have yet been lost in these encounters, but anti-Chinese rioting in Vietnam in response to the sea-borne encroachment left several dead and the clashes at sea are expected to continue for several months until the Chinese move the rig to another (possibly equally contested) location.

The riots and clashes sparked by the deployment of HD-981 have been driven in large part by nationalism and resentment over past humiliations.  The Chinese, insisting that various tiny islands in the South China Sea were once ruled by their country, still seek to overcome the territorial losses and humiliations they suffered at the hands the Western powers and Imperial Japan.  The Vietnamese, long accustomed to Chinese invasions, seek to protect what they view as their sovereign territory.  For common citizens in both countries, demonstrating resolve in the dispute is a matter of national pride.

But to view the Chinese drive in the South China Sea as a simple matter of nationalistic impulses would be a mistake.  The owner of HD-981, the China National Offshore Oil Company (CNOOC), has conducted extensive seismic testing in the disputed area and evidently believes there is a large reservoir of energy there.  “The South China Sea is estimated to have 23 billion tonsto 30 billion tons of oil and 16 trillion cubic meters of natural gas, accounting for one-third of China’s total oil and gas resources,” the Chinese news agency Xinhua noted.  Moreover, China announced in June that it was deploying a second drilling rig to the contested waters of the South China Sea, this time at the mouth of the Gulf of Tonkin.

As the world’s biggest consumer of energy, China is desperate to acquire fresh fossil fuel supplies wherever it can.  Although its leaders are prepared to make increasingly large purchases of African, Russian, and Middle Eastern oil and gas to satisfy the nation’s growing energy requirements, they not surprisingly prefer to develop and exploit domestic supplies.  For them, the South China Sea is not a “foreign” source of energy but a Chinese one, and they appear determined to use whatever means necessary to secure it.  Because other countries, including Vietnam and the Philippines, also seek to exploit these oil and gas reserves, further clashes, at increasing levels of violence, seem almost inevitable.

No End to Fighting

As these conflicts and others like them suggest, fighting for control over key energy assets or the distribution of oil revenues is a critical factor in most contemporary warfare.  While ethnic and religious divisions may provide the political and ideological fuel for these battles, it is the potential for mammoth oil profits that keeps the struggles alive.  Without the promise of such resources, many of these conflicts would eventually die out for lack of funds to buy arms and pay troops.  So long as the oil keeps flowing, however, the belligerents have both the means and incentive to keep fighting.

In a fossil-fuel world, control over oil and gas reserves is an essential component of national power.  “Oil fuels more than automobiles and airplanes,” Robert Ebel of the Center for Strategic and International Studies told a State Department audience in 2002.  “Oil fuels military power, national treasuries, and international politics.”  Far more than an ordinary trade commodity, “it is a determinant of well being, of national security, and international power for those who possess this vital resource, and the converse for those who do not.”

If anything, that’s even truer today, and as energy wars expand, the truth of this will only become more evident.  In our present world, if you see a conflict developing, look for the energy.  It’ll be there somewhere on this fossil-fueled planet of ours.

Posted in War | Comments Off on Michael Klare: Twenty-First-Century Energy Wars

David Korowicz: Catastrophic shocks through complex socio-economic systems

David Korowicz. 2013. Catastrophic Shocks through Complex Socio-Economic Systems.

The globalized economy has become more complex (connectivity, interdependence, and speed), delocalized, with increasing concentration within critical systems. This has made us all more vulnerable to systemic shocks. This paper provides an overview of the effect of a major pandemic on the operation of complex socio-economic systems using some simple models. It discusses the links between initial pandemic absenteeism and supply-chain contagion, and the evolution and rate of shock propagation. It discusses systemic collapse and the difficulties of re-booting socio-economic systems.

1. A New Age of Risk

Consider the following scenarios:

  • A highly contagious pandemic outbreak in South-East Asia (of comparable or greater human impact than the 1918 influenza outbreak) .
  • A disorderly break-up of the Eurozone and global financial system implosion.
  • A “perfect storm” during a time of major global financial instability – there are terrorist attacks on North African oil installations (partially driven by social unrest arising from record food prices) & a category 5 hurricane hits a major population/ industrial/ oil producing regions of the US east coast.

These are all examples of potential global shocks, that is hazards that could drive fast and severe cascading impacts mediated through global systems. Global systems include telecommunications networks; financial and banking networks; trade networks; and critical infrastructure networks. These systems are themselves highly interdependent and together form part of the globalized economy.

One of the primary issues for this paper are, given any significant hazard, how does the impact spread through the globalized economy and in what way are we vulnerable to the failure of interconnected systems. To answer this we need to understand how complex societies are connected and how they have changed over time. The globalized economy is an example of a complex adaptive system that dynamically links people, goods, factories, services, institutions and commodities across the globe.

The state is characterized by exponential growth in Gross World Product of about 3.5% per annum over nearly 200 years within a range of several percentage points. This had correlated with emergent and self-organizing growth in socio-economic complexity which is reflected in the growth of the:

  • Number of interacting parts (nodes): This includes exponential population growth; the 50,000+ different items available in Wal-Mart; the 6 billion+ digitally connected devices; the number of cars, factories, power plants, mines and so on.
  • Number of linkages (edges): This includes the 3 billion passengers traveling between 4000 airports on over 50 million flights each year; the 60,000 cargo ships moving between 5000 ports with about a million ship movements a year; the average number of media channels (internet sites, TV channels, twitter feeds) per person times the population; and the billions of daily financial transactions.
  • Levels of interdependence between nodes: The growing number of inputs necessary to make a good, service, livelihood, infrastructural output or the function of society as a whole.
  • The speed of processes (or time compression) :This includes the increasing speed of financial transactions; transportation; digital signaling; and Just-In-Time logistics. If we consider the globalized economy as a form of singular organism, we can understand this process as an increasing metabolic rate.
  • Efficiency: increasing competition and global trade arbitrage driving down inventories; and globalized economies of scale.
  • Concentration: The emergence of ʻhubsʼ within the globalized economy- a small number of very highly connected nodes whose function (or loss of function) have a disproportionate role in the operation of the globalized economy . For example, banks are not connected at random to other banks, rather a very small number of large banks are highly connected with lots of other banks, who have few connections to each other. These arrangements are sometimes known as scale-free networks. We can also see concentration in critical infrastructure, and trade networks.
  • De-localization: The conditions of personal welfare; business or service output; or countryʼs economic output is smeared over the whole globalized economy. The corollary is that if there is a major failure of the systems integration in the globalized economy, a localized community may have extreme difficulties meeting its basic needs.

Economic and complexity growth have in many ways reduced risk. Localized agricultural failure once risked famine in isolated subsistence communities, but now such risk is spread globally. It has made critical infrastructure such as sewage treatment and clean water available and affordable. Global financial markets enable an array of risks, from home insurance and pensions to default risk and export credit insurance, to be dispersed and potential volatility reduced. Indeed, what is remarkable is just how reliable our complex society is given the number of time sensitive inter-connections.

Another way of saying all this is that our society is very resilient, within certain bounds, to a huge range interruptions in the flow of goods and services. Within those bounds our society is self-stabilizing. For example supply-chain shocks from the Japanese tsunami in 2011, the eruption of the Icelandic Eyjafjallajokull volcano in 2010 or the UK fuel blockades in 2000 all had severe localized effects in addition to shutting down some factories across the world as supply-chains were interrupted. However the impacts did not spread and amplify, and normal functioning of the local economy quickly resumed.

But we know from many complex systems in nature and society that a system can rapidly shift from one state to another as a threshold is crossed (Scheffer 2009). One way a state shift can occur is when a shock drives the system out of its stability bounds. The form of those stability bounds can increase or decrease resilience to shocks depending upon whether the system is already stressed prior to the shock.

The commonalities of global integration mean that diverse hazards may lead to common shock consequences. The systems that transmit shocks are also the systems we depend upon for our welfare and the operation of businesses, institutions and society, so to borrow Marshal McLuhanʼs phrase, the medium is the message. One of the primary consequences of a generic shock is an interruption in the flow of goods and services in the economy. This has diverse and profound implications – including food security crises, business shut-downs, critical infrastructure risks and social crises. This can in turn quickly destroy forward looking confidence in an economy with major consequences for financial and monetary stability which depend ultimately on the collateral of real economic production. More generally it can entail multi-network and de-localized cascading failure leading to a collapse in societal complexity.

Previously the dynamics of such a scenario was studied when the initial shock was caused by a systemic banking collapse and monetary shock. This coupled the exchange of goods and services causing financial system supply-chain cross contagion and a re-enforcing cascade of de-localizing multi-system risk (Korowicz 2012). In this paper a similar methodology is used to look at the socio-economic implications of a major pandemic.

2. Socio-economic Impact of a Major Pandemic

We are interested in the socio-economic implications of a major influenza pandemic whose initial impact would be direct absenteeism from illness and death, and absenteeism for family and prophylactic reasons. The pandemic wave (we will only consider one) lasts 10-15 weeks. We assume this causes an absenteeism rate of 20% or 40% over the peak period of 2-4 weeks, and a rate above 20% for 4-8 weeks when the peak is 40%. This represents our initial impact. Our question is then what happens next.

Some key personnel that might not show up for work are in health care, shipping / train / truck drivers, (and I’ve read elsewhere that the electric grid might fail if key workers don’t show up because they’re afraid of catching something at work, and that would bring ALL systems down).

how a health service would manage a pandemic when its own operation is compromised

3. Vulnerability Revealed

One way to understand complex socio-economic systems is to study occasions when there has been some systemic failure. In September 2000 truckers in the United Kingdom, angry at rising diesel duties, blockaded refineries and fuel distribution outlets. Consequences:

a)      The petrol stations reliance on Just-In-Time re-supply meant the impact was rapid. Within 2 days about half of the petrol stations had run out of fuel and supplies to industry and utilities had begun to be severely affected.

b)     People couldn’t get to work and businesses could not be re-supplied.

c)      Supermarkets had begun to run out of food

d)     Large parts of the manufacturing sector were about to shut down

e)      Hospitals began to offer emergency only care

f)       Automatic cash machines could not be re-supplied

g)      The postal service was severely affected.

h)      There was panic buying at supermarkets and petrol stations.

i)        It was estimated that after the first day an average 10% of national output was lost. Surprisingly, at the height of the disruption, commercial truck traffic on the UK road network was only 10-12% below average values. There were clear indications that had the fuel blockades gone on just a few days longer large parts of UK manufacturing including the automotive, defense and steel industries would have had to shut down.

Failure of production or supply from one area can shut down factories on the other side of the world within days of the initial interruption as was seen in the 2010 Icelandic volcano eruption in 2010 and the 2011 Japanese tsunami and Thai flooding.

A report from the think-tank Chatham House on the impacts of the Icelandic volcano and subsequent interviews with businesses about its impact and their preparedness came to the general conclusion: “One week seems to be the maximum tolerance of a Just-In-Time economy”…..before major shut-downs in business and industries would occur, and things would not just return to normal afterwards. … many businesses said that had the disruption continued just a few days longer, it would have taken at least a month for companies to recover” And a quote from a desk study on the impact of a one week long absence of (just) trucks in the UK economy, things would not just return to normal (McKinnon 2006): “..After a week, the country would be plunged into a deep social and economic crisis. It would take several weeks for most production and distribution systems to recover”

The studies do not consider what would happen if the primary disruption were to continue for many weeks.

4. Interdependence, Liebigʼs law, and Cascading

One of the defining features of rising complexity is growing interdependence. Now, the output of a person, service provider, factory, piece of critical infrastructure, etc., depends upon ever more inputs, be they tools, intermediate products, consumables, specialist skills and knowledge or collective societal infrastructures. And those outputs in turn become further inputs through the dispersed networks of the globalized economy.

Some of the least substitutable critical inputs are labeled hubs. Hubs are things like electricity, fuel, water, and financial system functionality – things generally referred to as critical infrastructure. They are societal services and functions upon which all society depends.

A simple but important principle, Liebig ʼs Law of the Minimum, says that the production is constrained by the scarcest critical input. So even if you have ample supplies of all but one critical input, your production fails. That is, production fails on the weakest link.

This explains why the most exposed businesses to supply-chain failure are the most complex businesses. First they have some of the most inputs (making a car can mean assembling up to 15,000 components). Second, they have more inputs are very complex and specialized, and so cannot be easily substituted. Alternative production lines might not be available or take months to re-engineer or specialist skills may be in limited supply. Thus, auto and electronics manufacturers were some of the most affected by the Icelandic volcano, the Japanese tsunami and the Thai flooding in 2011. What Liebig ʼs law shows is that you do not need to lose everything to stop a business, service or function or society – just the right bit. This helps to explain why a loss of only 10-12% of commercial vehicles had such a big impact during the fuel blockades in the U.K. As our economies have become more complex we have been adding more inputs into our lives, goods and services, and the functioning of our societies. More of these are critical with low substitutability.

Let us now apply Liebig’s law to pandemic absenteeism. The people affected by a pandemic are part of the supply of inputs to any systems function. There may be many people contributing to one output of a business, service or function. We assume that most employees are either unnecessary for the period of the pandemic, can telecommute, or are easily substituted. But there is a smaller number of sub-functional roles occupied most likely by those with specialist skills who are critical with low substitutability. If any one of them is unavailable, the sub-functional role fails and with that, the output of the whole organization/ function.

With the loss of this output good or service (especially if it is critical with low substitutability) other businesses and services may be affected potentially causing cascading affects through complex socioeconomic networks as a whole.

5. Time and Cascading Failure

There is always a level of absenteeism and a percentage of goods and services that can’t be delivered for whatever reason. The reason you don’t have supply-chain contagion spreading with every problem is that complex societies are efficient at finding alternative suppliers, and some inventories are carried to help when there is a hiatus. Also, most factories don’t produce very critical things or there is lots of substitutability. One won’t miss a brand of toothpaste in the supermarket when there are 20 brands available.

To initiate a cascading failure:

1)      It has to be large scale, i.e. from a major hub failure or large enough absenteeism.

2)      The function needs to be central, like the electric grid, financial system, or pandemic that keeps people from going to work. All of these are critically connected to other parts of a socio-economic network. Thus the effects of a pandemic or hub failure in a weakly connected country, Mali say, would be unlikely to spread supply-chain failure widely. Thus we can conclude that there might be point above which supply-chain contagion takes off, and below which the society is still operational and recovery can occur. This point depends upon the initial pandemic absenteeism rate and the societies complexity at the epicenter of the pandemic.

A simple model of supply-chain failure can be based upon the idea that the more supply-chains are disrupted or infected, the greater the chance that further supply-chains will be infected

6. External Cross-Network Contagion

Imagine a pandemic outbreak occurs in South-East Asia. The main vectors through which a shock could propagate outside the region are pandemic contagion, financial system contagion, and supply-chain contagion.

We would expect the shock to spread at different rates (banking shock could travel faster than supply-chain contagion because the operational speed of the financial system is greater than the inventory turn-over time).

Some countries’ role in trade is far more important to the globalized economy than others. The more important the initially impacted region is, the greater is the likelihood of spreading supply-chain contagion globally. Kali measured countries’ influence on global trade, not only by trade volumes, but the influence a country has on the global trading system. They used an Importance Index to rank their influence. For example, they find that Thailand, which was at the center of the 1997-1998 Asian financial crisis ranked 22nd in terms of global trade share, but 11th on their level of importance. In another study, Garas used an epidemic model to look at the potential any country had to spread a crisis. One of their data sets is based upon international trade in 2007. It uses a measure of centrality to identify countries with the power to spread a crisis via their level of trade integration. Like the previous paper, the centrality in the network does not necessarily correspond to those countries with the highest trade volumes. There are 12 inner core countries, which are listed in no particular order are: China, Russia, Japan, Spain, UK, Netherlands, Italy, Germany, Belgium-Luxembourg, USA, and France.

Hidalgo used international trade data to look at two things – the diversity of products a country produces, and the exclusivity of what they produce. An exclusive product is something made by few other countries. Most countries in the world are non- diversified and make standard products. The most complex countries are diversified and make more exclusive products. More exclusive products have less substitutability.

Financial system contagion outside the initially impacted region could be through banking networks, the bond market, the shadow banking system, currency volatility and confidence. Again the structure of financial networks and the centrality of the region with respect to financial assets and liabilities would determine the extent of any shock.

More broadly, if an economy was shattered, and its forward looking viability looked both precarious and uncertain one would expect a collapse in the value of a country’s currency. Rather than helping exports (which would be very little because the economy’s productive capacity had collapsed), it would hinder imports of emergency supplies and make debt in external currencies much more difficult to service. The economic damage and reduced economic prospects may then cause tightened credit conditions, spiraling bond yields and systemic bank failure.

There are also issues that are most pertinent for more complex societies. We imagine that after a pandemic wave people are again available for work. But people cannot however become productive immediately because other inputs are also needed. But those inputs are stalled because they rely upon other inputs and so on. More broadly we may define Recursion failure as: “the inability of a complex economy to easily resume production and trade after a significant collapse because in a complex and interdependent economy, production and trade must resume in order for production and trade to resume”.

Further, even if a government wanted to rebuild, it may be too complex to orchestrate resumption from the top down. This is because the economy has evolved by self-organization. Nobody ever put its elements together in the first place. And even if it could be done, the systems of command, control and supply that might do it would be the very systems that had been undermined. Over time entropy would become an issue as engines rust, reagents become contaminated and expected maintenance and repairs left undone. This would all add to the cost and inputs needed for resumption.

The longer a socio-economic system spends in the critical regime, the more likely it is to undergo a complete systemic collapse and loss of basic function. In addition, the longer it spends in this state, the more difficult it may be to ever return to its pre-pandemic state. This is a complex society’s equivalent of a heart attack. When a person has a heart attack, there is a brief period during which CPR can revive the person. But beyond a certain point when there has been cascading failure in co-dependent life support systems, the person cannot be revived. This means that the socioeconomic system could be changed irretrievably and the job of society and government would be to both manage the crisis and plot a fundamentally different path.

To make the systems we depend upon more resilient ideally we would want more redundancy within critical systems and weaker coupling between them.

Localization and de-complexification of basic needs (food, water, waste etc) would provide some societal resilience if systems resilience was lost. We would have more buffering at all levels, that is, larger inventories throughout society. All this is the very opposite of the direction of economic forces.

The reason we have such tight inventories, tight coupling, and concentration in critical infrastructure is they bring efficiency and competitive advantage. But when something goes wrong, this makes recovery harder. For example, during super-storm Sandy, fuel shortages were exacerbated by low inventories that were the direct result of cost cutting arising from the financial crisis.

We are locked into socio-economic processes that are at an increasingly complex that make us ever more vulnerable. Increasing vulnerability coupled with increasing hazard mean that the risk of a major socio-economic collapse is rising.

Because a permanent state shift could occur, planning needs to consider how to deal with non-reversion to pre-shock conditions.

Posted in David Korowicz, Stages of | 1 Comment

From Wood (10,000 BC to 1750) to coal (1750-1920) to Oil, Natural Gas, & Electricity to What?

Cutler J. Cleveland . Energy Quality, Net Energy, and the Coming Energy Transition.  Department of Geography and Center for Energy and Environmental Studies, Boston University

The level of health, food security and especially material standard of living that exists today throughout the world is made possible by the expansive use of fossil fuels. While many take this affluence for granted, a long run view illustrates that the fossil fuel era is relatively new and will last for a relatively short period of time. For thousands of years prior to the Industrial Revolution, human societies were powered by the products of photosynthesis, principally fuel wood and charcoal. Widespread use of coal did not develop until the 18th century, oil and gas not until the late 19th century.

In 1800, the nation was fueled by animal feed, which powered the draft animals on farms, and wood — used for domestic heating and cooking and by early industry.

Wood and animal feed rapidly disappeared when coal became the dominant fuel, the latter due to the introduction of the first tractor in 1911.

The Industrial Revolution transformed the nation’s energy picture, substituting coal for wood on a massive scale.

By the time of World War I, coal accounted for nearly 75% of energy use. But coal’s place as the dominant fuel was fleeting as well.

Oil and natural gas quickly replaced coal, just as coal had replaced wood.

By the 1960s, oil and gas together accounted for more than 70% of total energy use; coal had dropped to less than 20%. Primary electricity has played a small but steadily growing role. Primary electricity refers to electricity generated by hydroelectric, nuclear, geothermal, solar, and other so-called “primary sources. The increase in the share of primary electricity towards the end of the period is due to the rise in nuclear generating capacity.

This long run view of energy raises an important question: what guided these transitions in the past, and to what extent can such information inform us about the impending transition from fossil to renewable fuels?

The transition from one major energy system to the next is driven by a combination of energetic, economic, technological and institutional factors. The energy-related forces stem from the tremendous economic and social opportunities that new fuels, and their associated energy converters, offered compared to earlier ones.

Energy plays a critical role in nature.

All organisms must use energy to perform a number of life-sustaining tasks such as growth, reproduction, and defense from predators. The most fundamental task of all is using energy to obtain more energy from the environment. When energy is used to do useful work, energy is degraded from a useful, high quality state to a less useful low quality state. This means that all systems must continuously replace that energy they use, and to do so takes energy.

This fundamental reality means that Energy Returned on Invested (EROI) and net energy are used to explain the foraging behavior of organisms, the distribution and abundance of organisms and the structure and functioning of ecosystems

For the overwhelming majority of their existence, humans obtained energy from the environment by hunting and gathering.

The EROI for food capture is the caloric value of the food capture to the expenditure of energy in the capture or gathering process.

Natural ecosystems produce enough edible food energy to support hunter-gatherers at densities no greater than one person per square kilometer. Traditional agricultural societies support hundreds of people square kilometer, enabling permanent settlements to grow in size and number. The greater surplus released labor from the land, creating the potential for people to move to urban areas and work in manufacturing and industry.

The economic usefulness of an energy converter is determined in part by its power, the rate at which it converts energy to do useful work.

Humans and draft animals convert energy to work at low power outputs. The energetic limits of people and draft animals set very definite economic and social limits.

The Industrial Revolution erased these limits with the introduction of the steam engine, which had a power output that dwarfed that of muscle power.

The higher power output of the steam engine enabled it to deliver a much large energy surplus than human labor or draft animals.

Given the economic advantage offered by heat engines powered by fossil fuels, it is no surprise that labor and draft animals we rapidly replaced by heat engines once they became available.

The United States’ economy illustrates this transition. In 1850, more than 90% of the work done in the economy was accomplished by human labor and draft animals.

Over the next half-century, engines powered by wood and then coal rapidly displaced the animate converters.

By the 1950s, labor and animals had almost been completely displaced. Of the economic changes driven by the new fuels and machines, one of the most dramatic was the effect on labor productivity. In agriculture, for example, the productivity of labor increased more than 100-fold relative to rates possible prior to the Industrial Revolution. This increase in labor productivity reduced the need for farm labor and workers moved to industrial jobs.

How strong is the connection between energy use and economic growth?

One hypothesis is that the link is weak.  This is because it’s assumed that as fossil fuels become scarcer, their price will rise, which in turn will trigger technological changes and substitutions that improve energy efficiency. Indeed, many believe that the price shocks in 1973-74 and 1979-80 led to the adoption of many new energy efficient technologies. Second, the shift to a service-oriented, dot-com economy will de-couple energy use from economic activity. A dollar’s worth of steel requires 93,000 Btu to produce in the United States; a dollar’s worth of financial services uses 9,500 Btu. Thus, it stands to reason that a shift towards less-energy intensive activities will reduce the need for energy.

A second hypothesis is that the connection between energy use and economic output is strong.   The heat equivalent of a fuel is just one of the attributes of the fuel and ignores the context in which the fuel is used, and thus cannot explain, for example, why a thermal equivalent of oil is more useful in many tasks than is a heat equivalent of coal.

Because of the variation in attributes among energy types, the various fuels and electricity are less than perfectly substitutable in production or consumption. For example, a Btu of coal is not perfectly substitutable with a Btu of electricity; since the electricity is cleaner, lighter, and of higher quality, most people are willing to pay a premium price per Btu of electricity.

Consider incoming solar energy. The land area of the lower 48 United States intercepts 500 times of the nation’s annual energy use. But that energy is spread over nearly 3 million square miles of land, so that the energy absorbed per unit area is very small. Plants, on average, capture only about 0.1% of the solar energy reaching the Earth. This means that the actual plant biomass production in the United States is very small (compared to the overall incoming solar energy).

Power density combines two attributes of energy sources: the rate at which energy can be produced from the source and the geographic area covered by the source. A coal mine in China, for example, can produce upwards of 10,000 watts per square meter of the mine. As the above examples indicate most solar technologies have low power densities compared to fossil fuels.

A low energy and power density means that large amounts of capital, labor, energy and materials must be used to collect, concentrate and deliver solar energy to users.

This makes them more expensive than fossil fuels. The difference between solar and fossil energy is best represented but their energy return on investment (EROI). The EROI for fossil fuels tends to be large while that for solar tends to be low. This is the principal reason that humans aggressively developed fossil fuels in the first place. Fossil fuels have allowed us develop lifestyles that also are very energy intensive. The places that we live, work and shop have very high power densities. Supermarkets, office buildings and private residences in industrial nations demand huge amounts of energy. This very energy-intensive way of living, working, and playing have been made possible by fossil fuels sources that are equally as concentrated. Another quality difference between renewable fuels and fossil fuels is their energy density: the quantity of energy contained per unit mass of a fuel. For example, wood contains 15 Mj per kilogram; oil contains up to 44 Mj per kilogram.

Conclusion

Among the countless technologies humans have developed, only two have increased our power over the environment in an essential way.

Georgescu-Roegen called these Promethean technologies. Promethean I was fire, unique because it was a qualitative conversion of energy (chemical to thermal) and because it generates a chain reaction that sustains so long as sufficient fuel is forthcoming. The mastery of fire enabled man not only to keep warm and cook the food, but, above all to smelt and forge metals, and to bake bricks, ceramics, and lime. No wonder that the ancient Greeks attributed to Prometheus (a demigod, not a mortal) the bringing of fire to us.

Promethean II was the heat engine. Like fire, heat engines achieve a qualitative conversion of energy (heat into mechanical work), and they sustain a chain reaction process by supplying surplus energy. Surplus energy or (net energy) is the gross energy extracted less the energy used in the extraction process itself. The Promethean nature of fossil fuels is due to the much larger surplus they deliver compared to muscle energy from draft animals or human labor.

The energy surplus delivered by fossil fuel technologies is the energetic basis of the Industrial Revolution.


Posted in Wood | 2 Comments

Increasing population + declining fossil fuels = less population

[ This essay looks at the human footprint on the planet, how it grew so large, the problems it causes, and the consequences.

Alice Friedemann   www.energyskeptic.com  author of “When Trucks Stop Running: Energy and the Future of Transportation”, 2015, Springer and “Crunch! Whole Grain Artisan Chips and Crackers”. Podcasts:  KunstlerCast 253, KunstlerCast278, Peak Prosperity]

Now that oil, coal, and natural gas are at peak production or will be soon, how can any rational person argue there’s no need for birth control and less immigration with 5 of the 7 billion humans alive due to fossil fuels?

Not only that, we’re driving other species extinct now that we’re using up three-quarters of the Earth’s land:

  • 1%     Urban and infrastructure
  • 11.7%  Cropland
  • 26.8%  Forestry
  • 36%     Livestock grazing. 20% of all animal biomass on the planet (UNFAO 2006).

The 24.5% that we aren’t using is:

  • 12.5%  Rocky, desert, or covered with snow
  • 7.4%    Unproductive arctic and alpine tundra, grasslands
  • 4.6%    pristine forests, including boreal and tropical rainforests
Source: (Erb, 2009 – doesn’t include Greenland or Antarctica)

A Litany of Evils caused by overpopulation and immigration

  • Aquifer depletion, especially northwestern India, northern and western China, northern Mexico, Iraq, Yemen, Pakistan, and Syria
  • Climate change
  • Climate refugees: New Orleans among the first climate refugees – soon those in London, New York, Washington, Miami, Shanghai, Kolkata, Cairo and Tokyo will join them.
  • Storms from higher surface water temperatures in Central America, the Caribbean, the Atlantic and Gulf coasts of the USA, East and Southeast Asia, japan, China, Taiwan, the Philippines, Viet Nam, and Bangladesh.
  • Desertification. Expanding deserts include the Sahara into Morocco, Tunisia, and Algeria. The Sahelian is moving southward into Nigeria. Deserts are forcing migrations in Iran, Brazil, and Mexico. The expansion of deserts in China has accelerated since 1950. 24,000 villages have been abandoned partially or entirely. The Gobi desert grew as much as half of Pennsylvania in just 5 years and is within 150 miles of Beijing. The 1930s dust bowl forced 2 million people to leave Oklahoma, Texas and Kansas. As the Ogalalla aquifer continues to deplete, the conditions for even larger dust bowls grows more likely.
  • Extinction
  • Invasive species
  • Pollution refugees: Love canal, Times Beach Missouri, Chernobyl area, cancer villages in China, Fukushima
  • Rising oceans
  • Water shortages
  • Toxic pollutants in local environments
  • Wildlands lost, wildlife habitat fragmented, converted to farmland, reservoirs, power lines, roads, mines, logging, overgrazing, bottom trawling, urban sprawl

What’s at stake: 5 billion people dying, starvation, disease, Genocide and madness on the scale of the Nazis, Rwandan Hutu-Tutsi, North Korea, Mao, Stalin, nuclear war, chaos, and endless wars.

Feeding the next 3 billion means cutting down the remaining forests, and unprecedented biodiversity destruction as we take over what few bits of wild remain and replace them with soil-eroding, aquifer guzzling, toxic pesticide polluting crops. Most scientists don’t think we can sustain the 7 billion we have now, ten billion is a sick fantasy.

One reason not even 7 billion can survive much longer is that we’re mining topsoil to grow enormous amounts of food now.  This has always been a factor in the fall of civilizations in the past, it just took them longer to destroy their soil in the past (on average 1500 years) because they didn’t have mega-horsepower tractors to compact and till the soil so it could wash and blow away within 100-200 years.  Soil erosion is happening 17 times faster than new soil is being formed on 90% of farmland (IUGS 2013).  Future generations simply won’t be able to grow as much food.

Population growth relentlessly destroys past environmental victories.

A wild river that was once saved gets dammed. A freeway that was once prevented is built, ripping apart the ecosystem and tight-knit neighborhoods.

A million acres of prime farmland in America is paved over by sprawl every year

2.2 million acres if you include wild land.  Who benefits? Developers and businesses that can pay cheap wages.

Overpopulation was caused by coal, oil, and natural gas

Fossil fuels allowed up to agricultural intensification and equally important — the ability to harvest, preserve, and deliver food before it spoiled in myriad ways:

  1. Iron made with coal rather than charcoal is what launched the industrial revolution and made combustion engines, tractors, vehicles, etc., possible
  2. Trains delivering food to inland areas of famine and later trucks that could deliver food and other essential goods anywhere
  3. Up to five times as much food grown with Haber Bosch nitrogen natural-gas fertilizers
  4. Public Health – clean water and food (i.e. sewage and water treatment, etc., raised average lifespans far more than medicine and continues to do so)
  5. Container ships, above all, made globalization possible (Levinson). America now imports half of its food.

Fossil Fuels have allowed us to go way past carrying capacity

Since the 1980s we’ve been using about 1.5 Earths by burning vast troves of oil, coal, and natural gas. This energy allowed us to go way beyond our carrying capacity by intensifying agriculture and using up resources that would have otherwise been preserved for future generations.

There are many other reasons why population went up

  • Wanting children is a biological drive
  • Abortions and birth control were hard to come by
  • Capitalism depends on endless growth
  • Religious leaders depend on endless growth of worshippers to amass power and wealth
  • Before oil-based weapons systems, the largest army was the most likely victor
  • Political, military, business (especially real estate) leaders want more voters, the largest armies, and more consumers which leads to abortions being banned and birth control hard to come by
  • Humans don’t think very well, see my list of “Over 250 cognitive biases, fallacies and more” at energyskeptic, or read Carol Tavris’s book “Mistakes Were Made But Not by Me: Why We Justify Foolish Beliefs, Bad Decisions, & Hurtful Acts”
  • It is taboo to be realistic. Reality-based talk is labeled pessimism and dismissed. Happy endings to Hollywood movies, lack of critical thinking skills and science in schools, and other cultural factors in America have taken this “must always be optimistic” to such a crazy level that “Positive Thinking” ought to be in the DSM-5. Some good books to read: Ehrenreich’s “Bright-sided: How the Relentless Promotion of Positive Thinking Has Undermined America” and Kuntsler’s “Too Much Magic: Wishful Thinking, Technology, and the Fate of the Nation”
  • The business need to make products break so more products could be sold led to a much earlier peak of resources. Read Slade’s “Made to Break Technology and Obsolescence in America”.
  • Even people who were aware of “The State Of The World” had children, hoping that “The Scientists Would Come Up With Something”.
  • We live in the moment. Today. People have a hard time imagining they’ll be hungry tomorrow after a large meal. Even if you could convince people that times would be hard decades ahead, that would not be a strong enough reason to refrain from having kids.

America could have stayed below 200 million

Several systems ecologists have estimated that the carrying capacity of the United States without fossil fuels is somewhere between 100 and 250 million people.  How do we get from over 317 million to 100 million in less than 20-30 years?  It’s already too late for no immigration or one-child per woman to do the trick, but still, both of these would help a bit.

Limiting our population in America would have a huge impact.

Americans consume 5 times as much as the average person, so 317 million Americans is the same as 1.58 billion Chinese.

Exponential Growth: Sustainability Impossible

Above all, if the concept of exponential growth had been taught in schools, or explained by journalists and environmental groups, Americans would be more willing to have fewer children.

Here’s how Albert Bartlett explains it: “The growth in one doubling time is greater than the total growth during all the preceding doubling times”.  For instance, oil production. Over 100 years world oil production grew 7% per year. That’s 10 doublings which means 1970 oil production was a thousand times more than in 1870. So every decade, more oil was produced than in all preceding decades.

Similarly, with each doubling of population, we cause as much destruction as all of the preceding doublings.

It took 5,000 years for population to double from 1 to 2 million people between 20 and 15 thousand years ago at a rate of almost zero growth. But it only took 37 years to go from 2 to 4 billion between 1930 and 1976. Now, 37 years later, we haven’t quite doubled, but we’re close — 7.13 billion. The rate of population growth has gone down very slightly, but the rate is still exponential, and orders of magnitude larger than the almost zero rate for most of human history.

Global population grew at a 1.6% compound rate from 1970 to 2010. So if  there were 15 million people 13,500 years ago, we’d have over a google of people now at a 1.6% compound rate.  A google has 100 zeros.

Once Upon a Time, people understood population mattered

1963 President Johnson told the United Nations that “five dollars invested in population control is worth 100 dollars invested in economic growth” (Erlich 1970)

1968 President Eisenhower: “once as president, I thought and said that birth control was not the business of our Federal Government. The facts changed my mind…I have come to believe that the populatin explosion is the world’s most critical problem.”

1976 Gallup poll: 84% said they didn’t want more people in the United States (Hays). The population was 200 million back then.

The consequences: If journalists and environmental groups had kept population issues and awareness in print we more than half of the American people wouldn’t have to die of starvation, disease, or war in less than a generation (that’s how Mother Nature solves overpopulation).

The consequences: Sprawl and consequent lower carrying capacity

Sprawl is one of the largest environmental problems in America and world-wide. It increases energy and water consumption, air pollution, and destroys wildlife. In the USA between 1982 and 2001 we lost 34,000,000 acres of forest, cropland, and pasture to development, an area the size of Illinois.

Posted in Peak Food, Population | Tagged , , | 2 Comments

Terrorism and the Electric Power Delivery System. National Academy of Sciences.

Much of what follows is from the National Academy of Science 2012  (for the Department of Homeland Security): “Terrorism and the Electric Power Delivery System& 2013 “The Resilience of the Electric Power Delivery System in Response to Terrorism and Natural Disasters”

cyberattack electric grid intruder knowledge

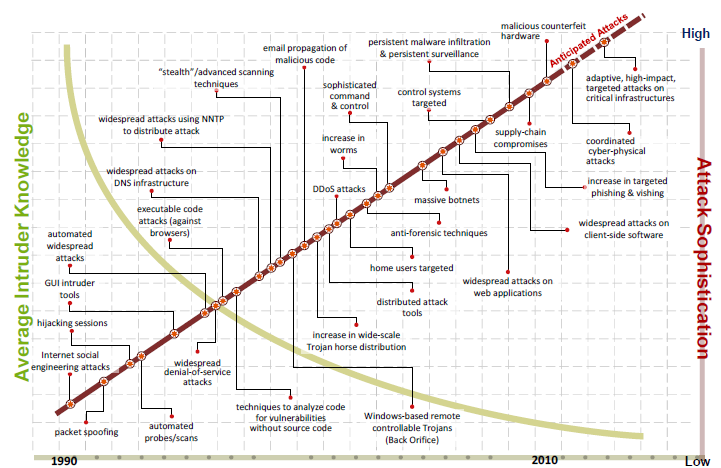
Average intruder knowledge and attack sophistication as a function of time. SOURCE: Presented at the workshop by Patricia Hoffman, Department of Energy, February 27, 2013; from Howard Lipson, Carnegie Mellon University (CMU) Software Engineering Institute CERT®. Copyright 1998-2011.

Introduction

Electricity is ubiquitous, reliable, and taken for granted . . . until the lights go out. Our modern society is almost totally dependent on electrical systems. Electricity is essential to the U.S. economy and way of life. The National Academy of Engineering called the grid the world’s largest integrated machine and a central part of the greatest engineering achievement of the 20th century.

A systematically designed and executed terrorist attack could cause disruptions considerably more widespread and of much longer duration than the largest power system disruptions experienced to date. Since those disruptions have entailed economic impacts approaching 10 billion dollars, it appears possible that terrorist attacks could lead to costs of hundreds of billions of dollars—that is, perhaps as much as a few percent of the U.S. gross domestic product, which is currently about $12.5 trillion. If large, extended outages were to occur during times of extreme weather, they could also result in hundreds or even thousands of deaths due to heat stress or extended exposure to extreme cold.

The reliable operation of the power grid is complex and demanding for two fundamental reasons. First, electricity moves at close to the speed of light (186,000 miles per second, or 297,600 kilometers per second) and is not economically storable in large quantities. Therefore, electricity must be produced the instant it is used. Second, pending the development of affordable control devices, the flow of AC electricity cannot be controlled like a liquid or gas by opening or closing a valve in a pipe, or switched like calls over a long-distance telephone network. Electricity flows freely along all available paths from the generators to the loads in accordance with the laws of physics—dividing among all connected flow paths in the network (U.S.-Canada Power System Outage Task Force, 2004).

A few of the services that fail in a Blackout: Pumping of drinking water, sewage, and irrigation water; the internet, banking, communications, refineries, shipping, and transportation systems; refrigeration, gas station pumps, home and commercial life-support systems (heating, ventilation, and air conditioning), traffic and railroad signals, natural gas and oil (most pipelines use electricity) to power stations, homes, and businesses.

The U.S. power delivery system is extremely complex. It is a network of substations, transmission lines, distribution lines, and less visible automatic and human controls that operate the system, as well as an intricate web of computers and communication systems that tie everything together.

The reliable operation of the power grid is complex and demanding:

  • Electricity moves at close to the speed of light (186,000 miles per second) and is not economically storable in large quantities, so electricity must be produced the instant it is used.
  • Voltage and frequency must be maintained within the extremely narrow range of 59.98 to 60.02 Hz, or power systems and equipment can be damaged, potentially leading to blackouts if the damage spreads widely

A well-executed terrorist attack could cause hundreds of billions of dollars in damage and take out the grid for over a year

Electric systems are not designed to withstand or quickly recover from damage inflicted simultaneously on multiple components. Such an attack could be carried out by knowledgeable attackers with little risk of detection. A large and coordinated attack by terrorists could leave the electric power system in a large region of the country disabled many months or, in absolute worst cases, several years, because substation and generator step-up transformers are vulnerable to attack from within and from outside the substation, are very large, difficult to move, custom-built, and can take over a year to replace. We no longer make them – getting one from another country can take a while because they’re in such high demand across the developing world.

The Grid is an easy target for terrorists. There are 5,800 major power plants connected by 450,000 miles of high-voltage transmission lines spanning thousands of miles to unguarded facilities protected only by a chain-link fence. This makes the electric grid hard to protect, and so it can be severely damaged by a small number of well-informed attackers.

Cyber-attack. The grid depends on complex systems of sensors and automated and manual controls, all of which are tied together through communication systems, so instead of a physical assault; terrorists can cause blackouts by spoofing, jamming, or sending improper signals. Hacking and cyber-attacks are becoming increasingly common.

Military Attacks. Commandos with special training could mount a far stronger attack than even the most sophisticated terrorist group. The object would be to create havoc and demoralization before overt hostilities commence. A hostile country might take this approach if it were unable or unwilling to declare war but wanted to take some military action against the United States. The ultimate attack would be an overt military operation. The vulnerability of electric power systems can have serious national security implications. In World War II, Germany’s highly centralized electric system was not attacked until late in the war. German officials commented after the war that ‘‘The war would have finished 2 years earlier if the Allies had bombed our power plants. This experience will not be ignored in any future hostilities. (OTA 1990)

Terrorist attacks in other countries.   The U.S. Department of State lists over 42 international terrorist groups operating around the world today using rocket propelled grenades, mortars, and small arms. It’s hard, if not impossible, to defend substations from explosions, bullets, or other projectiles fired from a distance. Most attacks so far have come from local groups bent on damaging or destabilizing established ruling power structures. Around 2,500 attacks have occurred over the past 10 years, 528 against substations, 2,539 against transmission towers.

Who’s going to fix the grid? Half of workers retire in 5 to 10 years

As many as half of the 400,000 electric utility workers will be eligible to retire in the next 5 to 10 years. This loss of critical skills and training new workers is a significant problem for the electric utility industry, and likely to make nation’s electric power system will less reliable and more vulnerable to external threats, including terrorist intrusion and disruption from natural disasters.

One reason there aren’t enough employees is that they were fired due to industry restructuring, pressures from Wall Street and regulators, mergers and acquisitions, and the evolution of wholesale markets.

This substantial downsizing has made electric utility jobs far less secure and therefore stressful. Many utility engineers report a substantial broadening of work assignments without the necessary time to become “experts” in their new areas of responsibility. They cover more functions and technical areas at less depth, now that so many engineers have been fired. This in turn has led to few students wanting to go into power engineering as a career, most universities have dropped power engineering, only 12 colleges have this degree now.

As the workforce declines, a significant loss of institutional knowledge is occurring. This knowledge is often not documented, and frequently it is known only to a very few people. When today’s employees leave the workforce, this knowledge leaves with them.

Workforce vulnerability. After a terrorist action, restoration workers themselves may become targets (i.e. several line crews were shot at after Hurricane Katrina). Workers on poles and towers and in open areas in substations are particularly vulnerable. Further complications arise if terrorist attacks involve chemical, radio nuclear, or biological agents. Should a pandemic occur it will touch every part of the electric system in ways few have considered, because if workers don’t show up to run the grid, many essential services will stop running (see blackout list in introduction and table 8.1 below)

What to Do? Too much money to protect every installation, buy all the spare parts

Much of the document deals with how to solve these issues, how to protect facilities, the desperate need for engineers to replace the 50% of retiring workers, and how to get private businesses, industries, and essential services to buy back-up generation.

The researchers conclude it would cost too much money to protect every installation, and too much money to buy all the spare parts needed.

The threat to any given utility is modest, so to spread the risk, there is a program to get utilities to share in the cost of buying spare parts collectively, especially transformers. But EPRI has had difficulty getting the electric power industry to do this, which the NAS report calls “a classic case of “tragedy of the commons.”

I think the ruthless nature of capitalism will prevent an effective collective spare parts collaboration, because each privately owned entity is selfishly motivated to make profits for its executives and shareholders only. “The Market” will not spend money to protect the public from a year without electricity unless forced to, and I’m not sure how corporations can be forced to do anything now that corporate lobbyists practically run government and can easily stop such legislation. If that sounds radical, read Republic, Lost: How Money Corrupts Congress–and a Plan to Stop It by Lawrence Lessig, The Corporation: The Pathological Pursuit of Profit and Power by Joel Bakan, Corporations Are Not People: Why They Have More Rights Than You Do and What You Can Do About It by Jeffrey D. Clements, Free Lunch: How the Wealthiest Americans Enrich Themselves at Government Expense (and Stick You with the Bill) by David Cay Johnston, or When Corporations Rule the World by David C Korten.

My Summary of the report

There are many Really Stupid Energy-Electric Grid Interdependencies that will make outages from terrorism, natural disasters, and other causes much worse

Here are some other factors that I think will exacerbate the problems in the future as the system ages and there’s less oil to fix all the growing problems of society:

Natural gas power plants are fed by natural gas pipelines that use electricity to keep the natural gas flowing. So when the electricity goes out, the natural gas will stop flowing to power plants. Terrorists are also likely to take out natural gas transmission lines when they attack the electric system as well. Natural gas pipelines used to use the natural gas flowing through them to power the continued flow of natural gas.

Refineries are fed by oil pipelines that use electricity to keep the oil flowing. So when the electricity goes out, the oil will stop flowing to refineries, and there will be no fuel for ships, trucks, barges, cars, or airplanes.

Gasoline stations need electricity for the pumps. So even if a business or home has had the foresight to buy back-up generators, they won’t be able to get gas or diesel fuel because most gas stations don’t have backup power.

Coal supply chains. Coal travels an average of 848 miles by rail to power plants. Railroads heavily depend on signals, which will be out in an electric blackout. They too are vulnerable to climate change (rising sea level, heat buckled rails, etc.), failing infrastructure, and declining coal supplies. Trains deliver 70% of coal, and a lot of it: over 1 in 5 railcars are carrying coal – over 40% of the weight trains haul. In 2008, 7,710,000 carloads with 878,600,000 tons of coal were delivered by train (AAR).

Microprocessors can’t be made if the electric grid isn’t up or delivers low-quality electricity. The grid can’t function without microprocessors. Over 10% of electric demand is controlled by microprocessors,by 2020 it’ll be over 30% (EPRI, 2003). The electric power system was designed to serve analog electric loads and doesn’t always provide the quality power required by digital manufacturing assembly lines and information systems. A nearly imperceptible 1-second variation in power quality due to transients, harmonics, and voltage surges and sags at a semiconductor-fabrication plant can ruin an entire 30-hour batch of microprocessors and sometimes the manufacturing equipment, and take several days or more for a fabrication plant to recover and resume production again. Any device with a microprocessor is vulnerable to the slightest disruption of electricity. Billions, if not trillions, of microprocessors exist in electronic devices.

I believe that chip fabrication will be one of the first industries to fail, and not just from electric grid outages and/or poor quality electricity. Microprocessors have the longest supply chains, single points of failure in both nations and machinery, require silicon, water and chemicals of up to .9999999% purity, at least 60 minerals (many of them rare), $10 billion dollar clean rooms, and much more. (For details, see my articles The Fragility of Microchips, Microchips and fab plants: a Detailed description, High-tech can’t last: limited minerals and metals, and Motherboards in Computers – too complex to make in the future).

The biggest threat to the electric grid isn’t even mentioned in this report: lack of fossil fuels, uranium, and hydro-power to keep it going

We’re running out of the fossil fuels, uranium, and dams that keep 94.2% of the electric grid running: Coal 37%, Natural gas 30%, Nuclear 19%, Oil 1%, and hydropower (6.2%). We are at (or near) peak coal, peak natural gas, peak uranium, and peak oil.

Most “renewable” power comes from hydro-power, which isn’t really renewable, because dams fail when their short-lived concrete crumbles, and silt up within 50 to 200 years. Within the next 20 years, 85% of U.S. dams that cost taxpayers $2 trillion dollars will have outlived their average 50-year lifespan.

Renewables can’t keep the electric grid running either:

  1. Wind and solar are too sporadic and unpredictable, and their lifespan is only 20-30 years.
  2. According to Steven Chu, former US energy secretary, “Without technological breakthroughs in efficient, large-scale energy storage, it will be difficult to rely on intermittent renewables for much more than 20-30% of electricity.” We’re a long way from figuring out how to make low cost, high energy density, fast response, and safe storage devices.
  3. The grid must stay within an extremely narrow range of 59.98 to 60.02 Hz to prevent blackouts. This limits the use of intermittent renewables like wind and solar, because the more you add, the more unstable the electric grid gets (Halper).
  4. Adding renewables doesn’t reduce the use of fossil fuels, and can do the opposite, because additional natural gas combined cycle plants need to be built to kick in suddenly when the wind dies.

Terrorists: We are fully capable of ruining the electric grid without any help from you

The biggest threat isn’t terrorism (yet), it’s natural disasters, the aging electric power system, too much complexity, and lack of capital and energy to fix the system.

The Electric Power System is falling apart. The American Society of Civil Engineers gives our energy infrastructure a D+. The electric grid and most of our other infrastructure is old and falling apart. Both the average age and lifespan of power transformers is 40 years old, and much of the rest of the grid is at or nearing the need to be replaced, and this will lead to more and more blackouts. In the late 1990s, the restructuring and re-regulation of the U.S. transmission system led to a decrease in investment and now the grid operates at or near its physical limits, resulting in many parts of the bulk high-voltage system being heavily stressed.

Capitalism ensures most of the money needed to fix the grid will go to fat cats instead.  Because of deregulation and over 90% of America’s infrastructure being privately owned, money that ought to have been invested in maintenance and improvements has gone instead to CEO’s, top executives, and shareholders.

Natural Disasters & Climate Change. Hurricanes will be fiercer and more frequent in the future, as will tornadoes, ice storms, extreme droughts and flooding, severe thunderstorms, and the coup de grace – rising sea levels. All of these will take the grid down more often and for longer periods over wider areas.

There are many other ways the grid can come down besides terrorism. Cyber or nuclear war, an Electromagnetic pulse, natural gas shortages, coal shortages, and oil shocks.

Too Complex – Too Many Owners and operators, over 3,000 entities to coordinate, many with conflicting goals and interests. The U.S. electric power industry today is composed of a wide variety of players, entities, and institutions, all of which play different roles, and the actions of individual asset owners and operators affect each other.

Deregulation has made the system unstable. Competition in the wholesale electricity market has increased the operational complexity of the power delivery system. Electricity is being shipped much longer distances over a transmission system designed only to provide limited power and reserve sharing among nearby utilities.

Related Articles:

Cyber attack

Electric Grid

References

AAR. Association of American Railroads. August 2013. Railroads and Coal. Aar.org

EPRI (Electric Power Research Institute). 2003. Electricity Technology Roadmap: Meeting the Critical Challenges of the 21st Century: Summary and Synthesis. Palo Alto, Calif.: EPRI.

Halper, Evan. Dec 2, 2013. Power struggle: Green energy versus a grid that’s not ready. Minders of a fragile national power grid say the rush to renewable energy might actually make it harder to keep the lights on. Los Angeles Times.

LaCommare, K.H., Eto, J.H., 2004. Understanding the cost of power interruptions to U.S. electricity  consumers. Ernest Orlando Lawrence Berkeley National Laboratory, LBNL-55718, Berkeley, CA, September. http://eetd.lbl.gov/ea/EMP/EMP-pubs.html

OTA (Office of Technology Assessment). 1990. Physical Vulnerability of Electric System to Natural Disasters and Sabotage. OTA-E-453. Washington, D.C.: U.S. Government Printing Office.


NAS. 2013. The Resilience of the Electric Power Delivery System in Response to Terrorism and Natural Disasters: Summary of a Workshop. National Academy of Sciences.

Substations, especially those with high-voltage transformers, are probably the most vulnerable to terrorist attack because they are essential components of the transmission system and would take a long time to replace. • Control centers coordinate the operation of the grid to maintain reliability of the system. The loss of a control center, which is the brains of the system, can have a substantial impact on the operations of the electric grid. Much of the vulnerability of the control center is related to cybersecurity threats,

David Owens, Edison Electric Institute, noted that while much of the discussion is focused on the bulk power system, the most common challenges are at the distribution level, which can then end up affecting the bulk power system. He reiterated that substations and substation transformers are potential points of vulnerability in the system. According to John Kassakian, Massachusetts Institute of Technology (MIT), substation attacks are a problem that can cause tremendous disruption, particularly if key lines are affected as in the case of a switching station. Sarah Mahmood, DHS, noted that the manufacturing lead time for a single, large transformer can be up to 18 months plus another 2-3 months to get it installed and operational. Reducing this downtime is the motivation for DHS’s Recovery Transformer Program (RecX), which is discussed in great detail in Box 2-1. Joseph McClelland, Federal Energy Regulatory Commission (FERC), noted that additional complications can arise from the specialization of transformers such as changes in energy efficiency, which can impact interchangeability and thereby reduce the number of spare units for a particular location.


Ultimately, any of these vulnerabilities could lead to significant outages. Daniel Bienstock, Columbia University, detailed the ways in which one part of the network can have devastating impacts on the rest of the system, stressing segments that may not even be in proximity to each other.

The utilities are relatively well prepared for physical attacks on the grid infrastructure that are dispersed, uncoordinated, and limited according

According to Dr. Kassakian, much more challenging is the case of a widespread coordinated attack. For instance, in the case of the 9/11 World Trade Center attack, there was a significant communications issue, as multiple agencies had different protocols that hindered a coordinated response. Furthermore, such an attack might take place across multiple nodes in the system, which can result in the types of cascading blackouts mentioned previously. Such attacks also typically occur without warning, reducing opportunities for pre-emptive mitigation strategies. Transmission lines are vulnerable to air attack in numerous ways. He also pointed out that an attack on a switching station, which serves as an interconnect between multiple lines, might be just as disruptive as a coordinated attack. One particularly damaging and coordinated attack could utilize the threat of an electromagnetic pulse (EMP) weapon. While there are some parallels to a geomagnetic disturbance such as the one that shut off power throughout the northern reaches of the United States and Canada on March 13, 1989, an EMP device has a far more localized and targeted impact. Massoud Amin, University of Minnesota, and Dr. Kassakian both noted that an EMP weapon, which could be as small as a briefcase, could be used to attack the control systems of the grid at the same time as an attack on the physical infrastructure, thus significantly compounding the effect of the physical attack by disabling some of the inherent balancing mechanisms in the grid. A cyberattack combined with a physical attack on the infrastructure may have a similarly crippling effect,

Nature can launch its own devastating, widespread attack. While utilities may typically be prepared for an “n-1” or “n-2” event, Mr. Whitley noted that Hurricane Sandy was an “n-90” event. Long Island lost all ties to Connecticut and New Jersey, and New York City lost all ties to New Jersey (Figure 2-2). Over 8 GW of generation capacity went offline, both through loss of transmission and, more directly, through flooding, resulting in over 2 million customer outages in the immediate aftermath.


The use of a spare recovery transformer was seized upon by many in attendance as a serious option to reduce the vulnerability of the system to failed equipment. While the components of a substation are relatively easily replaced, the difficulty of and lead time necessary for replacing a transformer is a hindrance that can slow down the mitigation response. Anjan Bose, Washington State University, currently on leave and serving on the Department of Energy’s Grid Tech Team, did mention that the recent rebirth of transformer manufacturing in the United States, as described by Mr. Ball, does reduce the amount of downtime a utility might expect for replacement.

BOX 2-1 The Department of Homeland Security Recovery Transformer Program Sarah Mahmood, Department of Homeland Security, described the successful deployment of a recovery transformer outside Houston, Texas. The RecX recovery transformer program is designed to act as a rapidly deployable spare for a 365 kV:138 kV/200 MVA transformer, reducing the amount of time for transport and installation from 2 or 3 months down to about a week. The key design feature is to replace the three-phase transformer with three single-phase transformers. Each is smaller and weighs much less than a full three-phase transformer, allowing it to be delivered by truck rather than train or barge.

Because there is no longer funding for the RecX program, replacements for these larger transformers are not being developed at this time. Until those transformers are designed, the highest capacity part of the transmission system is still vulnerable to long-term outages. There was a further question about the susceptibility of these transformers to attack—while Ms. Mahmood agreed that these transformers are just as susceptible to a physical attack as those they replaced, the RecX transformer is slightly less susceptible to ground-induced currents and, therefore, EMP weapons.

In order to provide more reliable and efficient service, the electric power delivery system is incorporating an ever increasing amount of data transfer, with communications occurring over a wide array of systems. Massoud Amin, University of Minnesota, noted that the systems have become so intertwined that operators may forget where the data is coming from, citing an anecdote of a power plant operator who was receiving all of his commands over the internet. Granger Morgan, CMU, pointed out that while adding more points of intelligent control can add capacity, stability, and flexibility, it also adds more entry points for cyberattack.

While the sophistication of cyberattacks is increasing, the level of technical knowledge necessary for the attack is decreasing

the power sector is an increasing target for cyberattacks, both in the United States and abroad. Stressing the ubiquitous nature of cyberattacks, Terry Boston, PJM Interconnection, recalled a common saying: “There are two types of people: those who’ve been attacked, and those who don’t know they’ve been attacked.” With such attacks becoming commonplace, it is crucial to understand where the underlying vulnerabilities lie in the electric power delivery system.

the new world that is emerging—just as critical infrastructure has become increasingly integrated with the electric power system, so too has the grid become more reliant upon the communications network. An increasing number of sensors applied to the grid allows for both improved flexibility and increasing automation. However, Mr. McClelland noted that such an increase in automation increases the number of on-ramps for cyberattacks. And as Mr. Rasche pointed out, this increased integration with the communications infrastructure can leave the grid vulnerable, as layer upon layer of connectedness results in an increasing amount of trust placed in suppliers. The legacy systems common in transmission and distribution systems often communicate via insecure protocols,

One of the biggest challenges in securing this legacy hardware is the fact that these very protocols are created through standards organizations, and such processes are, by design, very slow to change. Therefore, more robust network, system, and security management protocols are necessary for transmission and distribution systems to identify the types of security faults common to antiquated hardware.

Modernized hardware and software do not necessarily offer increased protection, however. As Fred Hintermeister, North American Electricity Reliability Corporation (NERC), pointed out, supply chain security is critical to ensuring that a particular subsystem is secure, regardless of the system or vendor. Dr. Nielsen agreed, expanding on the necessity of knowing who wrote the software for every component of all of your partners’ systems. While this may seem a daunting task, the increasing number of attacks is pushing hard on utilities and their partners to ensure that their systems are secure at every level. NERC is working with a global network of governmental intelligence sources, vulnerability researchers, and others to develop products that specifically address emergent issues, particularly in the area of cybersecurity. A system is only as secure as its weakest link, and it is a crucial part of established NERC procedure to push mitigation measures out to the relevant bulk power system entities in a timely manner so that they may address the full chain of operations.

Risk Assessment and Cybersecurity. Given the prevalence of attacks (Figure 3-3), it is crucial to evaluate how best to maintain system integrity with minimal risk.

The regulatory process itself is not well designed for cybersecurity.

NERC can develop standards for reliability and cybersecurity and submit them to FERC, but because the process is both slow and open, it is not adequate for national security purposes—in effect, both the threat and the mitigation strategy are announced through the regulatory process.

Given the nature of the cyberthreat, there was significant discussion over the potential for catastrophic damage, particularly for causing damage to the physical infrastructure. Dr. Morgan cited recent work at Carnegie Mellon indicating a low probability that a hacker could destabilize the bulk power grid by toggling customer loads via hacked smart meters. However, Mr. McClelland cited both the Aurora test at Idaho National Laboratory and a collaborative project with Lawrence Berkeley National Laboratory to identify critical frequency vulnerabilities for customer load shedding as evidence of the sensitivity of certain aspects of the physical infrastructure to cyberattack.

Most obviously, according to Dr. Amin, wireless and public internet access should be avoided at all costs. Mr. Boston suggested building the system like a nuclear secure lab, where communication is handled as an information diode that does not “shake hands” with the computer, so that information transfer is one-way.

1 A. Narayanan, 2012, The emerging smart grid: Opportunities for increased system reliability and potential security risks, Dissertations, Paper 138, available at http://repository.cmu.edu/dissertations/138.

2 Video available at http://www.youtube.com/watch?v=fJyWngDco3g.

3 J. H. Eto, et al, 2010, Use of frequency response metrics to assess the planning and operating requirements for reliable integration of variable renewable generation, LBNL-4142E, December, available at http://certs.lbl.gov/pdf/lbnl-4142e.pdf.

Assessing the vulnerability of a system is difficult, particularly in the case of a zero-day, or previously unknown, vulnerability. How can one measure resilience to an unanticipated event?


Large blackouts can be particularly devastating and happen much more frequently than a normal distribution predicts.

the impact of a blackout exponentially increases with the duration of the blackout, and the duration of restoration decreases exponentially with the availability of initial sources of power. For several time-critical loads, quick restoration (minutes rather than hours or even days) is crucial. Blackstart generators, which can be started without any connection to the grid, are a key element in restoring service after a widespread outage. These initial sources of power include pump-storage hydropower, which can take 5-10 minutes to start, to certain types of combustion turbines, which take on the order of hours.

For a limited outage, restoration can be rapid, which will then allow sufficient time for repair to bring the system to full operability, although there may be a challenge for subsurface cables in metropolitan areas. On the other hand, in widespread outages, restoration itself may be a significant barrier, as was the case in the 1965 and 2003 Northeast blackouts. Natural disasters, however, can also lead to significant issues of repair—after Hurricanes Rita and Katrina, full repair of the electric power system took several years

This interconnectedness is one of the major reasons the electrical grid is an attractive target for terrorist attack—namely, other services have become dependent on the electric power system. David Kaufman, FEMA, recognized that impacts of overlapping interdependency could cascade because the supply chain for many industries has become globalized—for example, according to Mr. Kaufman, truck production in Louisiana was shut down by the earthquake in Japan, which halted the supply of a particular mineral needed for metallic paint. Thus, evaluating resilience in response to a power outage goes far beyond the electric power sector.

Services critical to a community are diverse, including elevators, subways, traffic signals, police stations, cell phone towers, grocery stores, ATMs, and gas stations. Joseph McClelland, FERC, pointed out that not only does the electric power system feed into these services, but in some cases it is reliant on these systems as well. For instance, with a shift in generation fuel from coal to natural gas, the energy sector is increasingly reliant on the natural gas pipeline infrastructure; with events like the Telvent compromise in 20123 and the Shamoon cyberattack in 20124 in Saudi Arabia and Qatar, resilience to terrorism and natural disaster for the electric power system involves both upstream and downstream dependencies. The natural gas system may be particularly stressed during the winter when it is being used for heating, making the system especially vulnerable to attack.

Telvent Canada is a company that provides remote administration and monitoring tools for the energy sector. In September 2012, the company discovered that its internal firewall and security system had been breached by a Chinese hacking group. Shamoon is a computer virus capable of transmitting information about the files of the infected computer as well as deleting all data from the hard drive. It was first used on August 15, 2012, by hackers from a group called the Cutting Sword of Justice in an attack on Saudi Arabia’s national oil company, Aramco. It was also suspected in a later cyberattack on a large liquefied natural gas company in Qatar, RasGas.

Much of the information necessary to make good decisions is classified and/or proprietary, but any such decision making needs to be made in the public domain.

Distributed generation, which could pose a challenge for reliability and safety as power flow becomes a two-way street.

Mr. Owens cited net metering as one particular case that does not adequately account for the fact that a customer’s renewable generation from rooftop solar, for example, is not equivalent to power generated by the grid. John Kassakian, MIT, also pointed to renewable portfolio standards as a key cost burden being placed unfairly on utilities through public policy.

1 National Research Council, 2012, Terrorism and the Electric Power Delivery System , The National Academies Press, Washington, D.C.

Miscellaneous

Annual sales in 2006 were $326 billion. Electricity outages in the U.S. cost an estimated $80 billion every year, mostly from small disturbances (LaCommare).

Table 2.1 Major Industry Players in the U.S. Electric Industry

  • Asset Owners: 1) Vertically integrated utilities (owning generation, transmission, and distribution) 2) Generation and transmission utilities 3) Transmission utilities or companies   4) Distribution utilities 5) Generation companies 6) Marketing companies
  • Institutional Structures of Asset Owners: 1) Investor-owned electric utilities (IOUs), 2) Rural electric cooperatives (RECs or Co-ops) 3) Municipal utilities (MUNIs) 4) Federal power agencies
  • Other Asset Operators and Coordinators: 1) North American Electric Reliability Council (NERC), 2) Independent system operators (ISOs)  3) Regional transmission operators (RTOs)   4) Regional reliability organizations (RROs)
  • Government Entities and Regulatory Authorities: 1) State regulatory commissions, 2) Power marketing authorities (PMAs) 3) Federal Energy Regulatory Commission (FERC) 4) U.S. Department of Energy (DOE) 5) Energy Information Administration (EIA)   6) Bonneville Power Administration (BPA)   7) Tennessee Valley Authority (TVA)   8) V Western Area Power Administration (WAPPA)
  • Industry Associations and Institutions: 1) Electric Power Research Institute (EPRI), 2) National Regulatory Research Institute (NRRI)    3) Edison Electric Institute (EEI) 4) National Rural Electric Cooperative Association (NRECA)  5) Electric Power Supply Association (EPSA)  6) National Association of Regulatory Utility Commissioners (NARUC)    7) Association of State Energy Research and Technology Transfer Institutes (ASERTTI) 8) National Association of State Utility Consumer Advocates (NASUCA)

NERC requires organizations to register as one or more of: Generator owners, Generator operators, Transmission service providers, Transmission owners, Transmission operators, Distribution providers, Load-serving entities, Purchasing-selling entities, Reliability authorities, Planning authorities, Balancing authorities, Interchange authorities, Transmission planners, Resource planners, Standards developers, and/or Compliance monitors.

Table 8.1. Examples of Critical Social Services that depend on Availability of Electric Power

Emergency Services

  • 911 and other dispatch centers
  • Police headquarters and station houses
  • Fire protection services
  • Emergency medical services
  • Hazardous materials Response Teams

Medical Services: Ambulance, Life-critical hospital care, Clinics and Pharmacies, Nursing Homes

Communications and cyber services

  • Radio broadcast media
  • Television broadcast media
  • Cable television
  • Conventional and wireless telephone and data systems
  • Wired data service
  • Computer Services

Water and sewer: Water supply & Sewer systems

Natural gas. Pipes may burst in cold weather if homes/buildings are left without heat.

Food

  • Retail groceries (cash registers, lighting, etc)
  • Wholesale grocery and distribution networks
  • Food production facilities (farms, animal facilities, processing, packaging, etc)
  • Refrigeration: Spoiled food in homes and grocery stores

Financial Cash Machines                 Credit card systems                Banks

Fuel   Bulk fuel delivery                     Local storage infrastructure    Retail gasoline sales

Non-emergency government services

  • Information service offices: Important for distributing emergency information. Risk of chaos if information not available.
  • Operations units
  • Prisons and other detention facilities: Potential risks to prisoners, guards, and public if security systems fail.
  • Schools

Transportation systems

  • Traffic lights
  • Tunnels (esp ventilation)
  • Light rail systems and subways
  • Stranded commuter trains (i.e. outage in Italy 110 trains with 30,000 passengers)
  • Conventional rail systems, including railroad crossings
  • Air traffic control, navigation, landing aids, and airport operations
  • River lock and dam operations
  • Buses
  • Drawbridge operations

Lighting: buildings, residential (risk of fires from candles), commercial and industrial, street

Building operations: elevators, space heating and cooling

Other instabilities.Some states have more stringent environmental regulations than at the federal level, and don’t allow coal generated electricity, making it harder for systems operators to meet reliability objectives. This is made even harder when communities build renewable-energy-based resources like wind for generation, since unreliable renewables are often far from customers, and not able to generate electricity when the need is greatest, increasing the complications of system design, operation, [and the need for natural gas combined cycle plants to make up for the lack of power].

Other Impacts (OTA 1990)

  • Agriculture. There can be significant hazards to livestock and produce during a blackout. Sensitive processes include incubation, milking, pumping, heating, air-conditioning, and refrigeration.
  • Residential. Consumers do not have air-conditioning, heat, hot water, lights, freezers, refrigerators, stoves and microwave ovens, toasters, home computers, elevators etc.
  • Transportation A blackout affects virtually every mode of transportation (box D). Subways, elevators, and escalators stop running, street traffic is snarled without traffic lights. Gasoline pumps do not work, taxis and buses decline over time. Parking lot gates and toll booths will not operate. Trains can function, but it can be hazardous without signal lights. Other transportation effects result from the inability to deliver goods.
  • Looting and fires. Looting and arson can severely strain police and fire-fighting and services. During the New York City blackout there were 1,037 fires (primarily arson)
  • Water supply systems often rely on gravity to move water from reservoirs through the mains and to maintain pressure throughout the system. Some power may be required at pumping stations and reservoirs. Loss of pressure in mains hampers free-fighting and may permit contaminants to seep into the water supply.
  • Electricity is needed in treatment and pumping of sewage. An outage at a treatment plant causes raw sewage to bypass the treatment process and flow into the waterways. Lack of pumping station power prevents sewage flow and ultimately causes a backup at the lowest points of input (usually basements in low-lying areas. Many sewage treatment plants and pumping stations have standby power supplies, but only for short durations. After standby power is exhausted, untreated sewage flows continuously from the treatment plant.
  • Destruction of Four or More Major Transmission Substations. The destruction of more than 3 transmission substations would cause long-term blackouts in many areas of the country. Only a few areas have a good enough geographic balance of load and generation to survive this very severe test.

Costs of blackouts: food spoilage, damage to electronic data, life-support systems inoperable in hospitals, arson and looting (in the 1977 New York City blackout, this accounted for half of the economic costs — $155 million), overtime payments to police and fire personnel, increases in insurance rates, lost productivity at commercial and industrial companies. Many industrial processes are highly sensitive to power disruptions. An interruption of less than 1 second can shut plant equipment down for several hours. Outages can spoil raw materials, work-in-progress, and finished goods. Spoilage is a significant problem in chemical processes, steel manufacture, food products, and other industries (OTA 1990)

Sabotage and Vandalism: Insulators on distribution lines are a frequent target for vandals with guns. To date, no long-term blackouts have been caused in the United States by sabotage. However, this observation is less reassuring than it sounds. Electric power system components have been targets of numerous isolated acts of sabotage in this country. Several incidents have resulted in multimillion-dollar repair bills. In several other countries, sabotage has led to extensive blackouts and considerable economic damage in addition to the cost of repair

United States before 1990: Over the past decade there were few notable acts of sabotage, and apparently none that were intended to cause harm other than to the local utility. The most common cause has been labor disputes. In July 1989, a tower on a 765-kV line owned by the Kentucky Power Co. was bombed, temporarily disabling the line. No arrests have been made. In 1987-88, power line poles and substations were bombed or shot in the Wyoming-Montana border area. Later in 1988, similar attacks were experienced in West Virginia. Such attacks had also occurred in 1985 in West Virginia and Kentucky. All these attacks occurred during coal mine strikes. Two Florida substations were heavily damaged by simultaneous dynamite explosions in 1981 in one of the most expensive incidents. Damages totaled about $3 million, but no significant customer outages resulted. No arrests have been made, but circumstantial evidence points to a contractor labor dispute. Incidents stemming from unknown motives include the cutting of guy wires and subsequent toppling of a tower on the 1,800-MW, 1,000-kV DC intertie in California in 1987. There was negligible impact on the power system, because the load on the line was light at the time and it was scheduled for maintenance the next day, so alternate power routes had already been arranged.

Another incident demonstrates that saboteurs can mount a coordinated operation. In 1986, three 500-kV lines from the Palo Verde Nuclear Generating Station were grounded simultaneously over a 30-mile stretch. It happened at a time when none of the nuclear reactors was operating, so no disruption occurred. Under different conditions, the reactors would have shut down. No arrests have been made.

El Salvador: Attacks on electric power systems have been most severe in El Salvador. The Farabundo Marti National Liberation Front (FMLN) has repeatedly bombed or fired on transmission towers, substations and hydroelectric power plants. Up to 90 percent of the entire Nation has been blacked out by the FMLN during some sabotage campaigns. The FMLN has even produced a manual detailing how to attack an electric power system. According to official sources, the FMLN has launched over 2,000 attacks on electric systems since 1980. The Sendero Luminosa (Shining Path) revolutionary group has adopted a similar strategy in Peru, frequently leaving Lima, as well as a 600-mile stretch of the country, blacked out or under power rationing for 40 to 50 days (OTA, 1990).

Industries most dependent on electricity (in New Jersey): aluminum, wet corn milling, cement, pipelines (oil, natural gas, water), electrometallurgical products, petroleum refining, platemaking, soybean oil mills, carbon black, smelting and refining of copper, industrial organic and inorganic chemicals, plastics and resins (Greenberg, Met al. 2007. “Short and Intermediate Economic Impacts of a Terrorist Initiated Loss of Electric Power: Case Study of New Jersey.” Energy Policy 35(1):722–733.


Posted in Electric Grid & EMP Electromagnetic Pulse, Electricity Infrastructure, Infrastructure & Fast Crash, Oil & Gas, Water Infrastructure | 1 Comment

Sandra Postel: Wildfires in the Western U.S. Threaten Drinking Water

Sandra Postel. May 1, 2014. Wildfires in the Western U.S. Are on the Rise, Posing Threats to Drinking Water

When the Las Conchas Fire scorched some 151,000 acres of northern New Mexico in 2011, it wasn’t just the direct fire damage that was cause for worry.
Striking as it did in the midst of a persistent drought, but just before summer “monsoon” rains, the Las Conchas – the largest blaze in New Mexico’s recorded history – set in motion the one-two-three punch of drought, fire and flood that much of the western United States has seen all-too frequently in recent years.
As the intense rains pounded burned-out watersheds, peak floods poured through the Jemez Mountain canyons pushing tree trunks, boulders and tons of blackened soil down to the valleys below.   Soon after, to avoid the high costs of de-clogging equipment and treating sediment-laden river water, the Albuquerque drinking water utility cut its intake from the Rio Grande by half – and tapped more groundwater to make up the deficit.
With new research showing that fires in the western United States are getting larger and more frequent, water managers need to mitigate the impacts of fire in their source watersheds, as well as prepare for the consequences.
In a study published online in the journal Geophysical Research Letters, Philip E. Dennison of the University of Utah and colleagues analyzed a database of large wildfires (those greater than 1,000 acres, or 405 hectares) in the western United States over the period 1984-2011 and found a significant increase in the number of large fires and/or the area covered by such fires.
Specifically, in the region stretching from Nebraska to California, the number of large wildfires increased by a rate of seven per year over the 28 years of study, and the total area burned by these fires increased at a rate of nearly 90,000 acres a year – an area the size of Las Vegas.
“We looked at the probability that increases of this magnitude could be random, and in each case it was less than one percent,” Dennison said.
For their analysis, Dennison and his team used satellite data from the Monitoring Trends in Burn Severity Project, which is supported by the US Forest Service and the US Geological Survey.
The team also found a correlation between increased fire activity and increased drought severity.
Those regions expected to be most affected by climate changes, especially more intense droughts, showed the greatest increase in fire activity, including the Rocky Mountains, the Arizona-New Mexico mountains, the southwestern desert region, and western Texas.

A satellite image of the 2011 Las Conchas Fire in New Mexico

For water managers, the new research is a clarion call to begin action now to safeguard water supplies originating in watersheds prone to fire. 
Fires are natural and beneficial to forested watersheds.  But for many decades, firefighters focused on protecting people and property have squelched even small fires that would do the important work of cleansing the forest floor and thinning trees to healthy densities.
As a result, many forests have accumulated an excess of  “fuel,” so when a fire ignites– whether from a natural cause, such as a lightening strike or a human one, such as a campfire – the forest is primed to burn rapidly, increasing the potential for a mega-fire like Las Conchas.  Drought only adds to the favorable fire conditions.
Partly in response to the damage wildfires have inflicted downstream, a few pioneering water suppliers are taking a proactive approach to addressing wildfires’ costs and risks to drinking water sources.
After the 2002 Hayman Fire, Denver Water faced a reservoir cleanup and infrastructure repair bill upwards of $30 million. Rather than pay such a steep price over and over again, Denver Water is investing $16.5 million to match the Forest Service’s investment in thinning ponderosa pine stands, cutting trees killed by pine beetle infestations, and generally rehabilitating the watershed critical to Denver’s water supply.
Likewise, Santa Fe, New Mexico, has embarked on watershed protection measures to safeguard against wildfires in the Santa Fe National Forest (SFNF).  In partnership with the Nature Conservancy and the US Forest Service, Santa Fe has established a water fund to help pay for restoration efforts in the 17,520 acres of the forested watershed that supplies about 40 percent of the city’s drinking water. (Some 88% of that forestland is in the SFNF, and half of that is located in the Pecos Wilderness, where forest thinning is not allowed.)
Such partnerships between municipalities and the Forest Service would seem to offer great potential to mitigate the risks of fire to downstream water supplies while simultaneously reducing the costs of both fire-fighting and water treatment.
Collectively, the national forests are part of more than 3,000 municipal watersheds that supply 60 million Americans with drinking water.
The Nature Conservancy, building on its watershed protection work in Latin American, has also been instrumental in forming the Rio Grande Water Fund in New Mexico.  The fund aims to generate sustainable financing for a 10-30 year program of large-scale watershed restoration to avoid more impacts like those caused by the Las Conchas Fire.
Recognizing that adequate supplies of clean water are critical to the health of the local economy, a number of businesses – including Lowe’s, PNM (the state’s largest electricity provider) and Wells Fargo – are contributing to the water fund.
With wildfire activity increasing across the western United States, more partnerships like these to proactively improve watershed health are a crucial line of defense to safeguard our drinking water.

Originally published at National Geographic Newswatch.

Posted in Wildfire | Comments Off on Sandra Postel: Wildfires in the Western U.S. Threaten Drinking Water

Richard Duncan : Olduvai Gorge – Civilization ends when Electric Grids Permanently Fail

The Olduvai Theory – Heading into the Gorge

By Richard C. Duncan, Ph.D. Volume 23, Number 2 (Winter 2013)

Summary: The Olduvai Theory is defined as the ratio of world energy production and population. It states that average energy production per capita will decline to its 1930 level by 2030. Collapse will be strongly correlated with an “epidemic” of blackouts around the globe. This warning has come from scientists for more than a century, but it is still disallowed in Washington, D.C. A back-to-the-land movement has emerged and is accelerating.1

In a previous paper for The Social Contract, I focused on the Olduvai Theory.

[See the articles:
The Olduvai Theory
The Olduvai Theory: Terminal Decline Imminent
The Olduvai Theory – Toward Re-Equalizing the World Standard of Living
America: A Frog in the Kettle Slowly Coming to a Boil.]

This raises the following question: Where will the Olduvai die-off occur? Answer: Everywhere.

Large cities will be the most dangerous places to reside when the electric grids permanently fail. Therein millions of people are packed in high-rise buildings, surrounded by acres and acres of blacktop and concrete: no electricity, no work, and no food.

The Olduvai Theory is defined by the ratio of world energy production and population ( e).… It states that energy production per capita will fall to its 1930 value by 2030, thus giving industrial civilization a lifetime of less than or equal to 100 years. The theory projects that the collapse will be strongly correlated with an epidemic of blackouts worldwide.

Urban areas will rapidly depopulate when the power grids die. In fact the danger zones are already mapped out. Specifically: The big cities stand out as brightly lighted areas on NASA’s satellite mosaic, The Earth at Night. These planetary lights blare out “beware,” “warning,” “danger.” The likes of Baltimore-to-Boston, London and Paris, Brussels-to-Berlin, Bombay and Hong Kong and Osaka-to-Tokyo are all unsustainable hot spots.2

Let there be light

All primary sources of energy are essential to modern civilization. The Olduvai Theory however focuses on a secondary source, namely electric power. And visible proof of its global importance is confirmed by NASA’s composite display of Earthlights at Night.2

tsc_23_2_duncan_1.gif

Figure 1. Earthlights at Night: Chicago, New York, etc.The above image shows the lights of Chicago near the upper left corner and those of New York City near the upper right, plus many cities to the south, including Baltimore and Washington, D.C.3

The solar basis

Electromagnetic energy was, is, and always will be fundamental to all life on this or any other planet. Many millions of years ago the incoming solar rays “nourished” microorganisms (protists) whose bodies ultimately morphed into the fossil fuels: coal, petroleum and natural gas. Then about 150 years ago we learned how to turn fossil fuels back into electromagnetic energy. Enter a boy named Tom.

Thomas Alva Edison (1847-1931, USA)

In 1882 Thomas Edison’s Pearl Street Station in New York was the forerunner of global electrification. (3) An artist’s rendition of Edison’s station appears on the Web.4

… Thomas Edison was more responsible than any one else for creating the modern world… No one did more to shape the physical/cultural makeup of present day civilization… Accordingly, he was the most influential figure of the millennium.

The benefits of electric power were immediately obvious:

Electricity was good for more than just light and transit. Cheap, plentiful electricity would attract industries, jobs and prosperity. City Light isn’t just a utility; it’s a “city builder.”5

Henry Adams (1838-1918, USA)

Henry Adams was Chairman of the Department of History at Harvard University for six years and a celebrated resident of Washington, D.C. His lifelong goal was to discover a succinct law of history. It was at the Chicago World’s Fair in 1893 — the campus blazing with electric light — where he hypothesized, “Incandescent lighting and electric power will soon destroy industrial civilization.”

The new American — the child of incalculable coal power, electric power, and radiating energy, as well as of new forces yet undetermined — must be a sort of god compared with any former creation of nature.… The new forces would educate…. The law of acceleration was definite…. No scheme could be suggested to the new American, and no fault needed to be found, or complaint made; but the next great influx of new forces seemed near at hand, and its style of education promised to be violently coercive.… Forces totally new would accelerate society into chaos and ruin.6

Fred Hoyle (1915-2001, UK)Sir Fred Hoyle in 1963 gave a series of lectures wherein he stated:

It has often been said that, if the human species fails to make a go of it here on the Earth, some other species will take over the running. In the sense of developing intelligence this is not correct. We have, or soon will have, exhausted the necessary physical prerequisites so far as the planet is concerned. With coal gone, oil gone, high-grade metallic ores gone, no species however competent can make the long climb from primitive conditions to high-level technology. This is a one-shot affair. If we fail, this planetary system fails so far as intelligence is concerned.… (p. 64)

If the world population is not stabilized… nothing but pain and grief will follow. The future will then indeed be based on our cries of agony. (p. 69)

Roberto Vacca (Italy)

Roberto Vacca is a member of the Club of Rome. His book, The Coming Dark Age, theorizes that industrial nations are increasingly at risk because of their dependence on complex and sensitive systems such as the electric power grids.

Such critical situations as I have described [e.g., blackouts] develop gradually, and are contributory prerequisites of graver crises that will come more precipitately. These are our real interest and concern, for they will be an integral part of that ultimate avalanche of a breakdown, which will initiate a new dark age. (p. 65)

And yet the probability that a crisis is on the way is strong and growing stronger in all great cities where people are densely congregated. … (p. 132)

Urban crisis will not be exclusive to New York; that particular megalopolis serves as our example of what will occur in every great metropolitan city. On the other hand, the vivid events here foreshadowed would not produce The Dark Age overnight; they would be, rather, the germinal beginning, disintegrating agent — of a profound breakdown of society and of civilization itself, as we know it.… (p. 137)7

Jay W. Forrester (USA)

Dr. Jay Forrester in 1971, at the request of The Club of Rome, built a world model “to understand the options available to mankind as societies enter the transition from growth to equilibrium.”

What happens when growth approaches fixed limits and is forced to give way to some form of equilibrium? We need have no fear that population will continue to rise forever.… If man does not take conscious action to limit population and capital investment, the forces inherent in the natural and social system will rise high enough to limit growth.… (p. 68)

Our greatest challenge now [i.e., in 1971] is how to handle the transition from growth into equilibrium. … The folklore and the success stories praise growth and expansion. But that is not the path to the future.… (p. 112)

Dr. Forrester didn’t include the possibility of urban blackouts in the standard run of his model. Nonetheless, even without blackouts, the world population peaked in year 2023 and then declined by 28 percent in 2100. (Fig. 4-1, p. 70). In contrast, with blackouts the world population would likely decline by considerably more than 28 percent in 2100.

Picture the Olduvai Theory

I graphed the Olduvai Theory in 2001 by a steep upside curve, followed by a bumpy “plateau,” then a brief “slide,” and finally a steep “cliff,” reproduced in Figure 3.

tsc_23_2_duncan_3.gif

The curve from 1920 to 1999 is historic data, so that still stands. But the forecast from 2001 to 2011 is wrong because the value of energy per capita rose to 12.83 in 2011. However the Olduvai cliff remains at year 2012 as overpopulation, global warming, national bankruptcies, blackouts, etc. strike wide and deep.8Dennis Meadows (USA)

Dr. Meadows in 1972 was one of the authors of The Limits to Growth. Therein he stated that there is still time for “the transition from growth to global equilibrium.” But now he sees things differently:

In so far as I can tell, people who use the term [sustainability] mean, essentially, that this would be a phase of development where they get to keep what they have but all the poor people can catch up. Or, they get to keep doing what they’ve been doing, but through the magic of technology they are going to cause less damage to the environment and use fewer resources. Either way you use the term, it is just a fantasy.

It has probably been only in the last four or five years that it has become really clear to me that we just haven’t got a chance of dealing with these issues in any kind of orderly way. … Limits to Growth is absolutely focusing on a bubble, a bubble in population and in material and energy consumption. …

Theoretically, resilience is the capacity of a system to absorb shocks and to continue functioning. … I am talking about coping with the permanent loss of cheap energy or the permanent change in our climate and what we can do at the individual, the household, the community, and the national level to ensure that … we will be able to pass through that period still taking care of our basic needs.

Walter Youngquist (USA)

Dr. Youngquist is a geologist who has worked abroad and traveled in more than 70 countries where he studied the vital relationship of Earth resources to nations and populations. In January 2012, he noted:

I think your view of the future of electricity is very prescient — in that the scale of things is beyond what can be coped with — and blackouts are increasingly the mode in the United States, but already evident elsewhere.

The use of electricity defines civilization, as we know it today almost as much as is the use of oil.

Things continue to come apart everywhere —famine in Africa because of too many people for a beaten-up environment to support, government debt rising in Europe and here as all the industrialized countries are living beyond their means. Frugality will arrive whether people like it or not. I see one statement saying that the U.S. standard of living has been in decline for several years. It can only get worse. Also we are making (and importing) people faster than we are making jobs. … The unemployment rate will never get back to the previous 5 percent. So what does government do to handle the unemployed? Spend more money it doesn’t have to support a standard of living that cannot be supported. Social upheavals are ahead for sure.

We just don’t have the resources on this finite Earth to sustain people in the lifestyles they have now — much less for those who would like to achieve that lifestyle.

Chaos is ahead as populations face a future of LESS.

And in May he continued:

Over history austerity has been the NORM. Recent prosperity for a few of us cannot last.

The world in general faces more austere times — a future of less!!! When the Greeks had to face it they rioted — to no avail. Many such social upheavals are to come as more and more people divide up declining and degrading resources. Roots of troubles are ahead as population rockets up to 10 billion—I cannot visualize that world!

Colin J. Campbell (Ireland)

Dr. Campbell is a petroleum geologist and in February he spoke on the past and the future.

We have now passed the first decade of the Twenty-First Century and may again face radical changes. The success of the last Century has severely depleted the resources of the Planet, especially its critical energy supplies, suggesting that the Industrial Age has passed its peak to face contraction…

Looking ahead, it is evident that we enter the Second Half of the Oil Age, when this critical energy supply that fuels the modern world, including its military engagements, declines from natural depletion. Today, some 60 billion barrels of petroleum a year…support a population of 7 billion people, but by 2050 the supply will be sufficient to support no more than about half that number in their present way of life. It speaks of a radical change, with the transition likely to be accompanied by much tension, signs of which have already been seen.

We may see a return to regionalism with the development of local markets, even local currencies, and a new community spirit, as the imperial constructions of the past pass into history. As always, there will be winners and losers, with the winners being those who adapt better to the changing circumstances. The Transition Town Movement had its origins in Kinsale, Ireland but has now spread around the world setting an example of the new strategies to be followed.

Transition towns and doomsday preppers

The World is in terrible shape—including the U.S. The Olduvai Gorge looms.

We are living beyond our means and the Earth’s natural resource credit card is maxxed out. Now what?

More and more people are quickly realizing that the Earth’s resources that we depend upon, such as arable land, potable water, nonrenewable resources, are rapidly decreasing while the human population is rapidly increasing. This predicament has fostered the Transition Movement, the Preppers Network, and others to prepare.

(a) The Transition Movement is bringing together people that now live in nations, provinces, cities, and towns that are readying for whatever the future holds.

The Transition Town [comprises] vibrant, grassroots community initiatives that seek to build community resilience in the face of such challenges as peak oil, climate change and the economic crisis. The Transition Movement differentiates itself from other sustainability and environmental groups by seeking to mitigate these converging crises by engaging their communities in homegrown, citizen-led education, action, and multi-stakeholder planning to increase local self-reliance and resilience.…

  • If we wait for governments, it’ll be too little, too late.
  • If we act as individuals, it’ll be too little.
  • But if we act as communities, it might just be enough, just in time.…

(b) The American Preppers Network is part of a fast-growing international movement organized by nations and regions.

It has formed alliances with independent affiliates such as Pioneer Living Survival Magazine, a homesteading and survival skills website which provides a range of advice for those who want to store extra food in case of a power cut, to those who want to embrace the “off-the-grid” lifestyle of America’s western pioneers….

Today you’re seeing average people taking smart moves and moving in intelligent directions to prepare for the worst. … Growing your own, self sustaining, doing as much as you can to make it as best as you can on your own… And it also means becoming more and more tightly committed to your neighbors, your neighborhood, working together and understanding that we’re all in this together….

The Golden Horde describes the anticipated large mixed horde of refugees and looters that will pour out of the metropolitan regions when a catastrophe strikes. Thus the following dilemma arises.

The Transition Dilemma (TD) states: The more successful a Transition Town, the more danger its inhabitants face from the robbing and looting by the starving people fleeing the urban chaos. Thus to protect itself each Transition Town must have (a) a large part-time police force, (b) communications within each town and between the towns, and (c) guns and ammunition for a long siege.9

Blackouts are increasing because electric power systems are aging and expensive to upgrade and maintain. And if one-city blackouts occur for an extended period of time, this will cause chaos within that city. However, as the news spreads it is likely to cause more blackouts and turmoil in other cities.10

Summary and conclusions

In 1882 Thomas Edison brought electricity and affordable lighting to the world. In 1893 historian Henry Adams theorized that electric power would drive industrial civilization into overshoot and collapse. In 1949 M. King Hubbert published an agrarian-to-industrial-to-agrarian ( A-I-A) scenario. In 1963 Fred Hoyle forewarned that overpopulation would cause “our cries of agony.” In 1971 Roberto Vacca foresaw “a new dark age” and used New York City as his example. In 1971 the standard run of Jay Forrester’s world model showed that growth “is not the path to the future.”

In 2012 three eminent scientists — Dennis Meadows, Walter Youngquist, and Colin Campbell — basically agree: “Chaos looms as the growing population faces a future of less.”

The Transition Movement and the Preppers Network recognize the need to balance the world’s population and the earth’s natural resources.

The transition dilemma ( TD) states that a successful transition town would also be a magnet for desperate and dangerous people. This problem could be solved in each town by a reliable communication network and a strong defense unit.

Several industrial nations are already over the cliff. Ultimately the world’s population will peak and decline.

Endnotes

1. Google has built a colorful [collection of images] about the Olduvai Theory; just google: “images for olduvai theory illustrated guide.” Then click the pictures, graphs, and cartoons to see how they explain the theory.

2. Could it be that the blackout in the Eastern U.S. in 2012 is a preview of things to come?

3. Envision the chaos that would erupt and rapidly spread if one of the world’s largest cities blacked out permanently.

4. Minute amounts of electricity were used in the early nineteenth century for power, e.g., telegraphy and carbon-arc lamps. However, Thomas Edison was the first to make the generation and distribution of electric power commercially viable.

5. If the coming of electricity is a “city builder,” then the going of electricity will be a city destroyer.

6. Henry Adams’ visit to the Chicago World’s Fair in 1893 resulted in the most remarkable forecast I’ve ever seen.

7. Is it a mere coincidence that Roberto Vacca in 1971 chose New York City as an example of ”the germinal beginning…of a profound breakdown of society and civilization itself”?

8. The duration of industrial civilization in the Olduvai Theory is about 100 years (Figure 3) versus M. King Hubbert’s A-I-A scenario of about 3,500 years (Figure 2).

9. A hand-powered telephone system is essential in each transition town to protect it from desperate outsiders.

10. The loss of electric power in an urban area causes many more problems than just the blackout itself. For example, it also causes the lack of food, potable water and fuel and stops sewage transport.


References

Duncan, R. C., 2001, World Energy Production, Population Growth, and the Road to the Olduvai Gorge, Population and Environment, v.2; n5, May.

NASA’s composite of earthlights appears on a Google Map. Study the globe and print it out, as desired.

Edison, T. A.

Edison’s Pearl Street Station, 1882;

Biography of Thomas Edison, The Heroes of the Age: Electricity and Man;

Ross. J. D., Superintendent of Seattle City Light, 1911;

The Devil in the White City, The Chicago World’s Fair in 1893;

Nye, D. E., 1990, Electrifying America: Social Meanings of a New Technology, Massachusetts Institute of Technology, 479 pp.

Adams, H., 1907/1918, The Education of Henry Adams, Houghton Mifflin Co.;  Chapters 33 and 34.

Hubbert, M. K., 1949, Energy from Fossil Fuels, Science, v. 109, Fig. 8;

Hoyle, F., 1964, Of Men and Galaxies, Prometheus Books, Great Minds Series, 73 pp.

Vacca, R., 1971/1973, The Coming Dark Age, Doubleday & Company, Garden City, NY, 221 pp.

Forrester, J. W., 1971/1973, World Dynamics, Wright-Allen, 144 pp.

Meadows, D., 2012: Is It Too Late for Sustainable Development? Reported by Megan Gambino, The Smithsonian, April.

Youngquist, W., Letter to R.C.D., 1/23/12.

Youngquist, W., Letter to R.C.D., 5/3/12.

Campbell, C. J., 2012; www.localcampus.com Select: West Cork Previous Issues; Issue 16 – February; Scroll down to page 3, “Mapping The Past & Past & The Future.”

Youngquist, W., Letter to R.C.D., 4/12/12.

Transition USA.

APM.

More on Preppers.

See “G” at Golden Horde.

Richard Duncan is chief author of the Olduvai Theory, a prediction of rapidly declining world energy production. He has an M.S. in Electrical Engineering (1969) and a Ph.D. in Systems Engineering (1973) from the University of Washington. In 1992 he founded the Institute on Energy and Man.

Posted in Where to Be or Not to Be | Comments Off on Richard Duncan : Olduvai Gorge – Civilization ends when Electric Grids Permanently Fail

Earth’s Magnetic Flips May Have Triggered Mass Extinctions

Earth’s Magnetic Flips May Have Triggered Mass Extinctions

At several times in Earth’s history, mass extinctions have come close to wiping life out altogether. The reasons for these catastrophes are still unclear – they’ve been blamed on everything from asteroid impacts to cosmic ray blasts. But a new study has found that our planet itself could have a surprising hand in these disasters.

Research recently published in Earth and Planetary Science Letters suggests that reversals of the Earth’s magnetic field may have sparked mass extinctions in the past by stripping oxygen from the atmosphere.

Field Flips

607968main_geomagnetic-field-orig_fullThe Earth’s natural magnetic field, generated in the liquid outer core, spontaneously changes direction every 500,000 years or so. Known as geomagnetic reversals, these processes cause the field’s north and south poles to swap places.

Normally, the Earth’s magnetic field acts like a shield around the atmosphere, protecting it from the damaging effects of the solar wind (the supersonic stream of charged particles emitted by the sun​). During a geomagnetic reversal, however, the field weakens dramatically, exposing the atmosphere to the full force of the solar wind – and causing oxygen ions to be stripped off into space.

This much was already known. But in the recent study, a team led by Yong Wei of the Chinese Academy of Sciences set out to discover if the oxygen lost during geomagnetic reversals could bring about mass extinctions.

It had long been known that mass extinctions are often accompanied by both an increase in the rate of geomagnetic reversals and a decrease in atmospheric oxygen levels (one of the potential drivers of mass extinctions). The researchers’ goal was to determine if geomagnetic reversals could actually have caused such oxygen loss – and therefore potentially have caused mass extinctions, too.

Oxygen Depletion

Wei and colleagues focused on the “Triassic-Jurassic” mass extinction of 200m years ago, in which up to 84% of all species on Earth perished. Independent studies had already shown that, during this extinction, the geomagnetic reversal rate doubled, and the amount of atmospheric oxygen simultaneously dropped by 9 percent. This oxygen drop is one of the possible reasons for the extinction.

Using a computer model, Wei and his team concluded that geomagetic reversals stripped at least 218 trillion tons of oxygen from the Earth’s atmosphere during the Triassic-Jurassic extinction – or 4.5 percent of the total amount. This indicates that at least half of the 9 percent oxygen drop that occurred during the extinction could have been caused by geomagnetic reversals alone – more than enough, the study’s authors say, to have played a major role in the die-off.

This theory may explain even deadlier mass extinctions. Study coauthor Markus Fraenz of the Max Planck Institute for Solar System Research said that the oxygen loss caused by geomagnetic reversals could also have caused the end-Permian mass extinction (also known as the “Great Dying”), in which up to 97% of all species were wiped out.

Perhaps then, alongside the meteoric collisions, supernovae explosions and volcanic eruptions – which have variously been proposed to explain mass extinctions – it’s time to add another suspect. The invisible fluctuations of a physical field might not be as cinematic, but their consequences throughout history may have been just as dire.

Posted in Extinction | Comments Off on Earth’s Magnetic Flips May Have Triggered Mass Extinctions

Biggest Waste of Wealth in All of history: America’s Interstate Highway system

A book review by Alice Friedemann of:

Swift, Earl. 2012. The Big Roads: The Untold Story of the Engineers, Visionaries, and Trailblazers Who Created the American Superhighways.

Related articles

Much of what’s below are Swift’s exact or paraphrased words, my comments are italicized. The vast majority of the book is spent on who, what, why, when and where the interstate system was built, but I’ve mainly extracted the bits about energy and material resources, critiques of what the system did to our society, and life before cars. 

Introduction

At 47,000 miles long and four plus lanes wide, the Dwight D. Eisenhower System of Interstate and Defense Highways is the largest public works project in history, dwarfing Egypt’s pyramids, the Panama Canal, and China’s Great Wall.  To build it, forests were felled and mountains were leveled and overlaid with over three hundred million cubic yards of concrete.

Roads are essential and define the physical United States, and so taken for granted they’re almost invisible.

The interstates are just 1% of the nation’s road mileage but carry a trillion of the 4 trillion miles Americans travel each year. Many of the vehicles are heavy trucks, which hammer bridges and pavements, shortening road and bridge lifespans so much that to fix them, we’d need to spend  $225 billion a year for the next 50 years, and if we don’t, replacement will cost three times as much. One in four of the country’s nearly 600,000 bridges is structurally deficient or obsolete. Most were designed to last 50 years. In 2008, they averaged 43 years old (p 319).

Peak Oil Makes Roads and Vehicles Obsolete – Why Fix them?

Swift says that these roads represent “a spectacular investment in a mode of transport that will wither without new fuel sources” (page 6).

We don’t have new fuel sources and never will, so why repair the roads? That would only throw good money after bad. To avoid the hardest possible landing, we might want to keep a few key local and regional roads repaired, and let the thousands of miles of interstate between regions go.  Replace cars with buses, which are flexible, scalable, easily re-routable, and cheap compared to passenger trains since they can use existing roads.

What we have lost  

When horses were the main mode of transportation, American towns were compact, tightly settled, and roughly circular in layout. In the days of the horse and buggy the road served as company. As a cart joggled by, the farmer in the field or the housewife on her porch could hail it; the horse would stop almost of his own accord, and a chat would follow. But once the country road becomes a highway, filled with fast traffic with cars driven mostly by strangers, not neighbors, the whole situation is changed: the road ceases to be a symbol of sociability; it becomes very largely a curse.

As John Steinbeck observed in 1962’s Travels with Charley: In Search of America: “When we get these thruways across the whole country, as we will and must, it will be possible to drive from New York to California without seeing a single thing.”

A pilgrim of centuries past would have had much to report about the country he’d traversed—the details of flora and fauna, the land’s shape and character, the sounds and smells of village and field. He would have noticed the moss on tree bark, the fast-moving stream, the lacework of afternoon light on the forest floor. He might have startled deer and bear, unalerted by his soft approach, or reveled in bird song. A later traveler, riding horseback, might have spoken of the views he’d enjoyed, but they would have been limited views, next to the walker’s. He would have moved at a faster clip, and thus missed the tiny details of his surroundings that only a leisurely pace revealed. Further on, a stagecoach passenger had an even tighter range of experience; he beheld landscape not only from a road’s fixed path, but as a moving picture framed by his window, and his description of a long trip would likely dwell less on the scenery than on the discomforts of the stage, the bumps in the road, the passage itself. Trains erected a pane of glass between traveler and country, and further insulated him by boosting his speed. But with the modern car on the modern freeway, the modern traveler was left with practically nothing to celebrate but the ever-briefer time he had to devote to getting from one place to another. He was sequestered not only from his setting, but from fellow passengers, insulated from sound, smells, and climate. The details of all that surrounded him were blurred by speed, too distant to make out, or too distracting to enjoy. Scenery was held at arm’s length, beyond the well-manicured right of way.

Highways & Roads Ruined our Nation

The messy sprawl of U.S. cities

Destruction of neighborhoods. Clearing a path for the interstates required the taking of more than 750,000 properties.

Boring and predictable chains of fast-food, motels, outlet malls, drive-in banks

Gutting of tens of thousands of small-town shopping districts.  Kunstler describes downtown wastelands in his book The City in Mind: “I remember a spring afternoon I spent as the sole pedestrian in downtown Appleton, Wisconsin, its commercial activity had all been shifted to an asteroid belt of highway strips and architectural garbage five miles outside town.  He describes Atlanta as “a giant hairball of suburbs or ”edge cities,” connected by highways  that has become such a mess nothing can be done to redeem it as a human habitat.”

Shopping Malls. Cookie-cutter malls replaced downtown shopping districts, destroying civic life in exchange for ugly warehouses and vast parking lots. There are no public squares in malls, no public citizenship, just private and lonely consumption of goods from just a few very large corporations that channel wealth to the top one percent of society.

Death

  • In 1929, when a new automobile rolled off an assembly line every six seconds, a life was lost to one of the machines every sixteen minutes.
  • In “The American Way of Death,” Mumford wrote that Americans “are prepared to sacrifice some 59,000 lives every year, and to maim, often irreparably, some three million more.”

The enormous waste of resources for just a few decades of petroleum

  • Cars gobbled vast stores of steel, lead, zinc, rubber, corn, and beeswax; every year the auto industry consumed the wool of seventeen million sheep and the hides of a half-million cattle
  • In 1962 $1 billion was spent on: 16,000,000 barrels of cement, over 500,000 tons of steel, 18,000,000 pounds of explosives, 123,000,000 gallons of petroleum products, enough earth to bury New Jersy knee-deep, and 76,000,000 tons of aggregate– the United States could not mine enough rock to rebuild the interstates today.
  • America spent $130 billion on the interstate highway system. $22 billion of that was fixing Boston’s “Big Dig” array of tunnels and bridges. There are 55,000 bridges, many of them miles long. Maintaining 47,000 miles of highways will cost billions more.
  • Traffic jams cost New Yorkers more than $1 billion a year in fuel, engine wear, lost productivity, missed sales; a quarter of all the gasoline consumed in American cities was burned, it was said, while motorists sat in traffic.

Environmental destruction

  • By 1966 American highways occupied an area the size of West Virginia.
  • Each mile of interstate devoured 30 to 40 acres of farmland; in Iowa alone 710 miles of freeway devoured 26,000 acres of productive cropland–over 40 square miles.
  • Big roads played hell with drainage patterns and water quality. All that concrete encouraged flooding, and salts and oils carried in runoff poisoned nearby ponds and streams and fostered the growth of invasive weeds.
  • Rural interstates presented insurmountable barriers to small mammals, turtles, and amphibians, one study concluding that a 4-lane divided highway was as much a barrier to small creatures as a body of fresh water twice as wide.
  • The slaughter of game by auto approached, and would soon exceed, that by hunting.

We almost used 23 atomic bombs to speed up construction

In 1963, the Atomic Energy Commission and the California State Division of Highways started Project Carryall to determine if atomic bombs could be used to blow up the Bristol mountains near Barstow California, so the I-40 highway and railroad could be built faster and cheaper. The study group of engineers and scientists thought 22 carefully placed atomic bombs would do the trick in a flash with a 36% discount over years of going about it the old way. This would be 60 times as powerful as the Hiroshima and Nagasaki bombs combined. Each bomb packed 20 to 200 kilotons of explosive punch and would vaporize 68 million cubic yards of mountain, creating a chain of connected craters more than two miles long, as much as 340 feet deep, and 330 feet wide at the bottom—plenty big enough for twin railroad tracks and a full-size interstate. A 23rd bomb would blast a reservoir into the desert to collect runoff during storms.

And the engineers promised that there was no need to worry about radioactivity, fallout, air blast, or ground shock because these would be “clean” nuclear explosions. Construction crews could return just 4 days after the explosions.

Lewis Mumford Detested Highways

Mumford was an American historian, sociologist, philosopher of technology, and literary critic. Particularly noted for his study of cities and urban architecture, he had a broad career as a writer.

Cities “worked” not just when they balanced their books, or kept crime off the streets, or picked up the garbage in a timely fashion, but when they fulfilled their more important function of facilitating human interaction—which was, after all, the reason people gathered in cities in the first place. By extension, good architecture incorporated as much sociology as it did engineering or design. A building’s scale and orientation, its relationship to its neighbors, the mood it created in those who beheld it, could fuel a neighborhood’s vitality or hamper it. The width of streets, the presence of trees, the press of high-rises—all were important.

Mumford came to see expressways as wasteful, disruptive, and stupid, absorbing funds badly needed for schools, hospitals, libraries and other facilities.”

He berated highway engineers for behaving “as if motor transportation existed in a social vacuum” and “building more roads, bridges, and tunnels so that more motorcars may travel more quickly to more remote destinations in more chaotic communities, from which more roads will be built so that more motorists may escape from these newly soiled and clotted environments. Our transportation experts are only expert whittlers, and the proof of it is that their end product is not a new urban form but a scattered mass of human shavings. Instead of curing congestion, they widen chaos.”

Mumford passionately believed in the organic aspect of cities, and in their atmosphere, their personality, their feel. New superhighways pumped an ever-heavier flow of cars onto streets and avenues designed for a New York of 4-story buildings. Now “we have in effect piled from three to ten early Manhattans on top of each other. If the average height of these buildings was only twelve stories, the roadway and sidewalks flanking them should, according to the original ratio, be 200 feet wide, the entire width of the standard New York block.”

Mumford attacked the year-old interstate system in 1957, an opening salvo in what would come to be called the Freeway Revolt, making him a darling, to this day, of urban planners, anti-sprawl activists, and critics of the suburban lifestyle. He went straight for the jugular. The interstate program was bound to bring destruction, not salvation, to the nation’s cities. It had been founded “on a very insufficient study” of highways, rather than transportation—on “blunders of one-dimensional thinking”—and would benefit only the “fantastic and insolent chariots” that jammed the streets, “the second mistress that exists in every household right alongside the wife—the motor car.” Want to save the cities? Forget about roads. The solution, Mumford said, lay in restoring a human scale to urban life, in “making it possible for the pedestrian to exist.” A choice was looming, for “either the motor car will drive us all out of the cities, or the cities will have to drive out the motor car.” Americans should “apply our intelligence to the purposes of life,” he said, concluding: “That means eventually we will put the motor car in its place.”

“The wide swathes of land devoted to cloverleafs, and even more complicated multi-level interchanges, to expressways … butcher up precious urban space . They devoured not only open land, but real estate already occupied by people and homes. “Perhaps our age will be known to the future historian as the age of the bulldozer and the exterminator, and in many parts of the country the building of a highway has about the same result upon vegetation and human structures as the passage of a tornado or the blast of an atom bomb. The hell of it was, all that disruption did nothing to ease congestion. Here was a tool that “actually expands the evil it is meant to overcome, and which would continue doing so until that terminal point when all the business and industry that originally gave rise to the congestion move out of the city, to escape strangulation, leaving a waste of expressways and garages behind them.

Mumford concludes with this epitaph: “This is pyramid building with a vengeance: a tomb of concrete roads and ramps covering the dead corpse of a city”.

How did we get here? Don’t blame Detroit Fat Cats: Americans wanted cars

Americans loved everything about their cars, loved driving, loved impulsively going wherever they chose without a thought to routes or timetables. They loved lording over their surroundings while they did it; cocooned, protected from the world, even as they were free to explore it. They could ride in silence or with the radio blaring, need never surrender personal space to a sweaty, foul-smelling stranger or suffer inane chatter. They thrilled to the sensation and sound of movement, the buffet of air through an open window, a big engine’s growl and punch. They embraced the status reflected in chrome trim, the subtext each model offered as to income and station and sex appeal. Americans took to cars not only willingly, but with gusto. They did not have an automotive life foisted on them; they did not buy homes far from work, or forsake mass transit, or pave over their cities because they were manipulated into doing so by Detroit fat cats, or a government-industry conspiracy, or anyone else. No such subterfuge was necessary. The people chose their path. They wanted what they were getting.

Some Cities fought Highways

Too late, San Franciscans realized that they’d permitted a terrible blunder. In place of their waterfront—which, though partially blocked by low buildings, offered one of the most breathtaking urban vistas in the world, overlooking the shimmering bay and Alcatraz Island—they now saw an unadorned gray concrete barricade rising, at its peak, fifty-seven feet from the city’s historic Embarcadero. It cast its surroundings in all-day twilight, severed downtown from the docks that had birthed it, and ran smack across the face of a beloved landmark, the Ferry Building, a gathering spot for generations and a survivor of the 1906 earthquake. To tens of thousands of San Franciscans, the Embarcadero Freeway seemed less a highway than a vivisection. Petitions circulated. Protest groups bloomed. And the public’s outrage was shared by the city fathers: on January 27, 1959, citing “the demolition of homes, the destruction of residential areas, the forced uprooting and relocation of individuals, families and business enterprises,” the Board of Supervisors approved a resolution opposing 7 of the 10 freeways planned for the city, including the yet-unbuilt western two-thirds of I-480. This meant refusing $280 million in Federal Aid money, an unthinkable act in the eyes of most municipal officials. It was a vote heard around the country. Not only did it effectively kill the state’s ambitions for a lavish freeway grid through town, it reverberated with every American confronted by expressways he wasn’t sure he wanted.

Baltimore: Older cities around the country were beset with similar problems, and in each, as in Baltimore, that will was crumbling. A confluence of national trends was shifting the mood of the governed. Historic preservation was becoming a cause beyond the ranks of intelligentsia; Vietnam had created doubt that government knew what it was doing and had the people’s best interests at heart; the civil rights movement had encouraged them to take their grievances to the streets and courts. And perhaps most important, the environmental movement had gained footing among a widening swath of America.

Monotony

Motorists seeking relief from the monotony of the drive found that the system’s sameness wasn’t limited to its right of way, for it wasn’t but a handful of years before the mom-and-pop businesses that had moved out from Main Street were joined by national chains, and the mercantile knots at the exits soon seemed cut from a stencil.

Mom-and-pop businesses on superseded U.S. highways watched their customers vanish as the interstates continued their crawl across the continent. As Florida Trend magazine would cry in 1965, the interstate system “diverts traffic away from former arteries of travel, drains the life’s blood from established firms which are situated on the old highways and leaves them to die.”  Small-town shopping districts weren’t just losing business to the exits, but to bigger towns suddenly made closer by the new highways’ speed and convenience.

What was it about assembly-line food that drew customers by the millions? For starters, it was cheap. But more than that, it answered a growing demand for speed and simplicity. A motorist making good time on the interstate wasn’t inclined to spend time eating a sit-down meal. And the chains’ drive for efficient mass production mirrored a desire in the American public for predictable quality—for preferring the everyday but familiar to a surprise, good or bad.

By 1963, when the interstates were just making tentative inroads into most urban areas, the population of America’s suburbs surpassed that of the cities they ringed. The new houses came fast and cheap, thanks to mass-production techniques that had stamped out hundreds of Liberty ships and thousands of bombers during the war.  James W. Rouse, a Baltimore developer, described the process: “A farm is sold and begins raising houses instead of potatoes, then another farm; forests are cut; valleys are filled; streams are buried in storm sewers; kids overflow the schools; here a new school is built, there a church. Traffic grows; roads are widened; service stations and hamburger stands pockmark the highway. Relentlessly, the bits and pieces of a city are splattered across the landscape.”

In 1966, Americans owned 57% of the world’s passenger cars, drove 922 billion miles, made 92% of their intercity trips by road.

What a shame everyone was smitten with passenger railroads (and still are), when buses make much more sense

Frank Turner was the chief engineer of the interstate system. He was very keen on mass transit, as long as it was provided by bus.  He pointed out that  rail-based transit could not attract enough riders to justify the fortune it would cost to build, because it couldn’t be adapted to changing travel patterns. Cities were spread too far and wide for fixed-rail to take many people from where they were to where they wanted to go. Buses, on the other hand, were extremely flexible. Just 50 or 60 buses could move as many people as 3,000 cars, provide almost door-to-door service, and follow routes that could be adjusted as needed—and they piggybacked on roads already in place, requiring no costly new infrastructure. By boosting the number of buses on the highways, you could actually reduce the need for more highways. Like all his views, his enthusiasm for the bus was supported by research, by statistics. He could cite a 1962 study that showed that buses and subways moved people for about the same cost (3.2 cents per person per mile) but that buses were far, far cheaper to put into service. He could point to 1968 research that showed a single express lane devoted to buses could move the same number of commuters as four lanes of freeway.

Turner could not fathom why environmentalists, the press, and anti-highway activists didn’t embrace the bus, or why they were so smitten with rail-based transit. The “infinite combinations of routes and schedules required by today’s urban dwellers dictates that any transportation system must provide flexibility of route, destination and schedules. That’s why fixed-route systems which are basically spoke lines attached to a downtown hub have such a hard time financing themselves in the fare box.

His detested the Washington Metro, that initially covered 98 miles and cost about $3 billion ($4,000 per household), an amount equal to everything spent on the capital region’s roads since the beginning of  settlement there. “What a huge capital expenditure to provide for the movement of about 5% of the transportation load within Washington’s metropolitan area. Just the annual interest on the debt would buy about 5,000 new buses every year for the whole life of Metro”.

Roads started because of demands from bicyclists

In 1874, overland travel was done by train. Look at any state and you’d see tangles of thick black lines converging on the major cities. Most of the old maps don’t depict a single road. They were there, but hardly in the form we think of them. The routes out of most any town in America were “wholly unclassifiable, almost impassable, scarcely jackassable,” as folks said then—especially when spring and fall rains transformed the simple dirt tracks into a heavy muck, more glue than earth. People braved roads to the train and back, or to roll their harvest from their farms to the nearest grain elevator. For any trip beyond that, they went by rail.

Some of the first bicycles had enormous front and tiny rear wheels, with saddles perched as high as 5 feet off the ground. On steep downhills, the best a rider could do was brace his feet on the handlebars, so that if he crashed, the bike stopped cold, with calamitous results, if that big front wheel encountered an obstacle— he’d at least go flying right-side up.

At local bicycle ships and meetings of the national organization the League of American Wheelmen, there were always conversation’s about cycling’s most urgent need: roads on which to ride.  Bicycling was a jarring experience in the 1890s, even when city streets were paved with cobblestone, brick, or uneven granite block, and snarled with carts, buggies, and horsemen. Outside the business districts, roads dwindled to little more than wagon ruts. A sprinkling of rain could turn them to bogs; their mud lay deep and loose, could suck the boots off a farmer’s feet, prompting travelers to quit the established path for the open fields. Some muddy roads swallowed horses to their flanks; the unfortunate buggy that ventured down such a lane soon flailed past its axles in the ooze. Even on hard-packed roads, mud formed dark rooster tails behind surreys, spattered long skirts, caked shoes. American business was conducted in mud-soiled suits, as were law, medicine, and church services. And mixed with the mud was a liberal helping of manure, for city and country alike were dependent on the horse.

Cyclists thus found their hobby not as pleasant as it could be, and the League of American Wheelmen committed to doing something about it. Their magazine, Good Roads,  became an influential mouthpiece for road improvement. Its articles were widely reprinted, which attracted members who didn’t even own bikes; eventually there were 102,000 subscribers, and the Good Roads Movement was too big for politicians to ignore. The demand for roads was pedal-powered, and a national cause even before the first practical American car rolled out of a Chicopee, Massachusetts, shop in 1893.

A few months ahead of the Duryea Motor Wagon’s debut, Congress authorized the secretary of agriculture to “make inquiry regarding public roads” and to investigate how they might be improved. So it was that in October 1893, agriculture secretary J. Sterling Morton created the Office of Road Inquiry and appointed to head it one Gen. Roy Stone, a Civil War veteran, civil engineer, and vociferous good roads booster from New York. His appointment was the sort of circular affair—a lobbyist pushing for government action that he winds up leading. Stone considered it “settled” that Americans “have the worst roads in the civilized world,” and that their condition was “a crushing tax on the whole people, a tax the more intolerable in that it yields no revenue.” Spending nothing on bad roads cost more than spending money to make them better, he argued, in squandered productivity, spoiled crops, high food prices.

America’s first overland routes started out as game trails

America’s principal overland routes were descended from prehistory— they’d started as game trails, had been commandeered by Native American hunting parties, and later were widened into wagon roads by white settlers. Over decades of use, they’d been cleared of stumps—at least the big ones—but much of their engineering remained the work of buffalo and elk. Improving on that was no easy matter.

Most roads were bare-dirt scars flanked by deep and weedy ditches. The newer ones had high crowns, their edges sloping downhill from their centers to drain water, but it wasn’t long before they were mashed into concavity and diabolically rutted. Some highways were dragged, meaning that after a rain a neighboring landowner would hitch a horse to a rig of split logs and pull it over the ruts to flatten them out. Rebuilding a road consisted of shoveling dirt from its sides into the middle, then tamping it down. Grading with a horse-drawn blade was a cause for local celebration.

How the first roads were built (also see “Why is modern concrete falling apart?”)

A concentration of heavy freight wagons, or “horse trucks,” had forced cities to pave their business districts, but the stone used for the purpose was far too expensive for rural roads built and maintained by county and local governments, which had little income and could tax their citizens only so much. Rains turned rural roads into quagmires. Even the best country road of the early twentieth century was primitive. The most common “improvement” was simply to grade a dirt road’s surface, in an attempt to smooth its bumps and fill its ruts. A step up was sand-clay construction, for which a mix of the two soils would be imported and spread on an earthen bed; the result in theory, was a surface that drained well and with traffic achieved a smooth hardness, but it also broke down quickly under heavy loads.

A little better was the gravel road, on which river rock or broken stone was spread on a graded bed; it held up better than dirt, especially to horse traffic, but had to be dressed regularly to keep the gravel from scattering, and it was stripped bare by the skinny tires and higher speeds of cars and trucks.

The most popular solution to that dilemma was macadam. It pre-dated the automobile by nearly 80 years after it was noticed gravel highways didn’t become smooth and durable until a lot of traffic had compressed their stone into a unified, interlocking mass. In 1816 a smooth dirt bed was covered with a ten-inch layer of stone broken especially for the purpose by workers armed with small hammers, then passed over the rock with a heavy, horse-drawn roller. The sharp-edged stones knitted into a tight bond. American road builders refined his system by spreading a thick layer of large broken stone onto graded earth, rolling it, covering it with a second layer of much smaller stone, and rolling it again. The surface with rock dust, hosed down with water, and rolled it a third time. “Water-bound macadam,” this was called, and it performed well under normal loads and low speeds. To keep dust down, workers topped it with a thin layer of asphalt, a black, sticky, molasses-like petroleum goop or coal-derived tar, which also kept the rock in place. The roads of today are asphaltic concrete, a blend of asphalt or tar and an aggregate, or filler, most commonly broken rock or gravel.

Why people were eager to switch from horses to cars and trucks

Horses required stabling, feed, and health care, which nationally amounted to $2 billion a year, or as much as it cost to maintain all of America’s railroads. Feeding the typical horse consumed five acres of tillable land a year; devoted to food for people, the nation’s feed-producing cropland could support millions [more people]. Horses are slow and can’t keep going fast for long and need frequent rest, food, water. Horses had to work seven times as hard on a dirt road as on a hard, smooth rock surface, and asphalt and brick offered even easier going.

Eisenhower does not deserve the credit for the interstate system

These highways didn’t come from Eisenhower. Long before June 1956, most of its physical details were old news. Its routing had already been nailed down for18 years and design-specifics for 12. FDR had a greater hand in its creation than Eisenhower, and the system’s origins go back much further than even FDR. The true parents were anonymous career technocrats. If the system bore the name of the man most responsible for its existence, it would be called the Thomas H. MacDonald System of Interstate and Defense Highways, who conceived of the network and proposed its construction before World War II.


Posted in Concrete, Infrastructure Books, Roads, Transportation, Transportation Infrastructure, Trucks | Tagged , , , | Comments Off on Biggest Waste of Wealth in All of history: America’s Interstate Highway system

Wind notes from government studies

[These are here to help me do research and find citations]

Notes from 96 page: EERE. August 2014. 2013 Wind technologies market report. Energy Efficiency & Renewable Energy.

No commercial offshore turbines have been commissioned in the United States, but offshore project and policy developments continued in 2013. At the end of 2013, global offshore wind capacity stood at roughly 6.8 GW.

The United States also had the capability of producing approximately 7 GW of blades and 8 GW of towers annually. Despite the significant growth in the domestic supply chain over the last decade, prospects for further expansion have dimmed. More domestic wind manufacturing facilities closed in 2013 than opened. Additionally, the entire wind energy sector employed 50,500 full-time workers in the United States at the end of 2013, a deep reduction from the 80,700 jobs reported for 2012

Independent power producers own 95% of the new wind capacity installed in 2013. [My note: this is why it’s so hard to get true figures to come up with a realistic EROI, because this data is private and when data is shared with scientists, may be from the best performing windfarms, since this could lead to more investment money coming in].

Operations and maintenance costs varied by project age and commercial operations date Operations and maintenance costs are a significant component of the overall cost of wind energy and can vary substantially among projects. Anecdotal evidence and recent analysis (Lantz 2013) suggest that unscheduled maintenance and premature component failure in particular continue to be key challenges for the wind power industry. Given the scarcity, limited content, and varying quality of the data, the results that follow may not fully depict the industry’s challenges with O&M issues and expenditures.

Lack of transmission can be a barrier to new wind power development, and insufficient transmission capacity in areas where wind projects are already built can lead to curtailment, as illustrated earlier. New transmission is particularly important for wind energy because wind power projects are constrained to areas with adequate wind speeds, which are often located at a distance from load centers. There is also a mismatch between the relatively short timeframe often needed to develop a wind power project compared to the longer timeframe typically required to build new transmission. Uncertainty over transmission siting and cost allocation, particularly for multi-state transmission lines, further complicates transmission development.

Moreover, on a cumulative basis considering all wind installed in the United States by the end of 2013, independent power producers (IPPs) own 83% of wind power capacity, while utilities own 15%, with the final 2% owned by entities that are neither IPPs nor utilities (e.g., towns, schools, commercial customers, farmers). On a cumulative basis, utilities own (15%) or buy (54%) power from 69% of all wind power capacity in the United States, with merchant/quasi-merchant projects accounting for 23% and competitive power marketers 8%.

Technology Trends • Turbine nameplate capacity, hub height, and rotor diameter have all increased significantly over the long term. The average nameplate capacity of newly installed wind turbines in the United States in 2013 was 1.87 MW, up 162% since 1998–1999. The average hub height in 2013 was 80 meters, up 45% since 1998-1999, while the average rotor diameter was 97 meters, up 103% since 1998–1999.

Growth in rotor diameter has outpaced growth in nameplate capacity and hub height in recent years. Rotor scaling has been especially significant in recent years, and more so than increases in nameplate capacity and hub heights, both of which have seen a modest reversal of the long-term trend in the most recent years. In 2012, almost 50% of the turbines installed in the United States featured rotors of 100 meters in diameter or larger. Though 2013 was a slow year for wind additions, this figure jumped to 75% in that year.

Turbines originally designed for lower wind speed sites have rapidly gained market share. With growth in average swept rotor area outpacing growth in average nameplate capacity, there has been a decline in the average “specific power” i (in W/m2) among the U.S. turbine fleet over time, from 400 W/m2 among projects installed in 1998–1999 to 255 W/m2 among projects installed in 2013. In general, turbines with low specific power were originally designed for lower wind speed sites. Another indication of the increasing prevalence of lower wind speed turbines is that, in 2012, more than 50% of installations used IEC Class 3 and Class 2/3 turbines; in 2013, based on the small sample of projects installed that year, the percentage increased to 90%.

Trends in sample-wide capacity factors have been impacted by curtailment and inter-year wind resource variability. Wind project capacity factors have generally been higher on average in more recent years (e.g., 32.1% from 2006–2013 versus 30.3% from 2000–2005), but time-varying influences—such as inter-year variations in the strength of the wind resource or changes in the amount of wind power curtailment—have tended to mask the positive influence of turbine scaling on capacity factors in recent years.

Competing influences of lower specific power and lower quality wind project sites have left average capacity factors among newly built projects stagnant in recent years, averaging 31 to 34 percent nationwide. Even when controlling for time-varying influences by focusing only on capacity factors in 2013 (parsed by project vintage), it is difficult to discern any improvement in average capacity factors among projects built after 2005

The average quality of the wind resource in which new projects are located has declined; this decrease was particularly sharp—at 15%—from 2009 through 2012.

Regional variations in capacity factors reflect the strength of the wind resource and adoption of new turbine technology. Based on a sub-sample of wind projects built in 2012, average capacity factors in 2013 were the highest in the Interior (38%) and the lowest in the West (26%).

Not surprisingly, these regional rankings are roughly consistent with the relative quality of the wind resource in each region.

Recently announced turbine transactions have often been priced in the $900–$1,300/kW range. [My comment: So a typical 2 MW turbine (2,000 kW) would cost $1.8 to $2.6 million dollars, and so replacing a 500 MW fossil-powered plant would cost $450 million to $650 million dollars, and last 20 years rather than the 35 year lifespan of natural gas and coal plants]

Operations and maintenance costs varied by project age and commercial operations date. Despite limited data availability, it appears that projects installed over the past decade have, on average, incurred lower operations and maintenance (O&M) costs than older projects in their first several years of operation, and that O&M costs increase as projects age.

Policy and Market Drivers

Availability of Federal incentives for wind projects built in the near term has helped restart the domestic market, but policy uncertainty persists. In January 2013, the PTC was extended, as was the ability to take the 30% investment tax credit (ITC) in lieu of the PTC. Wind projects that had begun construction before the end of 2013 are eligible to receive the PTC or ITC. These provisions have helped restart the domestic wind market and are expected to spur capacity additions in 2014 and 2015. With the PTC now expired and its renewal uncertain, however, wind deployment beyond 2015 is also uncertain.

2013 Wind Technologies Market Report

State policies help direct the location and amount of wind power development, but current policies cannot support continued growth at recent levels. As of June 2014, RPS policies existed in 29 states and Washington D.C. From 1999 through 2013, 69% of the wind power capacity built in the United States was located in states with RPS policies; in 2013, this proportion was 93%. However, given renewable energy growth over the last decade, existing RPS programs are projected to require average annual renewable energy additions of just 3–4 GW/year through 2025 (only a portion of which will be from wind), which is well below the average growth rate in wind capacity in recent years, demonstrating the limitations of relying exclusively on RPS programs to drive future deployment.

[My comment: it appears that wind turbines depend on government subsidies, implying a low EROI]

Solid progress on overcoming transmission barriers continued. Over 3,500 miles of transmission lines came on-line in 2013, a significant increase from recent years. Four transmission projects of particular importance to wind, including the Competitive Renewable Energy Zones project in Texas, were completed in 2013. A decrease in transmission investment is anticipated in 2014 and 2015.

System operators are implementing methods to accommodate increased penetration of wind energy. Recent studies show that wind energy integration costs are almost always below $12/MWh—and often below $5/MWh—for wind power capacity penetrations of up to or even exceeding 40% of the peak load of the system in which the wind power is delivered.

Because federal tax incentives are available for projects that initiated construction by the end of 2013, significant new builds are anticipated in 2014 and 2015. Near-term wind additions will also be driven by the recent improvements in the cost and performance of wind power technologies, leading to the lowest power sales prices yet seen in the U.S. wind sector. Projections for 2016 and beyond are much less certain. Despite the lower price of wind energy and the potential for further technological improvements and cost reductions, federal policy uncertainty—in concert with continued low natural gas prices, modest electricity demand growth, and the aforementioned slack in existing state policies—may put a damper on growth.

The report concentrates on larger-scale wind turbines, defined here as individual turbines that exceed 100 kW in size.1 The U.S. wind power sector is multifaceted, however, and also includes smaller, customer-sited wind turbines used to power residences, farms, and businesses. Data on these smaller turbines are not the focus of this report, although a brief discussion on Smaller Wind Turbines is provided on page 4.

The U.S. wind power market slowed dramatically in 2013, with only 1,087 MW of new capacity added, bringing the cumulative total to 61,110 MW (Figure 1).3 This growth required $1.8 billion of investment in wind power project installations in 2013, for a cumulative investment total of $125 billion since the beginning of the 1980s (all cost and price data are reported in real 2013$).4

The table below summarizes sales of smaller (100-kW and smaller) wind turbines into the U.S. market from 2003 through 2013. As shown, 5.6 MW of small wind turbines were sold in the United States in 2013, with 88% of that capacity coming from U.S. suppliers (Orrell and Rhoads-Weaver 2014). These installation figures represent a very substantial decline in sales relative to recent years. The average installed cost of U.S. small wind turbines in 2013 was reportedly $6,940/kW

Annual Sales of Smaller Wind Turbines (= 100 kW) Year into the United States Capacity Additions Number of Turbines 2003 3.2 MW 3,200 2004 4.9 MW 4,700 2005 3.3 MW 4,300 2006 8.6 MW 8,300 2007 9.7 MW 9,100 2008 17.4 MW 10,400 2009 20.4 MW 9,800 2010 25.6 MW 7,800 2011 19.0 MW 7,300 2012 18.4 MW 3,700 2013 5.6 MW 2,700 Source: Orrell and Rhoads-Weaver (2014) Sales in this sector historically have been driven—at least in part—by a variety of state incentive programs. In addition, wind turbines of 100 kW or smaller are eligible for an uncapped 30% federal investment tax credit (ITC, in place through 2016). The Section 1603 Treasury Grant Program and programs administered by the U.S. Department of Agriculture have also played a role in the sector. According to AWEA (2014a), competitive PV and natural gas prices, suspended state incentives, and a weak economy have all contributed to recent declines in sales.

With the drop-off in annual wind power capacity additions in 2013, wind power’s share of total U.S. electric generation capacity additions in that year shrank to 7% (Figure 2).5 Overall, wind power ranked fourth in 2013 as a source of new generation capacity, behind natural gas (48% of total U.S. capacity additions), solar (26%), and coal (10%). This diminished contribution stands in stark contrast to 2012 when wind power represented the largest source of new capacity in the United States, and it marks a notable divergence from the six years preceding 2013 during which it constituted between 25% and 43% of capacity additions in each year.

Led by the decline in the U.S. market, global wind additions contracted to approximately 36,000 MW in 2013, 20% below the record of roughly 45,000 MW added in 2012. Cumulative global capacity stood at approximately 321,000 MW at the end of the year (Navigant 2014; Table 1).6 The United States ended 2013 with 19% of total global wind power capacity, a distant second to China by this metric (Table 1).7 Annual growth in cumulative capacity in 2013 was 2% for the United States and 13% globally. After leading the world in annual wind power capacity additions from 2005 through 2008, and then losing the mantle to China from 2009 through 2011, the United States narrowly regained the global lead in 2012. In 2013, however, the United States dropped precipitously to 6th place in annual wind additions (Table 1).

The U.S. wind power market represented just 3% of global installed capacity in 2013. The top five countries in 2013 for annual capacity additions were China, Germany, India, the UK, and Canada. Table 1. International Annual Capacity (2013, MW) China 16,088 Germany 3,237 India 1,987 United Kingdom 1,833 Canada 1,599 United States 1,087 Brazil 948 Poland 894 Sweden 724 Romania 695 Rest of World 7,045 TOTAL 36,137 Cumulative Capacity (end of 2013, MW) China 91,460 United States 61,110 Germany 34,468 Spain 22,637 India 20,589 United Kingdom 10,946 Italy 8,448 France 8,128 Canada 7,813 Denmark 4,747 Rest of World 51,031 TOTAL 321,377

A number of countries have achieved relatively high levels of wind energy penetration in their electricity grids. Figure 4 presents data on end-of-2013 (and earlier years’) installed wind power capacity, translated into projected annual electricity supply based on assumed country-specific capacity factors and then divided by projected 2014 (and earlier years’) electricity consumption. Using this approximation for the contribution of wind power to electricity consumption, and focusing only on those countries with the greatest cumulative installed wind power capacity, end-of-2013 installed wind power is estimated to supply the equivalent of 34% of Denmark’s electricity demand and approximately 20% of Spain, Portugal and Ireland’s demand. In the United States, the cumulative wind power capacity installed at the end of 2013 is estimated, in an average year, to equate to almost 4.5% of the nation’s electricity demand. On a global basis, wind energy’s contribution is estimated to be 3.4%.

On a cumulative basis, Texas remained the clear leader among states, with 12,354 MW installed at the end of 2013—more than twice as much as the next-highest state (California, with 5,829 MW). In fact, Texas has more installed wind capacity than all but five countries (including the United States) worldwide. States (distantly) following Texas in cumulative installed capacity include California, Iowa, Illinois, Oregon, and Oklahoma—all with more than 3,000 MW. Thirty-four states, plus Puerto Rico, had more than 100 MW of wind capacity installed as of the end of 2013, with 23 of these topping 500 MW, 16 topping 1,000 MW, and 10 topping 2,000 MW. Although all commercial wind projects in the United States to date have been installed on land,

The right half of Table 2 lists the top 20 states based on actual wind electricity generation in 2013 divided by total in-state electricity generation in 2013.9 Iowa and South Dakota lead the list, each with more than 25% wind penetration. A total of nine states have achieved wind penetration levels of above 12% of in-state generation.

Wind energy penetration can either be expressed as a percentage of in-state load or in-state generation. In-state generation is used here, primarily because wind energy (like other energy resources) is often sold across state lines, which tends to distort penetration levels expressed as a percentage of in-state load.

Annual (2013) California 269 Kansas 254 Michigan 175 Texas 141 New York 84 Nebraska 75 Iowa 45 Colorado 32 Ohio 3 Massachusetts 3 Alaska 3 North Dakota 2 Indiana 1 Puerto Rico 1 Rest of U.S. 0 TOTAL 1,087 Table 2. U.S. wind power rankings: the top 20 states Percentage ofInstalled Capacity (MW)In-State Generation

Cumulative (end of 2013) Actual (2013)* Texas California Iowa Illinois Oregon Oklahoma Minnesota Kansas Washington Colorado New York North Dakota Indiana Wyoming Pennsylvania Michigan Idaho South Dakota New Mexico Montana Rest of U.S. TOTAL 12,354 Iowa 27.4% 5,829 South Dakota 26.0% 5,177 Kansas 19.4% 3,568 Idaho 16.2% 3,153 Minnesota 15.7% 3,134 North Dakota 15.6% 2,987 Oklahoma 14.8% 2,967 Colorado 13.8% 2,808 Oregon 12.4% 2,332 Wyoming 8.4% 1,722 Texas 8.3% 1,681 Maine 7.4% 1,544 California 6.6% 1,410 Washington 6.2% 1,340 New Mexico 6.1% 1,163 Montana 6.0%

One testament to the continued interest in land-based wind energy is the amount of wind power capacity currently working its way through the major transmission interconnection queues across the country. Figure 7 provides this information for wind power and other resources aggregated across 37 different interconnection queues administered by independent system operators (ISOs), regional transmission organizations (RTOs), and utilities.11 These data should be interpreted with caution: although placing a project in the interconnection queue is a necessary step in project development, being in the queue does not guarantee that a project actually will get built. Efforts have been made by FERC, ISOs, RTOs, and utilities to reduce the number of speculative projects that have—in recent years—clogged these queues. One consequence of those efforts, as well as perhaps the uncertain size of the future U.S. wind market, is that the total amount of wind power capacity in the nation’s interconnection queues has declined dramatically since 2009.

Much of the wind capacity in the interconnection queues is planned for Texas, the Midwest, Southwest Power Pool (SPP), PJM Interconnection, the Northwest, the Mountain region, and California; wind power projects in the interconnection queues in these regions at the end of 2013 accounted for 95% of the aggregate 114 GW of wind power in the selected queues (Figure 8). Smaller amounts of wind power capacity were represented in the interconnection queues of ISONew England (ISO-NE, 2.5%), the New York ISO (NYISO, 1.9%), and the Southeast (0.7%).

Manufacturing facilities that produce multiple components are included in multiple bars. “Other” includes facilities that produce items such as: Enclosures, composites, power converters, slip-rings, inverters, glass prepeg, electrical components, tower internals, climbing devices, couplings, castings, steel, rotor hubs, plates, walkways, doors, bearing cages, fasteners, bolts, magnetics, safety rings, struts, clamps, fiberglass, transmission housings, embed rings, electrical cable systems, yaw/pitch control systems, bases, generator plates, slew bearings, lubrication, resin, flanges, anemometers, template rings. Source: National Renewable Energy Laboratory Figure 11. Number of operating wind turbine and component manufacturing facilities in the United States Five of the ten wind turbine OEMs with the largest share of the U.S. market through 2013 (GE, Vestas, Siemens, Gamesa, Acciona) had one or more manufacturing facilities in the United States at the end of 2013. In contrast, nine years earlier (2004), there was only one active utility-scale wind energy OEM assembling nacelles in the United States (GE).15 In 2013, however, several of the OEMs’ manufacturing facilities were largely if not entirely dormant given the lack of turbine orders, and at least one of these facilities was subsequently closed in 2014. Another major OEM, Nordex, ceased U.S. manufacturing in 2013, while several others stopped U.S. manufacturing in past years (e.g., Clipper and Suzlon). In aggregate, domestic turbine nacelle assembly capability—defined here as the maximum nacelle assembly capability of U.S. plants if all were operating at maximum utilization—grew from less than 1.5 GW in 2006 to exceed 12 GW in 2012, before dropping to roughly 10 GW in 2013 (Figure 12;

Manufacturing facilities that produce multiple components are included in multiple bars. “Other” includes facilities that produce items such as: Enclosures, composites, power converters, slip-rings, inverters, glass prepeg, electrical components, tower internals, climbing devices, couplings, castings, steel, rotor hubs, plates, walkways, doors, bearing cages, fasteners, bolts, magnetics, safety rings, struts, clamps, fiberglass, transmission housings, embed rings, electrical cable systems, yaw/pitch control systems, bases, generator plates, slew bearings, lubrication, resin, flanges, anemometers, template rings.

Figure 14 presents calendar-year data on the dollar value of estimated imports to the United States of wind-related equipment that can be tracked through trade codes. Specifically, the figure shows imports of wind-powered generating sets (i.e., nacelles not surprisingly, taller towers have seen higher market share in the Great Lakes (56%) and Northeast (43%) than in the Interior (7%) and West (3%). This is largely due to the fact that such towers are most commonly used in lower wind speed sites, and presumably those with higher wind shear, to access the better wind speeds that are typically higher up.

Figure 31. Average cumulative sample-wide capacity factor by calendar year Table 5.

Inter-Year Wind Resource Variability. The strength of the wind resource varies from year to year, in part in response to significant persistent weather patterns such as El Niño/La

Competing influences of lower specific power and lower quality wind project sites have left average capacity factors among newly built projects stagnant in recent years, averaging 31 to 34 percent nationwide

Counterbalancing the decline in specific power, however, has been a tendency to build new wind projects in lower-quality wind resource areas; this is especially the case among projects installed from 2009 through 2012.

the average estimated quality of the wind resource at 80 meters among projects built in 2012 (i.e., the most recent project vintage in our capacity factor sample included in figure 32) is roughly 15% lower than it is among projects built back in 1998–1999 and that the decline has been particularly sharp since 2008.45 Although there was a bit of a rebound in 2013 (which will impact our sample in future years), this trend of building wind power projects in progressively lower-quality wind resource areas is a key reason why overall average capacity factors have not increased for projects installed in recent years. The trend may also come as a surprise, given that the United States still has an abundance of undeveloped high-quality wind resource areas.

Several factors could be driving this trend:

Technology Change. The increased availability of low-wind-speed turbines that feature higher hub heights and a lower specific power may have enabled the economic build-out of lower-wind-speed sites. Transmission and Other Siting Constraints. Developers may have reacted to increasing transmission constraints (or other siting constraints, or even just regionally differentiated wholesale electricity prices) by focusing on those projects in their pipeline that may not be located in the best wind resource areas but that do have access to transmission (or higher priced markets, or readily available sites without long permitting times).

Policy Influence. Projects built in the 4-year period from 2009 through 2012 were able to access a 30% cash grant (or ITC) in lieu of the PTC. Because the dollar amount of the grant (or ITC) was not dependent on how much electricity a project generates, it is possible that developers seized this limited opportunity to build out the less-energetic sites in their development pipelines. Additionally, state RPS requirements sometimes require or motivate in-state or in-region wind development in lower wind resource regimes.

Berkeley Lab has gathered price data for 112 U.S. wind turbine transactions totaling 29,250 MW announced from 1997 through the beginning of 2014, including ten transactions (2,082 MW) announced in 2013/14. Sources of turbine price data vary, including SEC and other regulatory filings, as well as press releases and news reports. Most of the transactions included in the Berkeley Lab dataset include turbines, towers, delivery to site, and limited warranty and service agreements.48 Nonetheless, wind turbine transactions differ in the services included (e.g., whether towers and installation are provided, the length of the service agreement, etc.), turbine characteristics (and therefore performance), and the timing of future turbine delivery, driving some of the observed intra-year variability in transaction prices.


Unfortunately, collecting data on U.S. wind turbine transaction prices is a challenge: only a fraction of the announced turbine transactions have publicly revealed pricing data. In part as a result, Figure 38—which depicts these U.S. wind turbine transaction prices—also presents data from: (1) Vestas on that company’s global average turbine pricing from 2005 through 2013, as reported in Vestas’ financial reports; and (2) a range of recent global average wind turbine prices for both older turbine models (smaller rotors) and newer models (larger rotors), as reported by Bloomberg NEF (2014b).

After hitting a low of roughly $750/kW from 2000 to 2002, average wind turbine prices increased by approximately $800/kW (more than 100%) through 2008, rising to an average of more than $1,500/kW. The increase in turbine prices over this period was caused by several factors, including a decline in the value of the U.S. dollar relative to the Euro; increased materials, energy, and labor input prices; a general increase in turbine manufacturer profitability due in part to strong demand growth and turbine and component supply shortages; increased costs for turbine warranty provisions; and an up-scaling of turbine size, including hub height and rotor diameter (Bolinger and Wiser 2011).

our limited sample of recently announced U.S. turbine transactions shows pricing in the $900–$1,300/kW range. Bloomberg NEF (2014b) reports global average pricing for the most-recent contracts of approximately $1,000/kW for older turbine models and $1,300/kW for newer turbine models that feature larger rotors.

In aggregate, the dataset (through 2013) includes 708 completed wind power projects in the continental United States totaling 50,210 MW and equaling roughly 82% of all wind power capacity installed in the United States at the end of 2013.

Operations and maintenance costs varied by project age and commercial operations date Operations and maintenance costs are a significant component of the overall cost of wind energy and can vary substantially among projects. Anecdotal evidence and recent analysis (Lantz 2013) suggest that unscheduled maintenance and premature component failure in particular continue to be key challenges for the wind power industry.

Figure 44 shows an upward trend in project-level O&M costs as projects age, although the sample size after year 5 is limited. In addition, the figure shows that projects installed more recently (from 2005–2008 and/or 2009-2012) have had, in general, lower O&M costs than those installed in earlier years (from 1998–2004), at least for the first 8 years of operation. Parsing the “recent project” cohort into two sub-periods, however, reveals that this trend towards lower costs has not necessarily continued with the most recent projects in the sample, those installed from 2009-2012 (though cost differences between the 2005-2008 and 2009-12 sample are small and sample size is limited).


Many of the projects installed more recently may still be within their turbine manufacturer warranty period, and/or may have capitalized O&M service contracts within their turbine supply agreement.

As indicated previously, the data presented in Figures 43 and 44 include only a subset of total operating expenses. In comparison, the financial statements of public companies with sizable U.S. wind project assets indicate markedly higher total operating costs. Specifically, two companies—Infigen and EDP Renováveis (EDPR), which together represented approximately 4,730 MW of installed capacity at the end of 2013 (nearly all of which has been installed since 2000)—report total operating expenses of $24.2/MWh and $23.6/MWh, respectively, for their U.S. wind project portfolios in 2013 (EDPR 2014, 2013, 2012; Infigen 2014, 2013, 2012, 2011).59 These total operating expenses are more than twice the $10/MWh average O&M cost reported above for the 85 projects in the Berkeley Lab data sample installed since 2000.

This disparity in operating costs between these two project owners and the Berkeley Lab data sample reflects, in large part, differences in the scope of expenses reported.

Important Note: Notwithstanding the comparisons made in this section, neither the wind nor wholesale electricity prices (nor fuel cost projections) reflect the full social costs of power generation and delivery. Specifically, the wind PPA prices are reduced by virtue of federal and, in some cases, state tax and financial incentives. Furthermore, these prices do not fully reflect integration, resource adequacy, or transmission costs.

Various policy drivers at both the federal and state levels have been important to the expansion of the wind power market in the United States, as have been federal investments wind energy research and development (R&D). In addition to R&D expenditure, at the federal level, the most important policy incentives in recent years have been the PTC (or, if elected, the ITC), accelerated tax depreciation, and an American Recovery and Reinvestment Act of 2009 (Recovery Act) provision that enabled wind power projects to elect, for a limited time, a 30% cash grant in lieu of the PTC.

First established in 1992, the PTC provides a 10-year, inflation-adjusted credit that stood at 2.3¢/kWh in 2013.

The historical importance of the PTC to the U.S. wind power industry is illustrated by the pronounced lulls in wind power capacity additions in the 4 years (2000, 2002, 2004, 2013) in which the PTC lapsed as well as the increased development activity often seen during the year in which the PTC is otherwise scheduled to expire (see Figure 1); the spike in wind additions in 2012 is a clear example of this latter effect.

Accelerated tax depreciation enables wind project owners to depreciate the vast majority of their investments over a 5- to 6-year period for tax purposes. An even more attractive 50% 1st-year “bonus depreciation” schedule was in place during 2008–2010. Legislation in midDecember 2010 further increased 1st-year bonus depreciation to 100% for those projects placed in service between September 8, 2010 and the end of 2011, after which the 1st-year bonus reverted to 50% for projects placed in service during 2012. The American Taxpayer Relief Act then extended this 50% bonus depreciation for qualifying property placed in service in 2013 (and 2014 for certain long-lived property).

From 1999 through 2013, 69% of the wind power capacity built in the United States was located in states with RPS policies; in 2013, this proportion was 93%.66 As of June 2014, mandatory RPS programs existed in 29 states and Washington D.C. (Figure 50).67

In aggregate, existing state RPS policies require that by 2025 (at which point most state RPS requirements will have reached their maximum percentage targets) at least 9% of total U.S. generation supply will be met with RPS-eligible forms of renewable electricity, equivalent to roughly 106 GW of renewable generation capacity.68 Incremental growth in RPS requirements through 2025 represents 40% of projected growth in total U.S. electricity generation over that timeframe, although some portion of the growth in RPS requirements may be met with existing capacity (e.g., in regions that are currently over-supplied relative to their RPS targets).

Given the size of RPS targets and the amount of new renewable energy capacity that has been built since enactment of those policies, Berkeley Lab projects that existing state RPS programs require average annual renewable energy additions of roughly 3–4 GW/year through 2025, not all of which will be wind.69 This is below the average of 7 GW of wind power capacity added in each year over the 2007–2013 period, and even further below the 9 GW per year of total renewable generation capacity added during that time frame, demonstrating the limitations of relying exclusively on state RPS demand to drive future wind power development.

WA: 15% by 2020 MN: 26.5% by 2025ME: 40% by 2017MT: 15% by 2015 Xcel: 31.5% by 2020 NH: 24.8% by 2025 ND: 10% by 2015 MI: 10% by 2015 VT: 20% by 2017MA: 11.1% by 2009 +1%/yrOR: 25% by 2025 (large utilities) 5-10% by 2025 (smaller utilities) SD: 10% by 2015 WI: 10% by 2015 NY: 30% by 2015RI: 16% by 2019 PA: 8.5% by 2020 NV: 25% by 2025 IA: 105 MW by 1999 CT: 23% by 2020 NJ: 22.5% by 2020DE: 25% by 2025 OH: 12.5% by 2024 UT: 20% by 2025 KS: 20% of peak IL: 25% by 2025 demand by 2020 CO: 30% by 2020 (IOUs) MO: 15% by 2021CA: 33% by 2020 20% by 2020 (co-ops) 10% by 2020 (munis)OK: 15% by 2015 AZ: 15% by 2025 NM: 20% by 2020 (IOUs) 10% by 2020 (co-ops) AK: 50% by 2025 DC: 20% by 2020 MD: 20% by 2022 VA: 15% by 2025 NC: 12.5% by 2021 (IOUs) 10% by 2018 (co-ops and munis) TX: 5,880 MW by 2015 HI: 40% by 2030 Mandatory RPS Non-Binding Goal Source: Berkeley Lab

State renewable energy funds provide support for wind power projects (both financial and technical) in some jurisdictions, as do a variety of state tax incentives.

Transmission development has gained traction in recent years. FERC reports that over 3,500 miles of transmission lines came on-line in 2013, a significant increase from recent years (Figure 51). Another 15,000 miles of transmission lines are in various stages of development with a proposed on-line date of 2016 or earlier, with about one-third of those lines having a high probability completion (FERC 2014). According to the Edison Electric Institute (EEI), total transmission investment by investor-owned utilities reached $17.5 billion in 2013. EEI forecasts a decrease in investment in 2014 and 2015, primarily attributable to recent economic conditions and the continuance of low electric demand growth. Nonetheless, EEI identified over 170 transmission projects in development representing more than $60 billion in possible investment, 76% of which would—at least in part—support the integration of renewable energy (EEI 2014).

One of the most significant transmission undertakings devoted to wind power, the Competitive Renewable Energy Zones (CREZ) project in Texas, was largely finished by the end of 2013. The CREZ includes almost 3,600 circuit miles of transmission lines and was designed to accommodate up to 18,500 MW of total wind power capacity, 11,500 MW of which is additional to what existed when the lines were planned in 2008.70 The $6.8 billion cost of CREZ was $2 billion higher than first estimated, in part because over 600 circuit miles of additional transmission lines were needed to accommodate requested changes in routing from landowners. Because of CREZ, ERCOT reports that wind-related congestion between West Texas and other zones has largely disappeared. Moreover, ERCOT predicts that over 7,000 MW of new wind capacity will be installed in Texas by the end of 2015, with another 1,300 MW projected to come online in 2016. ERCOT recently issued a report stating that projected wind development in the Texas Panhandle is exceeding expectations, and additional transmission, reactive power and synchronous condensers will need to be added (ERCOT 2014). Partly in response, the Texas PUC has opened a staff investigation on whether any such costs should be assigned to renewable energy generators rather than to all customers, as is currently the case (Texas PUC 2014).


Elsewhere, NV Energy and Great Basin Transmission South, an affiliate of LS Power, completed the 236 mile, 500-kV, One Nevada transmission project that connects NV Energy and Sierra Pacific Power. LS Power is also developing two other transmission projects: the 500-kV Southern Nevada Intertie Project and the 500-kV Southwest Intertie Project North, both of which in combination with the ON Line could transmit over 2,000 MW. Two other transmission projects of importance to wind that were completed in 2013 include: (1) the Montana-Alberta Tie Line, a 230-kV merchant transmission line capable of transmitting 300 MW that connects Alberta to Northwestern Energy in Montana; and (2) the Pawnee-Smoky Hill double-circuit, 345-kV transmission line between the cities of Brush and Aurora in Colorado, which can transmit 300 to 500 MW of generation.

Due to the variable nature of wind, considerable attention is paid to the potential impacts of wind energy on power systems. Concerns about, and solutions to, these issues have affected, and continue to impact, the pace of wind power deployment in the United States. Experience in operating power systems with wind energy is also increasing worldwide, leading to an emerging set of best practices (Exeter and GE 2012, WGA 2012).

Figure 52 provides a selective listing of estimated wind integration costs associated with increased wind energy from integration studies completed from 2003 through 2013 at various levels of wind power capacity penetration. With one exception, wind integration costs estimated by the studies reviewed are below $12/MWh—and often below $5/MWh—for wind power capacity penetrations up to and even exceeding 40% of the peak load of the system in which the wind power is delivered. Variations in estimated costs across studies are due, in part, to differences in methodologies, definitions of integration costs, power system and market characteristics, wind energy penetration levels, fuel price assumptions, and the degree to which thermal power plant cycling costs are included.

Note also that the rigor with which the various studies have been conducted varies, as does the degree of peer review.

Finally, there has been some recent literature questioning the methods used to estimate wind integration costs and the ability to disentangle those costs explicitly, with up to 30% of PJM’s energy coming from wind and solar, given adequate transmission expansion and additional regulating reserves.

Posted in Wind | Comments Off on Wind notes from government studies