Walter Youngquist: Geodestinies

Preface. I was fortunate enough to know Walter for 15 years. He became a friend and mentor, helping me learn to become a better science writer, and sending me material I might be interested in, and delightful pictures of him sitting in a lawn chair and feeding wild deer who weren’t afraid of him. I thought his book Geodestinies: The Inevitable Control of Earth Resources over Nations and Individuals, published in 1997, was the best overview of energy and natural resources ever written, and encouraged him to write a second edition. He did try, but he spent so much time taking care of his ill wife, that he died before finishing it. I’ve made eight posts of just a few topics from the version that was in progress when he died at 96 years old in 2018 (500 pages).

More than any other energy and resources writer I know of, he focused on population as being the main problem that needed to be solved if we hoped to have a better future.

This first part covers many topics about energy, consumption, war, soil, oil production on various countries, and more. I have several more sections of this book in other posts under Experts/Walter Youngquist

Other Youngquist Geodestinies Posts:

Alice Friedemann www.energyskeptic.com  author of “Life After Fossil Fuels: A Reality Check on Alternative Energy“, 2021, Springer; “When Trucks Stop Running: Energy and the Future of Transportation”, 2015, Springer; Barriers to Making Algal Biofuels, and “Crunch! Whole Grain Artisan Chips and Crackers”. Podcasts: Collapse Chronicles, Derrick Jensen, Practical Prepping, KunstlerCast 253, KunstlerCast278, Peak Prosperity , XX2 report

***

The destinies of all nations and all people are in many ways bound up with the mineral and energy mineral resources of the Earth. Events of the geologic past have richly endowed some nations with valuable resources, whereas others have very few. The result is markedly different destinies for different nations. How these resources have affected the peoples of the past, how they influence our lives now, and how they will determine our futures is the study of GeoDestinies.

In a relative geological fraction of a second, these resources are being consumed. Soon these gifts from the past — in the case of mineral energy resources, petroleum, coal, and uranium — will be gone forever. Some metals can be reclaimed and recycled. Still, there is an inevitable percentage that will be dissipated and can never be recovered.

Currently in the United States, about 25 percent of all energy produced is used to produce other energy. Energy is essential to drill for oil, mine coal, mine uranium, cut wood, make solar and wind energy conversion devices, and so on. As the easily recoverable energy mineral resources (petroleum, coal, uranium) are increasingly exhausted, the cost in energy to produce more energy is estimated to rise to about 33% in the next ten years. It will almost certainly continue to rise after that. This trend in energy costs can be fatal. If it ultimately takes as much in energy as the energy produced by the effort, there is no energy surplus to use in other energy consuming sectors of the economy. At that point, the game is up.

Professor David Rutledge at the California Institute of Technology projects that 90% of all economically recoverable fossil fuels will be exhausted by 2070, meaning that they will be diminishing far earlier than that.

The globalization of commerce and trade by use of oil has led to the worldwide exploitation of mineral and energy resources by the industrialized and industrializing countries, in effect, “the tragedy of the commons” (Hardin, 1969) in its ultimate final form. The decline of oil production will in turn result in the return of local economies forced to exist on more locally available resources, as has been the circumstance during much of human history. This will greatly remake our economies and lifestyles from what we know today.  

Due to differences in living standards, some populations (in industrialized countries) use more resources per capita than other populations. In some places local populations are so desperate to survive they destroy the environment with present use and cannot preserve it to sustain future population. In general, population growth and the environment are in direct conflict.

Around the world, the most easily discovered and recovered, higher-grade mineral and energy mineral deposits are used first. Thus, there is increased demand each year against resources that are declining in quality and cost more in both energy and money to obtain.

The desire for an understandable increased standard of living, together with the continuing rise in population, creates an exponential demand on mineral resources. In the first 50 years of the 20th  century, the total world production of minerals and mineral fuels was far greater than the total production of these materials during all previous history. Then, in the following twenty years, this production was exceeded again by approximately 50%. When graphed, these statistics show an exponential curve that is rising steeply toward a vertical line. Such a rate of consumption cannot be sustained.

The dependence of the United States on imported minerals continues to increase. In 1986, the country imported 100% of five essential minerals. By 2000, the number of minerals for which we are 100% import-dependent increased to 13. U.S. dependence on imports includes manganese necessary for steel production, the yttrium used in color TVs and computer monitors, and mica used in electrical transformers. In 2000 the United States had a net import reliance of greater than 50% for 33 mineral materials.

Over the long-term, fertile soil and fresh water supplies of the United States are the most valuable of all its resources.

Minerals, including energy minerals, are the basis for our modern civilization. Nations not possessing these are either doomed to remain at a relatively low standard of living, or they have to get these resources in raw or finished form by trade or by moving industries abroad where the resources exist. Can free trade and access to raw materials prevent the “Japan decision” to go to war for resources? Minerals and energy minerals have markedly altered the course of civilization through warfare.

We must become stewards of the resources of our own regions, assuring that the fertility of the soil and the purity of water and air are maintained to provide material and energy needs and to absorb wastes, and recycling materials for continual use.

The story of the importance of minerals and the rise and progress of civilizations are parallel stories. The search for and discovery of minerals from salt to gold and silver have caused mass migrations of people. Searching for minerals has been the cause of the opening of new lands. It has been said that “the flag follows the miner’s pick.” The quest for gold and silver lured Spaniards to the New World, resulting in the conquests of Mexico, Colombia, Peru, and some of the adjacent lands.

Migrations of people today to resource areas, or to nations that can import resources, are perhaps greater than at any time in the past. Seeking jobs and a higher standard of living, largely based on Earth resources, people today are moving, both legally and illegally, by the millions.

As a result of resource depletion caused by rising population, refugees, often with different birthrates, will markedly change the demographics of much of the world in this century. The fundamental causes of resource-related population migration and growth, such as land degradation and desertification, energy, food and water demand, are the essential forces for monumental changes we will see this century (Duguid, 2004). People are on the move.

Although the resources are consumed mostly by the generations that discover and develop them, there is an argument that at least some of these riches should be passed on in some form to future generations who did not have the good fortune of living during this period of great mineral wealth. These are your children and your children’s children. To be sure, some of this wealth will be there in the future in the form of the buildings, factories, houses, roads, bridges, railroads, locks, canals, power stations, water lines, sewers, and many other structures for which mineral resources and the wealth derived from them are used. But in the case of fossil fuels, although they help to construct these physical features of civilization, their use leaves no legacy when used to power motor vehicles. The same is true with other energy uses such as space heating, and in producing products with a limited life such as automobiles, airplanes, household appliances, and sporting goods. Some of these products can be recycled, but inevitably much will be discarded.

The United States still has rich fertile land, but even that is being degraded by erosion and soil nutrient depletion, and the groundwater supplies needed to support irrigated lands are being over-pumped. Increasingly, the United States lives on “imported affluence.” Unending tides of immigrants continue to arrive in a land that is now the third most populous nation in the world, to share in a fading American dream.

In general, the oil we now recover is lower grade than previously. It takes more energy to refine the same high-quality end product from lower grade oil than higher-grade oil. Recovering oil from the Athabasca oil sands of Canada, for example, and then upgrading it to a product equal to what we can recover from conventional oil wells takes considerably more energy.

The answer to the question “what’s the answer?” is that it is not going to be possible to keep the current game going, hugely dependent as we are on fossil fuels. When I say this, I sometimes add that if I did have “the answer” and could patent it, within five years, I would be the world’s richest man. When I tell the audience there is no simple solution, I generally do not get invited back. We all like simple, inexpensive answers to problems. The problem of replacing oil offers no easy or inexpensive solutions.

The thin veneer of civilization. The isolated violence that occurred in the gasoline lines in the U.S. during the 1973 and 1979 oil crises suggest that civilization, even in a highly civilized United States, is a perilously thin veneer. The British social critic, C. P. Snow, wrote: “Civilization is hideously fragile and there’s not much between us and the horrors beneath, just about a coat of varnish.” That thin coat of varnish consists of the availability of the basics of life — food, shelter, and clothing. The ability to produce and distribute them in the huge quantities in which they are in demand today is possible only through the use of mineral and energy resources. Earth resources will increasingly affect the stability of our societies (LindahlKiesling, 1994).

Consumption

Since World War II, the world, led by the United States, has consumed more natural resources than in all previous history. That was the twentieth century.

North America, and particularly the United States, initially had resources in variety and abundance virtually unmatched by any other area of the world. With this marvelous spectrum of mineral and energy resources, the United States grew from a wilderness to become the richest and most powerful nation in the world in less than 400 years

Such development is historically unprecedented and can probably never be repeated.

By the late 1920s, the United States, with six percent of the world’s population, was producing 70 percent of the world’s oil, almost 50 percent of its copper, 46 percent of its iron, and 42 percent of its coal (Groner, 1972). The ability to produce and use these basic industrial materials and energy resources in large volumes was the key to the phenomenal development of the United States.

Including sand, gravel, cement, dimension stone, clay, and the energy and metal supplies already listed, more than five billion tons of new minerals are needed each year to support the U.S. economy. These demands add up to more than 20 tons of raw energy mineral and mineral supplies which have to be produced each year for every man, woman, and child in the United States, if our material standard of living is to be maintained. And, importantly, these demands increase in total size each year as our population grows by natural native increase, and by both legal and illegal immigration.

How fast a culture advances has largely been determined by what mineral and energy mineral resources it had available to it and to what degree technology development allowed them to be used. Mineral and energy resources combined with human ingenuity have been the mainsprings of civilization.

Energy is the key which unlocks all other natural resources and provides the physical and economic foundations of modern civilization (Ayers and Scarlott, 1952).

Without energy, the wheels of industry do not turn, no metals are mined and smelted. No cars, trucks, trains, ships or airplanes could be built, and if built, they could not move without energy. Without energy, houses would remain cold and unlighted; food would be uncooked. Our large agricultural areas could not be plowed or planted with the ease and on the vast scale they are today with relatively little human labor. Military defense as we know it today would not exist.

OIL

Pope (1996) commented, “If oil wealth is like winning the lottery, nations act like lottery winners: They tend to blow the money”. Some do, and some don’t.

Possibly the last mineral to significantly move people in the United States is the oil in the Bakken Formation in the Williston Basin of North Dakota. People from all across the United States moved to Williston to work in the development of the Bakken Field and all the supporting facilities. Building housing for the inflow of population could not meet demand, forcing people to sleep in their trucks. When the oil is gone, North Dakota will likely return to its agrarian economy, perhaps symbolic of all economies when the exploitation of nonrenewable Earth resources ends, and industrial societies must revert to agrarian economies.

Energy resources have since moved much of the population off the farms and into the cities. Today, with the use of petroleum powered farm machinery, only about two percent of America’s population farms the land, where a hundred years ago the majority of people did. But energy slaves (chiefly oil) now do the farm work, causing another great migration of people to the industrial areas, which, in turn, exist because of abundant energy to run factories.

Oil: A highly complex expensive enterprise. The oil industry plays an important part in countless ways in the lives of nearly all of us. The oil industry in its entirety including the exploration, drilling, production, transportation, refining, petrochemical production, and marketing uses more varied technology than any other industry in the world. These range from space satellites, to the highly complex science of organic chemistry. In between, seismology, directional drilling, drilling in waters a mile or more deep, and putting vast quantities of steam into the ground may be involved, among many other activities. The oil industry invests more money, by far, than any other industry in the world to conduct its operations.

WAR & RESOURCES

I wholeheartedly support Brown’s comments regarding military budgets and priorities. Brown observes that the projected military budget for the U.S. is $492 billion, which is approximately equal to the combined military budgets of all of the rest of the world combined. He proposes an annual U.S. budget of only $161 billion that would include such social goals as universal health care, family planning, adult literacy programs, and universal primary education. Goals and expenditures to benefit the Earth include reforestation, protecting topsoil on cropland, restoring fisheries, restoring rangelands, and protecting biological diversity.

The resource that all warring sides must have is water. Control of water supplies has been a tool in warfare in various ways. In the sixth century B.C., the King of Syria seized water wells as part of his campaign against Arabia. The Inca conquered the desert coastal cities of Peru such as Chan Chan by cutting off their water supply. In feudal times in Europe, castles or other fortresses under siege were vulnerable if they did not have water supplies within their walls. The enemy quickly determined if such was the case. Also, moats filled with water were part of the standard military protection of the day.

In peacetime, control of water can be used as a form of economic warfare. More than 30 nations receive one-third or more of their water from outside their borders. In the case of Egypt, it is 97 percent, Hungary 95 percent, Syria 79 percent, and Iraq 66 percent. With their surface waters chiefly under the control of other countries, these and 16 other nations which obtain more than 50 percent of their surface waters coming from outside their borders are vulnerable to economic water warfare.

Hitler’s oil supplies began to fail. German motorized divisions toward the end of the war suffered markedly from lack of oil. When General George Patton was finally on the move across France with the Germans in full retreat, pipeline specialists from Texas (where else!) followed Patton’s tanks and laid pipeline at a rate of up to 50 miles a day. And there was oil to fill those pipelines, because during World War II, the Allies controlled 86 percent of the world’s oil supply.

To obtain markets for finished industrial goods, and to obtain raw materials, chiefly minerals, for building armaments, and to supply their industrial complex, Germany began to look hungrily at adjacent territories. After the Franco-Prussian War of 1871, Germany annexed iron-rich Alsace-Lorraine. Unfortunately, they later found that the boundaries they set did not include the bulk of the iron deposits because of the geologic structure there. Germany captured the surface outcrop area, but the iron-formation beds, with most of the iron ore, dipped westward into French territory. They apparently had a good military department, but a poor geology department. Germany fought the First World War in part “to correct the error of 1871.” After losing World War I, however, Germany had to give up this territory.

The experience of World War I made both the Allies and the Central Powers (Germany and its allies) keenly aware of the need for minerals with which to conduct military operations. Immediate and extensive post-war mineral exploration and development programs for both foreign and domestic sources were started by Britain and France. Because these countries, especially Great Britain, still had extensive colonial holdings, there was a lot of territory to explore. Germany, in contrast, lost all its foreign possessions, which was one of the circumstances that precipitated World War II. As Germany prepared for World War II in the 1930s under Hitler, it had been unable to regain its colonies, so it began to annex its immediate neighbors who possessed useful resources. Austria was next door and had some small iron deposits. It was the first to be taken. Czechoslovakia contained famous mining districts with fairly large iron deposits, and a variety of other metals. Czechoslovakia was taken next. With the early defeat of France in World War II, Germany regained control of the iron of Alsace-Lorraine.

Growing industrialization, with its huge demand for raw materials, growing populations, and the desire for a higher standard of living were the immediate causes for the intensified search for resources. And in the background was the thought that should another war come, the materials must be available in order to survive and win it. Hitler

In World War II, once Germany had conquered France and driven the British back across the English Channel, Hitler turned east. In keeping with his belief in lebensraum (the territory necessary for national existence and economic self-sufficiency), Hitler long held the view that only the Soviet Union had adequate land and minerals to take care of Germany’s needs (Rich, 1973). After taking this region, Hitler said, “We shall become the most self-supporting state in every respect in the world. Timber we will have in abundance, iron in unlimited quantities, and the greatest manganese-ore mines in the world, and oil—we shall swim in it.” Hitler turned his armies toward the Urals and the Ukraine. This region, along with the Donets Basin, contains extensive deposits of hematite (high grade iron ore), excellent coking coal, and limestone—the three fundamental ingredients for steel-making.

Oil to move implements of war It was not only metals that became so clearly evident as important tools of warfare in World War I. Energy, chiefly in the form of that relative newcomer, oil, was obviously going to be very significant. Some of the Allied ships bringing troops and supplies across the Atlantic from the United States to Europe were coal-fired and some were oil-fired. The oil-powered ships were the better and faster vessels, greatly speeding delivery of both troops and equipment. Oil grew more important in warfare. Gasoline-powered tanks made their first appearance on the military scene in World War I. Airplanes, fueled by gasoline, primitive as they were, also came into the war in a limited fashion.

For the first time in a major conflict, trucks replaced horse-drawn vehicles on a large scale. Recognizing this in the time between World War I and World War II, world military establishments began to give serious consideration to oil supplies. This is why Hitler coveted the oilfields of the southern Soviet Union.

By the time Pearl Harbor broke out, all of Europe was under the domination of Hitler. Africa, Latin America, Australia, India, and even parts of China remained accessible to the U.S. The only competitive customer for the mineral exports of these vast areas was the United Kingdom. An agency called the Combined Raw Materials Board was created by the U.S. and the U.K. and a coordinated buying program was launched. It was possible to fight World War II without an actual shortage of these critical materials. But the key was the fact that we retained access to Latin America, to all of Africa, to most of Asia and to Australia. Had we been denied access to them, we would have been in trouble.

After it opened up to the rest of the world in the late 1800s, Japan resolved to become an empire, but it had very few natural resources (Abbott, 1916). The nearest significant coal and iron deposits were in northern China (Manchuria). In the early twentieth century, as an emerging Pacific power, Japan was increasingly in need of raw materials, particularly metals, coal, and oil to equip its military. Japan invaded Manchuria for its deposits of iron and coal, and later southeastern Asia for more raw materials. As the military seized such resources, it also gained materials for Japan’s expanding civilian economy.

If Japan had possessed adequate oil deposits within its own borders, the Japanese probably would not have gone to war with the United States.

However, as the war continued and the United States was gradually able to cut off oil shipments to Japan, the matter of fuel became increasingly desperate for the Japanese. In the waning days of the war, Japan resorted to “kamikaze” (Japanese for “divine wind”) action – suicide pilots who would crash their planes into the ever-closer ships of the U.S. Navy. This was in large part a matter of fuel efficiency, because the planes would be given just enough fuel to fly one way. They were not expected to return and the pilots were told so. More than 4,000 young Japanese men were sacrificed this way. It was a desperate way of stretching fuel supplies. If a plane did hit a U.S. Navy ship, this would be a highly effective use of a small amount of fuel. Some planes did get through the anti-aircraft barrages and did considerable damage, but many more kamikaze planes were shot down. Finally, there was not enough oil to keep either the Japanese navy or air force operational.

Chile and nitrates.  For a long time there was a boundary question between Chile and Bolivia, but no one really cared about the exceedingly desolate northern Atacama Desert territory until nitrates were discovered there in great quantity. These were the causes of the Nitrate War. Chile declared war on both Peru and Bolivia on April 5, 1879. The Chileans were victorious and obtained all of the Atacama Desert area by the Treaty of Ancón in 1883. The victory was of great economic value to Chile. From 1879 to 1889, the duty on nitrate exports alone reached more than $557 million dollars, a very considerable sum in those days. The total value of nitrate exports in that period exceeded $1.4 billion. Nitrates have continued to be an important Chilean export, although the synthetic production of nitrates has reduced their value.

South China Sea. This is a region where oil was recently discovered, and the potential for future modest discoveries is good. The Spratly Islands dot the area and consist of about a hundred coral reefs, tips of rocks, and 21 slightly submerged landforms. The emergent land is less than two-square miles in total. Although these islands are located about 700 miles from China and only 100 miles from the Philippines, China claims a huge swathe of sea that overlaps and conflicts with the claims of other nations. Indeed, ownership in the strategic South China Sea is asserted in whole or in part by nine nation states, mainly China, which claims at least 80 percent, and Vietnam. In 1988, China and Vietnam clashed violently over the Spratly Islands, and in 2012, China and the Philippines are in a tense naval standoff over their competing claims there as well. All nine nations have set up little outposts on different rocks. Despite lacking clear ownership, both Vietnam and China have issued lease blocks to oil companies. In the meantime, oil-short China is building its navy and expanding its presence in the South China Sea. China needs much more oil as it plans to greatly enlarge its road network, increase motor vehicle production, and fuel its rapid industrialization, and transport system.

Many think that water may be the oil of the future relative to resource disputes. If so, nations like Egypt may face critical decisions about military action for its very survival, because nearly all of the water from its lifeblood, the Nile River, originates in other nations which are now building dams. Up from just 28 million people in 1960, Egypt now has 82 million and is expected to have 111 million in 2025, and 124 million in 2050. Clearly, Egypt has some critical times ahead. Thirsty and hungry people become desperate people.

Colombia has an on-going drug war. It is the world’s largest producer of cocaine, 90 percent of which goes to the United States. Oil accounts for a third of Colombia’s export earnings. Drug-running rebels have tried to cut the government’s oil income. Since 1986, they have attacked the country’s major pipelines more than 900 times. In 2001, they put a pipeline out of operation for 266 days, which cost the government nearly $600 million in lost revenue (Renner, 2002).

In the Democratic Republic of the Congo (formerly Zaire), major conflicts between rival groups over very rich deposits of cobalt, tin, copper, molybdenum, and diamonds have resulted in the killing and displacement of several million people. This has given rise to the evocative term “blood diamonds,” which have also helped spark and sustain cruel insurgencies in Angola, Liberia, Sierra Leone, and Ivory Coast.

Russia has been obtaining about 60% of its hard currency from the sale of oil and gas. Without this income, Russia would have a difficult time supplying its military with needed technological equipment such as state-of-the-art computers. Oil and gas earnings also buy grain, something in chronic short supply in Russia. Grain bolsters the civilian economy, but grain also feeds Russia’s large standing armies.

Will the Russia of the future prove to be a friendly neighbor to the western nations, or will it return to its political isolation and antagonism toward the West, using its huge coal, gas, and metal resources as weapons? The Cold War was a time when the Soviet Union was active in economic warfare against the NATO allies in many regions. The reality of Russia’s nearly complete self-sufficiency in minerals and energy minerals compared with other industrial nations will be important in future world affairs. With the largest and broadest energy and mineral resource base of any nation, Russia could do very well economically.

Oil: The United States, China, and Japan. In order, these are the three largest oil-consuming nations in the world, and their economies are vitally dependent on oil at the present time. It is doubtful that alternative energy sources can arrive in quantity or in time to replace diminishing quantities of oil. The result will be an intensified scramble for the remaining world oil reserves, in competition, of course, with all economies that use oil.

How this war for oil resources will be conducted is not entirely clear, but to some degree it is already in progress. All three countries are engaged in a worldwide search for oil, both through their oil companies and also through investments in various operations in oil regions—pipelines, refineries, and others. In the iron-mining region of northeastern Minnesota, for example, Chinese investment has reopened a mine and built a pelletizing plant (to upgrade the low-grade taconite iron ore—only 30 percent iron). They are shipping the product to China. This trend will continue, and the outcome is uncertain as we create a globalized economy. China is the 800-pound gorilla on the scene.

The cheap labor weapon. Economic warfare over the past two decades is also seen taking the place in the area of labor costs. Low-wage countries aided by free trade agreements have been able to transfer the manufacture of many products from industrialized countries, particularly the United States, to their own shores. This has created huge trade imbalances. China, in particular, has a large positive trade balance with the rest of the world, especially the United States.

Armed with U. S. dollars and other foreign currencies, China, and to a lesser extent India, have embarked on a worldwide buying spree to obtain a variety of raw materials. Particular investment targets are Canada for its metal resources; Chile for its metals; Venezuela for its oil; and Australia for its metals, natural gas, and coal. This investment strategy is intensifying, particularly by China as it also reaches into Africa for both metals and oil.

One result of low-wage competition for the United States has been a large decline in its manufacturing base. The increasing deficit in international balance of payments threatens the stability of the dollar. Dollars exported to pay for things previously produced domestically, come back to compete with the United States in the form of buying power of the cheap labor countries who use the dollar to bid against the United States for natural resources worldwide. Thanks to its trade surpluses, China has had a great inflow of dollars to use for worldwide resource acquisition.

War or Reason? Struggles for resources, especially oil, will continue as population pressures grow and resources become increasingly scarce (Tanzier, 1980). Will this worldwide increased demand for energy and minerals, compounded by the current exponential growth in population, be resolved by reason, or will the struggle result in war and anarchy as suggested in the very thought-provoking book by Robert D. Kaplan, The Coming Anarchy (Kaplan, 2000)? Around the world, reason and goodwill are in shorter supply than they should be. By myriad adjustments in lifestyles and economics, the world must adjust to the new realities of resource availability. It is clear that the future cannot supply a continually growing population with resources as we use them now.

Wilderness to World Power. The establishment of a government by a free people, and an open economic system together with a great variety of abundant and easily exploited natural resources, destined the United States to change from a three-million square mile wilderness to the wealthiest and most powerful nation the world had ever seen in less than 300 years. In terms of the total energy minerals and minerals spectrum, the United States was without equal among nations at the time the Declaration of Independence was signed. Also, the millions of acres of fertile soil in the nation’s heartland favored by a good growing season are unmatched in the world.

Part of its good fortune was that the United States was established at the right time. The U.S. emerged as a nation shortly after the Industrial Revolution. It started in Great Britain and promptly spread to Europe, and then to the United States. New inventions and new technologies developed rapidly. The technologies enabled people to extract and process important raw materials like iron ore in great quantities. The invention of the steam engine fostered the development of the railroad, which was able to haul raw materials cheaply and in great quantities to the factories and distribute finished products across the country.

This combination of the right time (during the spread of the Industrial Revolution), together with a poor but ambitious free people, and the right place (three-million square miles of virgin land with a tremendous variety and quantity of mineral resources), was responsible for producing the great economic and military might of the United States in the first three-hundred years of its existence.

Of the three factors, the great variety and abundance of mineral and energy resources was probably the most important. Without these, even a free people would have seen the industrial age largely bypass them, or else arrive much later. But the rich geological endowment of the United States shaped its destiny.

One might suggest that Canada also had the same potential as did the United States, but Canada has somewhat less conveniently deposited mineral resources. It does not have high-grade iron and coal adjacent to the inexpensive Great Lakes transportation system. Little oil was discovered until recently in eastern Canada (which is offshore), whereas there were numerous oil fields in Pennsylvania, Ohio, West Virginia, Kentucky, and Indiana where people first settled and industry was established in the United States. There is no region in Canada comparable to the prolific Gulf Coast region of the United States where the famous Spindletop oil gusher discovery was made in 1901. Canada’s major oil industry really dates only from post-World War II, and, although important, it does not rival the size and wide geographic distribution of oil fields all across the United States. Also, Canada’s northern geographic position with its hostile cold climate and the difficult terrain of lakes, bogs, swamps, and large areas of tundra underlain by permafrost delayed its development except for roughly a two-hundred mile wide strip of land adjacent to the United States.

It may be, however, that the best is yet to come for Canada. The world’s largest deposits of oil sands, for example, will be an asset for many decades to come, and large high-grade iron ore deposits remain to be exploited. The United States has already depleted its high-quality iron deposits as part of the price for its phenomenal economic growth.

Russia would miss one advantage the United States had in its rapid economic rise, a relatively small population compared to large mineral wealth. Today Russia would have to spread its geological wealth over a far greater number of people then the United States had when it rose to its affluent world position. In 1880, as the United States began to reap the advantages of the Industrial Revolution, the population was approximately 50 million. The Russian population today is about 142 million. Large mineral wealth spread over a small population has the potential of raising the standard of living. This has been clearly illustrated in such countries as Saudi Arabia and Kuwait. Russia missed a great opportunity. Now, although it does have mineral wealth, it has more people. And Russian oil production has peaked before the benefits of its oil riches have been enjoyed to any large degree by the average citizen. The United States combined its oil wealth with its world class motor vehicle industry to bring a degree of affluence and lifestyle for the average citizen, that would be difficult if not impossible for Russia to duplicate now.

For many years, the United States was the world’s dominant producer of most vital raw materials. The United States was, until 1982, the world’s largest copper producer. Until about 1950, it produced half the world’s oil. It has been the leader in molybdenum, zinc, and lead output, and it still has the largest recoverable coal reserves in the world. Following the 1859 discovery of oil, the United States was completely self-sufficient in petroleum for more than 100 years. Ultimately it was the possession of large oil resources and U. S. self-sufficiency that brought about the reversal of power between Great Britain and the United States. Until World War I, coal was the dominant energy source, and British coal mines were a major source. After World War I, oil became the major fuel on which the world depended. Britain at that time had no oil production. With the arrival of the oil age, economic power shifted to the United States. One might note that the dependence of the United States on foreign oil has substantially decreased the relative world economic strength of the United States,

By 1909, the United States was producing more oil than the rest of the world combined, and continued to do so through 1950. With the discovery of oil found all across the U.S., and the development of trucks and automobiles, soon a nationwide network of roads and service stations was established. Travel came into vogue, because oil was inexpensive. The average citizen could afford it. Thus the great travel boom arrived and the novel idea of motels spread across the country. The travel industry became an important part of the U. S. economy.

In the early and middle decades of the twentieth century, mineral and energy mineral resources in the U.S. were in seemingly endless supply. The United States provided its allies with vital energy and mineral resources first to win World War I, when it was said that “the Allies floated to victory on a sea of oil.” U.S. oil supplies again played a vital role in World War II. Both Japan and Germany lacked oil. In terms of metals, it has been said that both wars were fought from the great hole in the ground which is the Hull-Rust iron mine on the north side of Hibbing, Minnesota.

With cheap and abundant mineral and energy mineral resources, the United States enjoyed an unprecedented rapid rise to the world’s highest material standard of living and to economic and military pre-eminence.

When considering the future, as compared with the past, it is important to note that the United States achieved its industrial position and its high standard of living on abundant, cheap energy, and rich mineral resources. It took enormous energy to mine and smelt the ores to produce the metals vital to industrial development. It took vast amounts of energy to conquer the frontier and do the work needed to convert a raw wilderness into the world’s largest, most affluent society. During most of the time between 1940 and 1960, the United States enjoyed $3-a-barrel oil, natural gas costing about 15 cents a thousand cubic feet, and coal costing about $4 a ton, all available within the United States. Abundant and inexpensive energy sources and high-grade iron and copper deposits were exceedingly helpful to a young and rapidly growing nation. High-grade metal deposits take less energy to mine and smelt than low-grade deposits do.

The combination of high-grade ores and inexpensive energy combined to provide very inexpensive finished products that fostered economic growth. Conversely, as ore grade decreases, it takes more energy to produce the same amount of metal as previously. Combined with higher energy costs, the result is substantially higher finished product costs.

The United States’ peak of power may have been symbolized by its use of the ultimate energy weapon, the atomic bomb, to end World War II in 1945. At the time, the United States was the sole owner of this fearsome form of energy. It was the possession of a particular metal, uranium, within its borders that allowed the United States to arrive at this zenith of world power. Now this capability is shared by several countries, and the number is growing.

After the breakup of the Soviet Union in the early 1990s, there were those who argued that the United States stood alone as the unrivaled world power. Unlike 1945, however, in the 1990s the United States was no longer self-sufficient in its principal energy need, oil. In fact, it was importing more than half of its supplies, and lacked the ability to reverse the trend. The United States no longer controlled its economic destiny, which was partly in the hand of foreign oil producers. And the continuing imbalance of foreign trade, in which imported oil was the largest single (and growing) factor hurt the prestige and value of the U.S. dollar in world markets.

The United States rose to international economic dominance in record time, but in the process depleted many of its high-grade resources. The rich ores of the Mesabi Iron Range are gone. All the high-grade native copper mines of Upper Michigan are closed. The United States now searches for oil off the frozen north coast of Alaska and in the deep waters of the Gulf of Mexico. The U.S. is no longer nor will it ever be self-sufficient in oil again. Its oil reserves, once the largest in the world, are now dwarfed by those of several other countries. Although it consumes about 25 percent of the world’s oil, the U.S. now contains only about four percent of the estimated conventional proved world oil reserves.

The United States has changed from being an exporter of energy and mineral resources to now being a net importer on an increasingly large scale. In the process, the United States also went from being the world’s largest creditor nation to being the world’s largest debtor nation in less than 20 years. Oil imports now are the single largest item contributing to our annual balance of trade deficit. Other basic commodities are increasingly imported as the U. S. continues to decline in resource self-sufficiency.

The saga of the astonishing rise of the United States to affluence and power will never be duplicated in the world. There are no more virgin continents to exploit. The story of the growth of the United States has been a phenomenon beyond comparison. The question now is: where does it go from here?

ALASKAN OIL

No other oil fields the size of the approximately 12 billion-barrel Prudhoe Bay Field are expected to be discovered in Alaska. About 60 miles to the east of Prudhoe Bay, the geology suggests that perhaps a field or fields not as large as Prudhoe Bay might exist in a small portion of the coastal plain of the Arctic National Wildlife Refuge.

Alaska’s oil revenues are certain to decline in the long run, to the point where there will be little or no such income. If future generations of Alaskans are to be considered, then the abundant but transient oil revenues of today must be used differently. The political process has allowed this generation of Alaskans to capture benefits at the expense of future generations by plundering much of the wealth of its nonrenewable oil resource.

Of the initial 12 billion barrels of oil reserves in the Prudhoe Bay Field, seven billion have been produced. Production has peaked, and is now declining.

INDONESIA

This archipelago is the fourth-most populous nation in the world with 240 million people. Until 2009, it was a member of OPEC. Its oil deposits were developed by Shell Oil Company, which began as a trading company that actually dealt in part in seashells when Indonesia was a Dutch colony. This is how the Shell companies got their start, and they still retain the shell symbol. Indonesia was the prize the Japanese needed to keep their war machine going, and they occupied it for a time during World War II. After the war, Indonesia gained independence from the Netherlands, and continued to be an oil exporter. It has now become a net oil importer, with domestic oil demand now exceeding production.

Military spending by oil-rich countries, principally in the Middle East, has overshadowed all other investments. In the 12 years following the first Arab oil embargo in 1973, with the subsequent huge rise in oil prices and concurrent huge increase in revenues for oil producers, the Gulf nations spent more than $640 billion for military purposes. Iraq and Iran spent billions, which served only to finance an eight-year war of attrition ending in stalemate. An estimated million people were killed and many more were wounded. Without the oil money to finance the advanced weapons of war, it is probable that at least the casualty figures would have been less. What a tragic way to waste forever the proceeds from a non-renewable resource.

Now these countries have the latest state-of-the-art weaponry including all sorts of missiles, tanks, jet fighters, helicopters, warships, and other hardware. But there is a question whether or not these nations are safer or happier with all these devices of destruction. Arms shows in the Middle East have become regular events. It is big business. The judgment of history on the way in which some of the temporary oil riches are being spent is likely to be severe. The government-owned oil industry has been ineffective in using oil wealth for general social improvement.

MEXICAN OIL

Pemex is not run efficiently, and is grossly overstaffed with more than 108,000 employees.  The oil revenues have not been used to raise the Mexican standard of living. Pemex provides the government with 40 percent of its revenues and pays 70 percent of the cost of running the national electric grid. Exactly where the rest of that tax revenue goes is uncertain.

The Cantarell oil field that supplies 62 percent of Mexico’s total production has peaked and is in steep decline.

Just to maintain Mexico’s oil production, the government will have to invest as much as $100 billion in the coming decade. Taxes prevent Pemex from retaining enough of its earnings to finance needed expenditures. Francisco Rojas, who ran Pemex from 1987 to 1994, referred to Pemex’s decaying infrastructure and lack of money for exploration saying, “ … we are looking at a time bomb….”  

In Mexico in 1996, the Democratic Revolutionary Party (PRD) set up blockades at oil installations in the oil field areas of the southeast coast protesting the actions of Pemex, the Mexican government oil monopoly. The PRD said Pemex had contaminated farm land, had not cleaned up oil spills nor raised living standards as promised, but had diverted its oil money to political ends and into politicians’ pockets. Mexico is another example of how oil may prove to be a destabilizing influence on a country. The national oil company, Pemex, provides 40 percent of government income but production has dropped 30 percent from its peak in 2004. In 2009, there was a substantial cut in government employment (10,000 workers), increased personal and corporate income taxes ($13 billion), and reduced subsidies for things such as electric power. The country was living on a diminishing resource, and now “It’s crunch time in Mexico” (Smith, 2009). How this increased austerity will affect Mexican social and economic structures is not yet clear, but it will surely do so as it will in all countries dependent on income from nonrenewable resources.

NIGERIAN OIL

This is the largest African nation in terms of population, with 162 million people and a growth rate projected to increase its population to 237 million by 2025, and 437 million by 2050 (Population Reference Bureau, 2011). Nigeria remains beset with problems. It is rated as one of the most corrupt regimes in the world. Lack of civil control has reached the point that Shell Oil Company says it may not be able to continue operations there because of the ongoing sabotage of equipment. With corruption, lack of civil order, growing religion-based terrorism, a fast-growing population – already the largest of any African nation — the future for Nigeria is dim. A jihadist terrorist organization — Boko Haram — whose name translates from the Hausa language to “Western education is sacrilege,” and which began attacking Christian targets in 2010, is only the latest threat to Nigeria’s fragile stability. Oil revenues surely have not been used as wisely as they might have. Nigeria has about 37-billion barrels of oil reserves. And if civil order can be maintained, there are fair prospects for additional discoveries. But Nigerians themselves lack the ability to conduct oil operations, so foreign technology and investments are required. The country’s production is expected to peak about now.

When the day arrives that Nigeria is not oil rich, it may revert back to the bloody civil wars that marked the country 30 years ago. Today, even with oil riches, or perhaps because of them, corruption and civil unrest continue to plague Nigeria.

NORWEGIAN OIL

About 2% of Norway’s land is arable. There is not a drop of oil in Norway’s largely igneous rock terrain. Norway has always had to live in considerable part from the sea. Norway has used a lot of their oil revenues to keep unemployment low. Billions of dollars of petroleum revenues have been poured into what turned out to be money-losing projects in agriculture, iron mining, smelters, and fishing in order to keep people employed. This is a temporary fit, and does not build a sound economic base for the long term. Norway’s oil reserves are about 5.3 billion barrels. Production peaked in 2001 and is now in decline. The resulting decline in oil revenue will be a problem, but not so much as in countries with a high population growth rate. Norway’s population of 5.0 million has a very low growth rate of about 0.4 percent annually bringing its projected expected population to 5.6 million in 2025 and 6.6 million by 2050.

VENEZUELAN OIL

In spite of Venezuela’s rapid population growth and associated social needs, President Hugo Chavez purchased seven Russian MIGs, and a fleet of Russian attack helicopters in 2004. In 2005, he bought 100,000 Russian AK-47 rifles. Flush with the money from high oil prices, President Chavez spent over four billion dollars (equivalent) in 2005 and 2006 buying additional military equipment, making Venezuela the most heavily armed country in Latin America. Since 2005, Venezuela has signed contracts with Russia for 24 Sukhoi fighter jets, 50 transport and attack helicopters, and 100,000 more assault rifles. Venezuela also has plans to open Latin America’s first Kalashnikov factory to produce rifles in the city of Maracay.

In Venezuela in 1989, there may have been a preview of what could happen more widely when income from a depletable resource, such as petroleum or metals, declines. Oil income began to falter. The government had to change its free-spending ways that were based on abundant oil income from 1974 to 1979, when oil prices moved up very rapidly. It started budget cutting as oil prices declined. When subsidized bus fares were raised along with previously cheap gasoline prices, riots erupted in Caracas and 17 other cities. More than 300 persons were killed, 2,000 were injured, and several thousand arrested. The government had to rescind the increases. When the price of oil dropped in 2008 from $147 a barrel to less than $60, Venezuela’s oil-dependent economy was severely affected.

Venezuelan President Hugo Chavez began running into problems. In 2005, Venezuela’s oil production declined to 2.2 million barrels a day from its peak of approximately 3.7 million barrels a day several years earlier. To maintain support for his regime, President Chavez diverted more and more of the national oil income to financing growth in social programs so there was not enough capital left in the industry to keep oil production stable, much less increase it.

Venezuela’s social structure, in a country with a growing number of poor, is under severe strain. Recognizing the need to help the poor is commendable. As noted elsewhere, this diverts money needed to maintain oil production, so population and population growth are in conflict with preserving the resource that supports it. A smaller population would help considerably. But Venezuela’s population is 29 million and is projected to reach 35.4 million in 2025, and 42 million by 2050. Oil production and the income from it cannot possibly be increased proportionately. As in other oil-rich nations, oil revenues in Venezuela have not kept pace with the growth in population and the related growth in the costs of the social services created in earlier, more affluent oil income years.

Venezuela’s situation with its 29 million people and daily oil production of 2.2 million barrels, can be contrasted to Saudi Arabia with 28 million people and daily production of more than nine million barrels. Saudi oil is also higher quality and brings a better price than Venezuelan heavy crude. So Venezuela, with a slightly larger population, is on an oilincome diet less than one-fourth that of Saudi Arabia. Both countries are almost totally dependent on oil income for foreign exchange.

GEOTHERMAL ENERGY

The world’s largest geothermal electric generating plant is located at The Geysers, about 70 miles north of San Francisco. Electricity was first produced there in 1960. More than 2,200 megawatts was eventually being generated, the equivalent of two large dams, and enough to supply the electric power needs of about one and one-half million people. However, the field was apparently over-drilled, and production eventually fell to about 1100 megawatts. When geothermal energy is used for electric power generation, it is nonrenewable because eventually the reservoirs of steam and/or hot water will be depleted to the point where they are no longer capable of sustaining

electric power generation. The time to depletion is variously estimated to range from 40 to 100 years in most geothermal electric power fields. However, after being shut down over a period of many hundreds or perhaps thousands of years, the field will recover and could be used again, because the heat will still be there. It is only the hydro system that gathers the heat from fractured hot rocks and brings it to the well bore that becomes exhausted.

For this reason, geothermal energy used for electric power generation in a practical sense does not appear to be a renewable resource. There is, however, technology being tested which may modify this conclusion. In some geothermal fields, waste water is being injected back into the reservoir to see if the reservoir level and pressure can be maintained without reducing the temperature. At The Geysers field in northern California, a 65-kilometer pipeline was recently completed bringing waste water north from Santa Rosa for injection into the geothermal field. An earlier project brought water from a lake that resulted in a recovery of 68 megawatts of power and slowed the area’s pressure decline. If this technology continues to be successful, it can materially extend the life of geothermal electric generating fields. With proper management, it could make geothermal electric power a sustainable energy resource.

Worldwide geothermal electric power. Currently the installed capacity of geothermal-powered electric generating plants totals more than 10,000 megawatts. This is the equivalent of about seven to nine conventional coal-fired plants. Leading countries, in declining order, are the United States (2,685 MW); Philippines (1,970 MW); Indonesia (992 MW); Mexico (953 MW); Italy (810 MW); Japan (535 MW); New Zealand (472 MW); and Iceland (421 MW).

Renewable for space heating? When used for space heating, hot water usage can be controlled to be kept in balance with the natural recharge of the hydro system which brings the heat from the permeable hot rocks to the well bore. In this case, geothermal energy is a renewable resource. Thus, depending on its end use, geothermal energy can be thought of either as renewable or non-renewable. Even when used for space heating, the geothermal reservoir can become depleted if it is over-used. This seems to be the case in several of the district heating systems in southern Idaho, and at Klamath Falls, Oregon, where studies of this problem are under way. However, using geothermal water for space heating is its most efficient use and it should be pursued. The efficiency stems from the fact that there is no change from one energy form to another. When geothermal water is used to generate electric power, heat energy is changed to mechanical energy and then to electrical energy. Any change in energy form results in an energy loss (second law of thermodynamics).

The lower-temperature waters that can be used for space heating are far more abundant and widespread than the high-temperature waters required for efficient electric power generation. Even where there is no especially warm water to use, the general heat flow of the Earth can be tapped by using groundwater heat pumps, which are efficient in most temperate areas, and better in some places than standard air-to-air heat pumps.

Use of Earth’s natural heat flow It is feasible, particularly in a hilly setting, to build a split-level house with part of it below ground level. In colder countries, in particular, the natural heat flow of the Earth will add to the warmth of the house in the winter. Because it is a steady temperature, it also can have a cooling effect in the summer. Such an arrangement is a natural air conditioner. Some houses are built almost entirely underground. Whereas this requires more power for lighting, there is a net reduction in power use because both heating and cooling take far more energy than lighting does. It is also land efficient in cases where people grow gardens on the roofs of such dwellings. By using the natural heat flow of the Earth in this fashion, geothermal energy is renewable,

BIOMASS & WOOD

The exploitation of wood and other biomass is removing vegetation in many areas beyond the replacement rate, causing large and fatal landslides, devastating floods (as in Bangladesh, 1988), and widespread erosion and loss of valuable topsoil (Pimentel and Krummel, 1987

In Haiti, which was once nearly all forested, only two percent of the land is now, because the demand for charcoal, an important fuel for cooking and household use, far exceeds the reforestation rate

In the countryside around Bogota, Colombia, the highlands of Peru, and throughout much of India, Pakistan, Bangladesh, Nepal, and other parts of Asia including China, in Central America (Guatemala, Mexico, Honduras), and especially in Africa there is a serious firewood supply problem. Depleting forests and brushy groundcover has harmed the soil, both by erosion and from the loss of biomass important to soil health. It is doubtful that the use of wood for fuel can be significantly expanded. In many regions, the forests need to grow back to prevent further erosion and floods, which are already severe. Loss of trees and vegetation is a particular problem in the foothills of the Himalayas where forests once regulated the gradual run-off of water. That has been changed by deforestation and now great floods occur in the lowlands to the south, especially in the densely populated lowlands of Bangladesh. In both India and Bangladesh, deforestation has also resulted in eroded soil filling reservoirs far faster than was projected for dam sites.

Wood is still a useful local fuel for cooking and heating. Some utility companies use wood in small amounts for power generation. However, the woodlands of the world are so important to the health of the environment for preventing erosion, as a sink for carbon dioxide, and in countless other ways that they cannot be used as a sustainable fuel supply in any significant amount.

Ethanol

Dr. T. Stauffer, a research associate at Harvard, said, “The bottom line is that using alcohol to stretch gasoline is like using filet mignon to stretch hamburger.

“Renewable power and fuels will be more expensive than the dirtier sort for the ‘foreseeable future.’ This leaves the clean-energy business largely dependent on government handouts.” (The Economist, 2007).

Although ethanol is commonly thought of as a farm product, it is largely a product of the energy inputs noted, and the oil-based pesticides and fertilizers used to enhance the growing. This fact is conveniently ignored by politicians and others who endorse ethanol as an alternative to gasoline at the same time they berate the oil industry that provides the basis for modern agriculture, including corn production.

Consumer Reports (October, 2006) weighed in on the ethanol issue with a cover article The Ethanol Myth pointing out that because of the lower-energy content of ethanol (27 percent less than gasoline) ethanol may not save as much energy as claimed, and that it greatly reduces the mileage range of cars. In one test case, it reduced car mileage from 450 miles to 300 miles per tank of fuel.

Pimentel and Patzek (2005) estimate that if the entire U.S. corn crop were used to make ethanol, “ … it would replace only 6% of fossil fuel used in the U.S. And because the country has lost over a third of its agricultural topsoil, no large increase in the corn crop is possible.” Pimentel and Patzek (2005) further write: Moreover, the environmental impacts of corn ethanol are enormous. They include severe soil erosion, heavy use of nitrogen fertilizer and pesticides, and a significant contribution to global warming. In addition, each gallon of ethanol requires 1700 gallons of water (mostly to grow corn) and produces 6 to 12 gallons of noxious organic effluent.

Using food crops such as corn to produce ethanol also raises major ethical concerns. More than 3.7 billion humans in the world are currently undernourished, so the need for grains and other foods is critical. Growing crops to provide fuel squanders resources; better options to reduce our dependence on oil are available. Energy conservation and development of renewable energy sources, such as solar cells and solar-based methanol synthesis, should be given priority.

In terms of gasoline, Smil (2010) estimates that if the entire U.S. corn crop was converted to that use, it would produce an equivalent of less than 15 percent of current U.S. annual consumption.

The impossibility of using methanol as a replacement for oil in the United States is summarized by Pimentel: “If methanol from biomass (33 quads) were used as a substitute for oil in the United States, from 250 to 430 million hectares of land would be needed to supply the raw material. This land area is greater than the 162 million hectares of U.S. cropland now in production” (Pimentel, 1995).  

Biodiesel also has limitations beyond either gasoline or ethanol. The Minnesota Legislature passed a law in 2005 requiring diesel sold in that state to contain 2% biodiesel. This worked fine in the summer, but given the nature of the Minnesota winters, it turned out that even 2% biodiesel in the fuel would congeal and plug the fuel line in cold weather. This aroused the ire of the truck drivers, and the law was temporarily suspended. “It’s not like they weren’t warned” said C. Fords Runge, a University of Minnesota economist who prepared a biodiesel study in 2001 on behalf of a Minnesota trucker trade group (Meyers, 2005). Others had cautioned that there would be problems. “I’d stop short of saying, ‘Ha, I told you so,” said Russell Sheaffer, Vice President of Cummins Power, a regional distributor of Cummins [diesel] engines (Meyers, 2005). B100 (100 percent biodiesel) is not recommended for use in temperatures below 40 F. Decreasing temperatures below 40 F require that increasing amounts of petroleum-derived diesel be blended into the fuel because petroleum-derived diesel does not have such temperature limitations.

LOSS OF SOIL

Overall, one-third of the topsoil of U.S. cropland has been lost over the past 200 years. Worldwide, degradation of agricultural land is causing irreversible loss of an estimated area of six million hectares (nearly 15 million acres) annually. Soil is being lost from land areas 10 to 40 times faster than the rate of soil renewal, endangering future human food security.

ENDLESS GROWTH ON A FINITE PLANET

The concept of sustainable growth is analogous to the concept of perpetual motion — both happy illusions that are detached from reality. The former ignores limitations of a finite Earth, and the latter ignores the second law of thermodynamics.

Growth in population creates a tremendous impediment to any program to solve the world’s energy problem. The nearly 80 million people being added each year to world population is more than the combined population of The Netherlands and France.

“The gain in realistic energy conservation efforts would be nullified within a decade by population growth.” Keep this statement in mind whenever a serious discussion of energy problems comes up. It is almost always overlooked.

The terms “smart growth” or “managed growth” seems to make people feel better, and they believe the problem of growth is being solved. But growth is growth by whatever name it is called. Smart or managed growth is analogous to moving the deck chairs on the Titanic closer together, and finally stacking them on top of one another. This simply results in the ship going down in a more organized manner than it would otherwise.

Herman Daly is one of few economists who understands the limits of a finite Earth. As early as 1987, in “The Steady-State Economy: Alternative to Growthmania” he related his concerns about “growthmania” and the ecosystem with the observations: The economy grows in physical scale but the ecosystem does not…. Standard economics does not ask how large the economy should be relative to the ecosystem, but this is the main question posed by steady-state economics…. Standard economics…is indifferent to the scale of aggregate resource use. In fact, it promotes an ever-expanding scale of resource use in appealing to growth as the cure for all economic and social ills…steady-state economics stresses the optimum scale of resource use relative to the ecosystem.

“Growthmania” (In growth we trust.) is the current guiding creed of both industry and government and of both main political parties in the U.S.. Chambers of commerce enthusiastically and unanimously promote it. This century will show it to be a false pursuit, even a delusion.

Abernethy (1993) makes the important observation that the carrying capacity of a region is not constant: Life support systems deteriorate from overuse and are less able to support life. This means that overpopulation in one period decreases the future number of people who can be maintained without aggravating the damage. The carrying capacity does not remain constant. It shrinks.

 Nor is the solution recycling because 100% recovery cannot be achieved. Some is inevitably lost in the process. Furthermore, to recycle materials requires energy.

One of the most difficult problems is how to stabilize population size, and at what level? The issue of population size is frequently ignored, and when it is considered, it is treated very cautiously because it involves delicate cultural, religious, and racial matters. But some population size must be assumed to rationally describe what resources and technologies would be required to sustain humans indefinitely.

Pimentel and Pimentel (1979) and others at Cornell University have made perhaps the most comprehensive and quantitative study of “sustainability,” relating it to the two most vital parts of our resource base — soil and water. “For erosion under agricultural conditions, we should be losing less than 1 ton per hectare per year for sustainable farming. For groundwater resources, we should be pumping no more than 0.1 percent of the total aquifer for use.” But, we rarely manage these two vital resources based on these criteria. Pimentel et al. (1994), have suggested a figure of about two billion as the sustainable population of the Earth, and about 100 million for the United States.

The term “sustainable development” is commonly used with optimism that implies the growth trends we now experience can really be indefinitely sustained. Economists, in particular, are very fond of it. So are real estate developers and chambers of commerce. To meet objections about the continuing growth of various projects, the term “smart growth” has been invented and is widely used.

However, as Bartlett (1997a) pointed out: “The claim is made that growth management will save the environment. Whether the growth is smart or dumb, the growth destroys the environment.

Problems relating to “sustainability” come in many forms. Land use and food production are important issues. From 1980 to 2002, the U.S. per capita agricultural land declined from 1.5 acres to one acre. At the same time, population increased by 60 million. For the first time, the United States became a net importer of agricultural products (Hartmann, 2006).

In the U.S., cities occupy only 3% percent of the land area, but 26% of the best agricultural land.

We talk about energy conservation as a way to balance demand and supply. But, the goal is constantly overwhelmed by population growth. California is a good example. “Per capita energy use dropped 5% between 1979 and 1999. However, during that same 20 years the state’s population grew 43% largely as a result of immigration” (Hartmann, 2006). In spite of the per capita reduction in energy use (conservation), the amount of energy used in California increased by 93%.

As the British writer, Bligh, has stated: “Contraception is so much kinder than starvation and genocide.

Professor James Duguid (2004) from Scotland has made this observation on individual nation sustainability: The guiding ethical principle should be that each nation should live within the resources of its own country, with only such trade in surpluses as is beneficial to all. None should depend on foreign aid, on large imports, on exporting surplus people, or in otherwise appropriating the biocapacity of other countries.

In their book, The Lessons of History (1968), Will and Ariel Durant wrote: “In the last 3,421 years of recorded history only 268 have seen no war … . The causes of war are the same as the causes of competition among individuals: acquisitiveness, pugnacity, and pride, the desire for food, land, materials, fuels, mastery

Many people now living will see the year 2050. The twentieth and twenty-first centuries, in their beginning and ending, will be vastly different from any other back-to-back centuries the world has seen, or probably ever will see. Just as those alive in 1900 could not have foreseen the changes that occurred in the next 50 years, we cannot foresee the changes that will occur in the next 50 years. But it is safe to say that energy and population will be among the most prominent things to change. Perhaps the most difficult thing to visualize is what sort of social structures will arise in response to the new resource and energy paradigm. What we do know is the changes are likely to be profound. Because increasing depletion is a new paradigm, history offers no guidance on the future.

Miscellaneous

Some cities have efficient sewer systems, some do not. Forty percent of world population has no access to sewers, and millions of gallons of raw sewage are put daily into the remaining already degraded wetlands and rivers, sometimes called the Earth’s kidneys. They can no longer absorb it all. The scale of this universal human pollution problem is beginning to grow beyond what nature can effectively recycle back into the environment (George, 2008).

The rapid rise in jet fuel and gasoline prices during 2004-2007 in the U.S. was exacerbated by hurricanes damaging and destroying offshore drilling and production platforms and by reduced refinery output.

Asphalt paves 94 percent of the roads in the United States.  This is a total of about four million miles, and is the basis of our entire ground transport infrastructure, except for railroads.

The pre-colonial famines of Europe raised the question: ‘What would happen when the planet’s supply of arable land ran out?’ We have a clear answer. In about 1960 expansion hit its limits and the supply of unfarmed, arable lands came to an end. There was nothing left to plow. What happened was that grain yields tripled. The accepted term for this strange turn of events is the green revolution, though it would be more properly labeled the amber revolution, because it applied exclusively to grains — wheat, rice, and corn. Plant breeders tinkered with the architecture of these three grains so that they could be hyper charged with irrigation water and chemical fertilizers, especially nitrogen…. This innovation meshed nicely with the increased ‘efficiency’ of the industrialized factory-farm system [powered with fossil fuel]…. The way in which the green revolution raised that grain [production] contributed hugely to the population boom, and it is the weight of the population that leaves humanity in its present untenable position…. All together the food-processing industry in the United States uses about ten calories of fossil-fuel energy for every calorie of food it produces.

WIND POWER devices are unsightly, noisy, kill birds, and like solar collectors, deteriorate and have to be replaced with more materials mined from the Earth. Both wind farms and solar farms need access roads to service the equipment and the motor vehicles to do it. In brief, “there is no free lunch” in the use of any alternative energy source with respect to the environment. All have an impact.

Posted in Energy Books, Walter Youngquist | Tagged , , , , | 5 Comments

Kurt Andersen: “Evil Geniuses” & wealth

Preface.  This is a well-written book with original insights into the economic, cultural, and politics behind how we got to a right-wing wannabe fascist incredibly unfair distribution of wealth. 

But Andersen is unaware that energy, not money, is the basis of our civilization.  Oil production peaked in the U.S. decades ago, and is a large part of why wealth for most people declined and factories moved to China and other nations that not only had cheap labor, but cheap coal and oil.  And that the reason new stuff didn’t keep appearing has to do with the limits of what is possible given physics and the Laws of the Universe. We aren’t going to venture to other planets, let alone galaxies: we used up the fossil fuels need to get there.  Nor will there ever be an AI robot as smart or smarter than we are, because that would require hundreds of trillions of lines of code with 20 trillion errors to fix. I was once a software engineer, even one bad line of code means coming in at 3 AM (Kasan, P. 2011. A.I. Gone awry: the future quest for artificial intelligence. Skeptic).

Since energy wasn’t taken into account, and because I’ve read hundreds of books on economics and politics, many of them at https://energyskeptic.com/category/books/book-list/, I skimmed most of the book, and extracted a few bits I thought were interesting below, so it will be disjointed and not flow as it does in the book itself.  Better than this book is “Fantasyland: How America Went Haywire: A 500-Year History” which brilliantly explains why Americans are so nutty and irrational and very fun to read as well.

Alice Friedemann www.energyskeptic.com  author of “When Trucks Stop Running: Energy and the Future of Transportation”, 2015, Springer, Barriers to Making Algal Biofuels, and “Crunch! Whole Grain Artisan Chips and Crackers”. Podcasts: Collapse Chronicles, Derrick Jensen, Practical Prepping, KunstlerCast 253, KunstlerCast278, Peak Prosperity , XX2 report

* * *

Kurt Andersen. 2020. Evil Geniuses: The Unmaking of America: A Recent History. Random House.

Colbert joked on the first episode of his old nightly show, America had become increasingly “divided between those who think with their head and those who know with their heart.

Belief in every sort of make-believe had spun out of control—in religion, science, politics, and lifestyle, all of them merging with entertainment in what I called the fantasy-industrial complex.

Evil Geniuses chronicles the quite deliberate reengineering of our economy and society since the 1960s by a highly rational confederacy of the rich, the right, and big business.

The annual revenues of Goldman Sachs were greater than the annual economic output of two-thirds of the countries on Earth—a treasure chest from which the firm was disbursing the equivalent of $69 million to its CEO and an average of $800,000 apiece to everybody else at the place.

This was 2006, before Wall Street started teetering, before the financial crash, before the Great Recession. The amazing real estate bubble had not yet popped, and the economy was still apparently rocking.

It wasn’t the way things had worked in the modern age, for a century or two. In the past, certainly in my lifetime and that of my parents and grandparents, over any given 20-year period, whenever you glanced back, you’d notice how culture and what was deemed current changed unmistakably from top to bottom. Since the dawn of the modern, ordinary people could date cultural artifacts and ephemera of the recent past and previous eras. During the 20th century, each decade had its own signature look and feel.

Starting in the 1990s, that unstoppable flow of modernity—the distinctly new continuously appearing and making styles seem old—somehow slowed and nearly stopped. The dramatic new change in the culture seemed to be that things were no longer dramatically changing. The shortest and simplest answer is that a massive counterreaction to multiple overwhelming waves of newness on multiple fronts, one after another, sent all sorts of Americans, for all sorts of different reasons, to seek the reassurance of familiarity and continuity wherever they could manage to find or fake it.

The first wave was in the 1960s, a decade in which everything seemed relentlessly new new new. Which for several years felt exciting and good to most Americans, and the novelty glut seemed under control by the forces of reason and order. But then came the upheavals of the second half of the 1960s, when society and culture changed startlingly in just a few dozen months. In the early 1970s, exhausted by that flux, still processing the discombobulating changes concerning gender and race and sex and other norms, people all at once started looking fondly back in time at the real and imaginary good old days.

Hollywood revived and celebrated the recent past in a big way, right away, with nostalgia-fests like American Graffiti, Happy Days, and Grease.

The political right rode in on that floodtide of nostalgia, and then, ironically, the old-time every-man-for-himself political economy they reinstalled, less fair and less secure, drove people deeper into their various nostalgic havens for solace.

This new fixation of the culture on the old and the familiar didn’t subside. It became a fixed backward gaze. Then almost without a pause came another wave of disruption and uncertainty, caused by the digital technologies that revolutionized the ways people earned livings and lived, and which made economic life for most people even more insecure. And the culture in turn focused even more compulsively on recycling and rebooting familiar styles and fashions and music and movies and shows.

In 40 years, the share of wealth owned by our richest 1% has doubled, the collective net worth of the bottom half has dropped almost to zero, the median weekly pay for a full-time worker has increased by just 0.1% a year, only the incomes of the top 10% have grown in sync with the economy,

Americans’ boats stopped rising together; most of the boats stopped rising at all. But along with economic inequality reverting to the levels of a century ago and earlier, so has economic insecurity, as well as the corrupting political power of big business and the rich, oligarchy, while economic immobility is almost certainly worse than it’s ever been.

The proliferation of conspiracy theories since the 1960s, so many so preposterous, had the unfortunate effect of making reasonable people ignore real plots in plain sight. Likewise, the good reflex to search for and focus on the complexities and nuances of any story, on grays rather than simple whites and blacks, can tend to blind us to some plain dark truths.

I still resist reducing messy political and economic reality to catchphrases like “vast right-wing conspiracy” and “the system is rigged,” but I discovered that in this case the blunt shorthand is essentially correct.

The reengineering was helped along because the masterminds of the economic right brilliantly used the madly proliferating nostalgia. By dressing up their mean new rich-get-richer system in old-time patriotic drag. By portraying low taxes on the rich and unregulated business and weak unions and a weak federal government as the only ways back to some kind of rugged, frontiersy, stronger, better America. And by choosing as their front man a winsome 1950s actor in a cowboy hat, the very embodiment of a certain flavor of American nostalgia.

Of course, Ronald Reagan didn’t cheerfully announce in 1980 that if Americans elected him, private profit and market values would override all other American values; that as the economy grew nobody but the well-to-do would share in the additional bounty; that many millions of middle-class jobs and careers would vanish, along with fixed private pensions and reliable healthcare; that a college degree would simultaneously become unaffordable and almost essential to earning a good income; that enforcement of antimonopoly laws would end; that meaningful control of political contributions by big business and the rich would be declared unconstitutional; that Washington lobbying would increase by 1,000 percent; that our revived and practically religious deference to business would enable a bizarre American denial of climate science and absolute refusal to treat the climate crisis as a crisis; that after doubling the share of the nation’s income that it took for itself, a deregulated Wall Street would nearly bring down the financial system, ravage the economy, and pay no price for its recklessness; and that the federal government he’d committed to discrediting and undermining would thus be especially ill-equipped to deal with a pandemic and its consequences.

We didn’t pay close enough attention to the fine print and possible downsides. Living in the world actually realized by Reaganism, our political economy remade by big business and the wealthy to maximize the wealth and power of big business and the well-to-do at the expense of everyone else. We were hoodwinked, and we hoodwinked ourselves.

Our wholesale national plunge into nostalgia in the 1970s and afterward was an important part of how we got on the road toward extreme insecurity and inequality, to American economic life more like the era of plutocrats and robber barons of the 1870s.

Unlike longing for a fairer economy of the kind we used to have, which would require a collective decision to bring back, the itch of cultural and social nostalgia is easy for individuals to scratch and keep scratching. So for many Americans, who spent several decades losing their taste for the culturally new and/or getting screwed by a new political economy based on new technology, fantasies about restoring the past have turned pathological. Thus the angriest organized resistance to the new, the nostalgias driving the upsurge of racism and sexism and nativism—which gave us a president who seemed excitingly new because he asserted an impossible dream of restoring the nastily, brutishly old. The recent wave of politicized nostalgia is global, of course, taking over governments from Britain to Russia to India. But those countries at least have the excuse of being ancient.

Earlier I called the rich right and big business and libertarian ideologues highly rational. Selfishness is rational up to a point, even extreme and cruel selfishness, and this elite confederacy won its war by means of cold-blooded rationality. On the other hand, their increasingly essential political allies in this project are among the most irrational, emotional, unreasonable, and confused Americans of all—religious nuts, gun nuts, conspiracy nuts, science-denying nuts, lying-blond-madman-worshiping nuts.

Fantasyland’s magical thinking and conspiracism and mistrust of science fueled the widespread denial of and indifference to the crisis, and fused with the evil geniuses’ immediate, cold-blooded certainty that a rapid restoration of business-as-usual must take precedence over saving economically useless Americans’ lives.

Even before the pandemic and its economic consequences, and before the protests and chaos following the murder of George Floyd, we were facing a do-or-die national test comparable to the big ones we passed in each of the three previous centuries—in the 1930s, the 1850s and ’60s, and the 1770s and ’80s. Forgive the Hero’s Journey talk, but this is America’s Fourth Testing.

We can, in other words, fail to change what needs changing—and thereby guarantee America’s continued decline and fall.

Our forefathers created a nostalgia industry that fictionalized our recent past, turning Daniel Boone and Buffalo Bill Cody into living celebrity-hero artifacts and reenactors of the frontier days, Walden was driven by Henry David Thoreau’s nostalgia for the era of his childhood in the 1820s and ’30s, before railroads and the telegraph, and his dreamy wish “not to live in this restless, nervous, bustling, trivial Nineteenth Century.

America’s tragic flaw is our systemic racism, and it’s a residue of a terrible decision our founders made to resist the new and perpetuate the old: the enslavement of black people. Slavery had ended in most of Europe by the 1500s, but not in its colonies in the New World and elsewhere. France and Spain and Britain outlawed their slave trades and slavery itself decades before the United States did, and they found it unnecessary to fight civil wars over the issue. Tsarist Russia emancipated its serfs before democratic America emancipated its slaves. On abolition we were not early adopters.

White Southern nostalgia was also for the fictional feudal pasts depicted in the novels of Walter Scott, set in ye olde England and Scotland, published in the 1820s and ’30s, and particularly, phenomenally popular in the American South because the fictions served to romanticize their own slave-based neofeudalism. Mark Twain blamed secession and the Civil War on such Southern “love [of] sham chivalries of a brainless and worthless long-vanished society.

We almost only talk about “checks and balances” concerning Washington politics, presidents versus Congress versus the federal courts. But economies—especially modern free-market economies, loosely supervised day to day, operating mostly without government commanders-and-controllers—also need systems of checks and balances.

Nobody but the Rich (and Nearly Rich) Got Richer: 27 Ways the Pie Is Cut Differently Now

Tax Bonanzas for Rich People

  • In 1980 income above $700,000 (in today’s dollars) was taxed at 70 percent by the federal government, but today the top rate is 37 percent. And the richest Americans, who back in the day paid an average of 51 percent in federal, state, and local income taxes combined, now pay just 33 percent.
  • The richest 0.01 percent of Americans, the one in ten thousand families worth an average of $500 million, pay an effective federal income tax rate half what it was in the 1970s.
  • Profits from selling stocks (almost all of which go to rich people) are generally taxed at 20 percent, about half the rate they were taxed in the late 1970s.
  • Stock dividends (half of which go to the richest 1 percent) used to be taxed like salary income, but in 2003 they began getting special treatment—and today the tax on dividend income for the rich is 22 percent, instead of the normal income tax rate of 37 percent.
  • In 1976 one in twelve American heirs—basically anyone inheriting the equivalent of $1 million or more—paid federal estate taxes, and the maximum rate on the largest of those estates was 77 percent. Heirs today get the first $11 million tax-free, and the tax on everything above that is just 40 percent. In 1976 taxes were paid on the estates of the 139,000 richest Americans who died; these days fewer than 2,000 estates each year get taxed at all.

Bonanzas for Big Business

During the 1980s, the amount of corporate income tax paid as a fraction of the whole U.S. economy was cut by more than half, and in the years since, that fraction has been kept at half what it was before 1980.

Since 2000, corporate profits as a fraction of the economy have been 50 or 100 percent higher than they’d been for the previous five decades.

The Rich Are Different: Income

  • Before 1980, all Americans’ incomes grew at the same basic rate as the overall economy. Since 1980, the only people whose incomes have increased at that rate are people with household incomes in the range today of $180,000 to $450,000. People with incomes higher than that, the top 1 percent, have gotten increases much bigger than overall economic growth. (Meanwhile 90 percent of Americans have done worse than the economy overall.)
  • Since 2000, the salaries of the extremely well-paid ($150,000 or more) have increased twice as fast as the salaries of the well-paid ($100,000 to $150,000). Since 1980, the income of the wealthiest 1 percent of Americans has almost tripled.
  • During the 1990s and 2000s, most of the increase in Americans’ income went to the richest 1 percent—and in the years just before and after the Great Recession, they got 95 percent of the income increases.
  • The share of all income going to the ultra-rich—families making $9 million or more per year—is now 5 percent of the total, ten times what it was in the 1970s.
  • During the 2010s, the majority of all personal income in America went to just the top 10 percent, people with household incomes higher than $180,000.

The Rich Are Different: Wealth

  • Of all the stocks and bonds and mutual funds and houses and cars and boats and art and everything else that counts as wealth, the richest fifth of Americans, people with a net worth of about $500,000 or more, now own about four-fifths of it, a much larger share than they owned before the 1980s.
  • The unambiguously rich 1 percent—the million and a half households with a net worth of roughly $10 million or more—own 39 percent of all the wealth, almost twice as large a share as they had in 1980. Since the late 1980s, that wealthiest 1 percent have become $21 trillion wealthier, an average increase of about $12 million per household.
  • That top 1 percent own an even larger share of all the stock owned by Americans—56 percent, a quarter more of the total than they had in the late 1980s.
  • Of the wealth owned by the top 1 percent, more than half is owned by just the richest tenth of them. That is, the top 0.1 percent, one in a thousand American families, worth an average of $100 million apiece, own 22 percent of all the wealth—a share more than three times larger than it was in the 1970s.

Survivors and Losers: Income

  • During the grand decades between World War II and 1980, when U.S. median household income more than doubled, 70 percent of all increases in Americans’ income went to the bottom 90 percent. Since 1980, nobody’s income has doubled except for the richest 1 percent, and the incomes of the entire nonrich 90 percent of Americans have gone up by only one-quarter.
  • The average monthly Social Security retirement benefit more than tripled from 1950 to 1980, adjusted for inflation, but it has increased by just half in the four decades since.
  • During the last forty years, the median weekly pay for Americans working full time has increased by an average of just one-tenth of one percent a year—and for men has actually gone down 4 percent.
  • For the four-fifths of all private sector workers who don’t boss anybody, the average wage today is $23.70 an hour. In 1973, it was $24.29.
  • Forty years ago, a typical high school graduate working full time could earn an income of twice the poverty level, the equivalent of $56,000, enough to support a spouse and two children. Today the four in ten adults who have no more than a high school diploma and work full time earn a median salary of $39,000.
  • In 1980, 20 percent of all income went to the less prosperous half of Americans; by 2012, that share had shrunk to 12 percent.
  • In the 1980s the comfortably middle and upper middle class, the two-fifths of Americans with household incomes that put them below the wealthy top tenth but above the bottom half, earned 37 percent of all the income—almost exactly what their share would be in a perfectly equal society. By 2014, that share had shrunk to 27 percent.

Survivors and Losers: Wealth

  • The upper middle class of the 1980s, people who had a nice house and some savings, the 30 percent just below the top 10 percent, owned 29 percent of all the wealth—once again, almost exactly their share in a perfectly equal society. Today that same comfortable 30 percent own only 17 percent of all the wealth.
  • In 1987 the least-wealthy 60 percent of Americans owned 6 percent of all U.S. wealth. Today that same large majority—people in the middle and the lower-middle and below, households worth less than $175,000—own a third as much, just 2 percent of all the wealth.
  • The combined wealth ($2.5 trillion) of that same large U.S. majority, the 200 million Americans from just above the middle all the way down to the bottom, is less than that of the 607 U.S. billionaires ($3.1 trillion). Therefore a single average American billionaire owns the same as 400,000 average members of the un-wealthy majority, an entire big city’s worth of Americans.
Posted in Distribution of Wealth, Poverty | Tagged , | 2 Comments

Disposal of nuclear waste in municipal landfills

Preface. The pandemic is probably going to enable a lot of bad legislation to be snuck in while attention is focused elsewhere. This proposal is for low-level waste in landfills. But the big problem is that nothing at all is being done to reopen Yucca Mountain or build another waste facility elsewhere for high-level waste, leaving toxic nuclear waste that lasts up to a million years for 50,000 future generations of humans to contend with.

Meanwhile, according to Dan Hirsch, president of the Committee to Bridge the Gap, a nuclear industry watchdog non-profit, Allowing very low-level radioactive waste to be disposed by land burial would be the most massive deregulation of radioactive waste in American history. If you dump radioactive waste in places that aren’t designed to deal with it, it comes back to haunt you. It’s in the air you breathe, the food that you eat, the water you drink (Ross 2020).

More nuclear waste posts here.

Alice Friedemann www.energyskeptic.com  author of “When Trucks Stop Running: Energy and the Future of Transportation”, 2015, Springer, Barriers to Making Algal Biofuels, and “Crunch! Whole Grain Artisan Chips and Crackers”. Podcasts: Collapse Chronicles,Derrick Jensen, Practical Prepping, KunstlerCast 253, KunstlerCast278, Peak Prosperity , XX2 report

***

Frazin, R. 2020. Advocates raise questions about proposal to allow some nuclear waste to be disposed in landfills. The Hill.

A March 6, 2020 Nuclear Regulatory Commission (NRC) proposal would allow for the disposal of some nuclear waste in municipal landfills, rather than a licensed facility.

“What they’re trying to do is prop up a failing industry so that the cost of decommissioning these [nuclear] reactors is reduced so you don’t have to send it to a place that is expensive because it’s designed to safely handle it,” said Dan Hirsch, the former director of the University of California, Santa Cruz’s Program on Environmental and Nuclear Policy.

“I find it just astonishing that they would do that in the midst of the coronavirus pandemic,” he added. “How the NRC can look themselves in the mirror to propose massive deregulation and do it in the midst of the pandemic, I find it just ethically shocking. If they’re going to consider it at all, it should only be considered once the pandemic is behind us,” he said.

Currently, the nuclear waste in question is typically disposed of at licensed waste disposal facilities, which have adequate training and equipment to protect public health.

The proposal would grant some exceptions to this regulation for waste with a cumulative radiation dose level of up to 25 millirem.

According to the NRC, Americans receive an average radiation dose of about 620 millirem each year. A chest x-ray would give off 10 millirem while a full-body CT scan would give a dose of 1,000 millirem.

In a statement on Thursday, Public Employees for Environmental Responsibility Pacific Director Jeff Ruch also criticized the proposal. “NRC’s action could transform most municipal dumps into radioactive repositories, with essentially no safeguards for workers, nearby residents, or adjoining water tables,” he said.

References

Ross, D. 2020. Critics alarmed by US nuclear agency’s bid to relax rules on radioactive waste. Nuclear Regulatory Commission keen to allow material to be disposed of by ‘land burial’ – with potentially damaging effects. The Guardian

Posted in Nuclear Waste | Tagged , | 5 Comments

Why no single or combination of alternative energy resources can replace fossil fuels

Preface. This 2002 paper is still true today. There simply are no renewable replacements for the fossil fuels that power our civilization.  If only scientists could violate the laws of thermodynamics and physics the way capitalistic crooks cheat, like Bernie Madoff or Enron’s Kenneth Lay & Jeffrey Skilling (Top 10 Crooked CEOs).  But scientists can’t bypass, ignore, or cheat Mother Nature’s laws.

This is why we haven’t been able to transition from fossil fuels to renewable forms of energy, and never will, despite these rosy predictions that have fooled so many into not worrying and preparing for the inevitable: (Cembalist 2021).

Even if there were Something Else, we’re running out of time, energy, and mineral resources to replace fossil fuels despite having had all of human history and the last few centuries to find alternatives. Energy transitions take decades. It took 50 years for oil to capture 10% of global energy after it was first drilled in the 1860s, and 30 more years to provide 25% of all energy. It took 70 years for natural gas to go from 1% to 20% of global energy (Smil 2010).

The larger the scale of existing infrastructure, the longer fossil substitution will take. In 2019, wind and solar contributed just 1.3% of total world energy consumption (BP 2020).

Alice Friedemann www.energyskeptic.com  author of “When Trucks Stop Running: Energy and the Future of Transportation”, 2015, Springer, Barriers to Making Algal Biofuels, and “Crunch! Whole Grain Artisan Chips and Crackers”. Podcasts: Collapse Chronicles, Derrick Jensen, Practical Prepping, KunstlerCast 253, KunstlerCast278, Peak Prosperity , XX2 report

* * *

Experts question new energy sources. Oct 31, 2002. AP.

None of the known alternate energy sources are technically ready to take the place of fossil fuels experts say in a new study.

The study by 18 scientists and engineers in university, government and private labs evaluated technologies that would make energy without burning oil, coal or natural gas and found that no single system or combination of systems could replace these fossil fuels.

Hoffert said a combination of renewable energy sources — such as wind and solar power generation, or electrical power beamed from orbiting solar satellites, and nuclear fusion power plants — “are theoretically capable of keeping our civilization going into the future, but the problem is that we haven’t taken the challenge seriously enough to do research in it. We are putting practically nothing into really, seriously studying the problem.”

In 2002, the world’s power consumption was over 12 trillion watts, with 85% of it produced by burning fossil fuels [2008: 15 trillion watts, 81% from fossil fuels].

The study surveyed the entire field of alternate energy and found most systems have serious technical problems such as:

  • Nuclear fission: It is not the final answer because of a shortage of uranium fuel. The proven reserves of uranium would last less than 30 years if nuclear fission was used to make 10 trillion watts of power, about a third of what will be needed by the end of the century.
  • Solar power: To meet the current U.S. needs with solar power would require sun collectors covering some 1,000 square miles. To make the equivalent of 10 trillion watts of added power would require surface arrays covering almost 85,000 square miles, an area larger than the state of Kansas.
  • Wind power: These systems must operate from remote areas and the current power grids could not manage the load.
  • Solar power satellites: Orbiting solar arrays could make electricity, convert it to microwaves and then beam that energy to a ground antenna where it would be converted back to electricity. But to make 10 trillion watts of power would require about 660 space solar power arrays, each about the size of Manhattan, in orbit about 22,000 miles above the Earth.
  • Hydrogen energy: Hydrogen does not exist in pure, natural reservoirs and has to be extracted from natural gas or water. The study found that more carbon dioxide and less energy is produced by the extraction of hydrogen than by burning natural gas directly. Extracting hydrogen from water using solar or wind power is not  “cost effective,”.
  • Nuclear fusion: After decades of study, science still has not learned how to extract power from the fusion of atoms.

Hoffert, Martin I., et al. November 1, 2002. Advanced Technology Paths to Global Climate Stability: Energy for a Greenhouse Planet, Science. Vol 298,:981-987.

Renewables

Renewable energy technologies include biomass, solar thermal and photovoltaic, wind, hydropower, ocean thermal, geothermal, and tidal (36). With the exception of firewood and hydroelectricity (close to saturation), these are collectively <1% of global power.

All renewables suffer from low areal power densities.

Biomass plantations can produce carbon-neutral fuels for power plants or transportation, but photosynthesis has too low a power density (∼0.6 W m−2) for biofuels to contribute significantly to climate stabilization (14, 37). (10 TW from biomass requires >10% of Earth’s land surface, comparable to all of human agriculture.)

PV and wind energy (∼15 Wem−2) need less land, but other materials can be limiting [Pacca].

For solar energy, U.S. energy consumption may require a PV array covering 10,000 square miles (a square ∼160 km on each side (26,000 km2) (38). The electrical equivalent of 10 TW (3.3 TWe) requires a surface array ∼470 km on a side (220,000 km2). However, all the PV cells shipped from 1982 to 1998 would only cover ∼3 km2(39). A massive (but not insurmountable) scale-up is required to get 10 to 30 TW equivalent.

More cost-effective PV panels and wind turbines are expected as mass production drives economies of scale. But renewables are intermittent dispersed sources unsuited to baseload without transmission, storage, and power conditioning. Wind power is often available only from remote or offshore locations. Meeting local demand with PV arrays today requires pumped-storage or battery-electric backup systems of comparable or greater capacity (40). “Balance-of-system” infrastructures could evolve from natural gas fuel cells if reformer H2 is replaced by H2from PV or wind electrolysis (Fig. 2A). Reversible electrolyzer and fuel cells offer higher current (and power) per electrode area than batteries, ∼20 kWem−2 for proton exchange membrane (PEM) cells (21). PEM cells need platinum catalysts, >5 × 10⁻³ kg Pt m−2 (41) (a 10-TW hydrogen flow rate could require 30 times as much as today’s annual world platinum production). Advanced electrical grids would also foster renewables. Even if PV and wind turbine manufacturing rates increased as required, existing grids could not manage the loads. Present hub-and-spoke networks were designed for central power plants, ones that are close to users. Such networks need to be reengineered. Spanning the world electrically evokes Buckminster Fuller’s global grid (Fig. 2B). Even before the discovery of high-temperature superconductivity (42), Fuller envisioned electricity wheeled between day and night hemispheres and pole-to-pole (43). Worldwide deregulation and the free trade of electricity could have buyers and sellers establishing a supply-demand equilibrium to yield a worldwide market price for grid-provided electricity.

Space solar power (SSP) (Fig. 3, A and B) exploits the unique attributes of space to power Earth (44,45). Solar flux is ∼8 times higher in space than the long-term surface average on spinning, cloudy Earth. If theoretical microwave transmission efficiencies (50 to 60%) can be realized, 75 to 100 We could be available at Earth’s surface per m2 of PV array in space, ≤1/4 the area of surface PV arrays of comparable power. In the 1970s, the National Aeronautics and Space Administration (NASA) and the U.S. Department of Energy (DOE) studied an SSP design with a PV array the size of Manhattan in geostationary orbit [(GEO) 35,800 km above the equator] that beamed power to a 10-km by 13-km surface rectenna with 5 GWeoutput. [10 TW equivalent (3.3 TWe) requires 660 SSP units.] Other architectures, smaller satellites, and newer technologies were explored in the NASA “Fresh Look Study” (46). Alternative locations are 200- to 10,000-km altitude satellite constellations (47), the Moon (48, 49), and the Earth-Sun L2Lagrange exterior point [one of five libration points corotating with the Earth-Sun system (Fig. 3C)] (50). Potentially important for CO2 emission reduction is a demonstration proposed by Japan’s Institute of Space and Aeronautical Science to beam solar energy to developing nations a few degrees from the equator from a satellite in low equatorial orbit (51). Papua New Guinea, Indonesia, Ecuador, and Colombia on the Pacific Rim, and Malaysia, Brazil, Tanzania, and the Maldives have agreed to participate in such experiments (52). A major challenge is reducing or externalizing high launch costs. With adequate research investments, SSP could perhaps be demonstrated in 15 to 20 years and deliver electricity to global markets by the latter half of the century (53, 54).

Figure 3

Figure 3. View larger version:In this page  In a new window

Capturing and controlling sun power in space. (A) The power relay satellite, solar power satellite (SPS), and lunar power system all exploit unique attributes of space (high solar flux, lines of sight, lunar materials, shallow gravitational potential well of the Moon). (B) An SPS in a low Earth orbit can be smaller and cheaper than one in geostationary orbit because it does not spread its beam as much; but it does not appear fixed in the sky and has a shorter duty cycle (the fraction of time power is received at a given surface site). (C) Space-based geoengineering. The Lagrange interior point L1 provides an opportunity for radiative forcing to oppose global warming. A 2000-km-diameter parasol near L1 could deflect 2% of incident sunlight, as could aerosols with engineered optical properties injected in the stratosphere.

Fission and Fusion

Nuclear electricity today is fueled by 235U. Bombarding natural U with neutrons of a few eV splits the nucleus, releasing a few hundred million eV (235U + n → fission products + 2.43n + 202 MeV) (55). The235U isotope, 0.72% of natural U, is often enriched to 2 to 3% to make reactor fuel rods. The existing ∼500 nuclear power plants are variants of 235U thermal reactors (56, 57): the light water reactor [(LWR) in both pressurized and boiling versions]; heavy water (CANDU) reactor; graphite-moderated, water-cooled (RBMK) reactors, like Chernobyl; and gas-cooled graphite reactors. LWRs (85% of today’s reactors) are based largely on Hyman Rickover’s water-cooled submarine reactor (58). Loss-of-coolant accidents [Three Mile Island (TMI) and Chernobyl] may be avoidable in the future with “passively safe” reactors (Fig. 4A). Available reactor technology can provide CO2 emission–free electric power, though it poses well-known problems of waste disposal and weapons proliferation.

Figure 4

Figure 4 View larger version: In this page   In a new window

(A) The conventional LWR employs water as both coolant and working fluid (left). The helium-cooled, graphite-moderated, pebble-bed, modular nuclear fission reactor is theoretically immune to loss-of-coolant meltdowns like TMI and Chernobyl (right). (B) The most successful path to fusion has been confining a D-T plasma (in purple) with complex magnetic fields in a tokamak. Breakeven occurs when the plasma triple product (number density × confinement time × temperature) attains a critical value. Recent tokamak performance improvements were capped by near-breakeven [data sources in (68)]. Experimental work on advanced fusion fuel cycles and simpler magnetic confinement schemes like the levitated dipole experiment (LDX) shown are recommended.

The main problem with fission for climate stabilization is fuel. Sailor et al. (58) propose a scenario with235U reactors producing ∼10 TW by 2050. How long before such reactors run out of fuel? Current estimates of U in proven reserves and (ultimately recoverable) resources are 3.4 and 17 million metric tons, respectively (22) [Ores with 500 to 2000 parts per million by weight (ppmw) U are considered recoverable (59)]. This represents 60 to 300 TW-year of primary energy (60). At 10 TW, this would only last 6 to 30 years—hardly a basis for energy policy. Recoverable U may be underestimated. Still, with 30- to 40-year reactor lifetimes, it would be imprudent (at best) to initiate fission scale-up without knowing whether there is enough fuel.

What about U from the seas? Japanese researchers have harvested dissolved U with organic adsorbents from flowing seawater (61). Oceans have 3.2 × 10⁻⁶ kg dissolved U m−3 (62)— a 235U energy density of 1.8 MJ m−3. Multiplying by the oceans’ huge volume (1.37 × 10¹⁸ m3) gives 4.4 billion metric tons U and 80,000 TW-year in 235U. Runoff and outflow to the sea from all the world’s rivers is 1.2 × 10⁶m3 s−1 (63). Even with 100%235U extraction, the flow rate needed to make reactor fuel at the 10 TW rate is five times as much as this outflow (64). Getting 10 TW primary power from235U in crustal ores or seawater extraction may not be impossible, but it would be a big stretch.

Despite enormous hurdles, the most promising long-term nuclear power source is still fusion (65). Steady progress has been made toward “breakeven” with tokamak (a toroidal near-vacuum chamber) magnetic confinement [Q ≡ (neutron or charged particle energy out)/(energy input to heat plasma) = 1] (Fig. 4B). The focus has been on the deuterium-tritium (D-T) reaction (→ 4He + n + 17.7 MeV). Breakeven requires that the “plasma triple product” satisfy the Lawson criteria: n × τ ×kT ≈ 1 × 10²¹ m−3 s keV for the D-T reaction, where n is number density; τ, confinement time; T, temperature; and k, Boltzmann’s constant (66, 67). Best results from Princeton (Tokamak Fusion Test Reactor) and Europe (Joint European Torus) are within a factor of two (68). Higher Qs are needed for power reactors: Neutrons penetrating the “first wall” would be absorbed by molten lithium, and excess heat would be transferred to turbogenerators. Tritium (12.3-year half-life) would also be bred in the lithium blanket (n + 6Li → 4He + T + 4.8 MeV). D in the sea is virtually unlimited whether utilized in the D-T reaction or the harder-to-ignite D-D reactions (→ 3He + n + 3.2 MeV and → T + p + 4.0 MeV). If D-T reactors were operational, lithium bred to T could generate 16,000 TW-year (69), twice the thermal energy in fossil fuels. The D-3He reaction (→ 4He + p + 18.3 MeV) is of interest because it yields charged particles directly convertible to electricity (70). Studies of D-3He and D-D burning in inertial confinement fusion targets suggest that central D-T ignitors can spark these reactions. Ignition of D-T–fueled inertial targets and associated energy gains of Q ≥ 10 may be realized in the National Ignition Facility within the next decade. Experiments are under way to test dipole confinement by a superconducting magnet levitated in a vacuum chamber (71), a possible D-3He reactor prototype. Rare on Earth, 3He may someday be cost-effective to mine from the Moon (72). It is even more abundant in gas-giant planetary atmospheres (73). Seawater D and outer planet3He could power civilization longer than any source other than the Sun.

How close, really, are we to using fusion? Devices with a larger size or a larger magnetic field strength are required for net power generation. Until recently, the fusion community was promoting the International Thermonuclear Experimental Reactor (ITER) to test engineering feasibility. Enthusiasm for ITER waned because of the uncertainty in raising the nearly $10 billion needed for construction. The U.S. halted ITER sponsorship in 1998, but there is renewed interest among U.S. fusion scientists to build a smaller-sized, higher-field, non-superconducting experiment or to rejoin participation in a half-sized, redesigned ITER physics experiment. A “burning plasma experiment” could produce net fusion power at an affordable scale and could allow detailed observation of confined plasma during self-heating by hot alpha particles. The Fusion Energy Sciences Act of 2001 calls on DOE to “develop a plan for United States construction of a magnetic fusion burning plasma experiment for the purpose of accelerating scientific understanding of fusion plasmas (74).” This experiment is a critical step to the realization of practical fusion energy. Demonstrating net electric power production from a self-sustaining fusion reactor would be a breakthrough of overwhelming importance but cannot be relied on to aid CO2 stabilization by mid-century.

The conclusion from our 235U fuel analysis is that breeder reactors are needed for fission to significantly displace CO2 emissions by 2050. Innovative breeder technologies include fusion-fission and accelerator-fission hybrids. Fissionable239Pu and/or 233U can be made from238U and 232Th (75). Commercial breeding is illegal today in the United States because of concerns over waste and proliferation (France, Germany, and Japan have also abandoned their breeding programs). Breeding could be more acceptable with safer fuel cycles and transmutation of high-level wastes to benign products (76). Th is the more desirable feedstock: It is three times more abundant than U and 233U is harder to separate and divert to weapons than plutonium. One idea to speed up breeding of 233U is to use tokamak-derived fusion-fission hybrids (68, 77). D-T fusion yields a 3.4-MeV alpha particle and a 14-MeV neutron. The neutron would be used to breed 233U from Th in the fusion blanket. Each fusion neutron would breed about one 233U and one T. Like235U, 233U generates about 200 MeV when it fissions. Fission is energy rich and neutron poor, whereas fusion is energy poor and neutron rich. A single fusion breeder could support perhaps 10 satellite burners, whereas a fission breeder supports perhaps one. A related concept is the particle accelerator-fission hybrid breeder (56): Thirty 3-MeV neutrons result from each 1000-MeV proton accelerated into molten lead; upon injection to a subcritical reactor, these could increase reactivity enough to breed 233U from Th, provide electricity, and power the accelerator efficiently (∼10% of the output). The radiotoxicity of hybrid breeder reactors over time is expected to be substantially below LWRs.

These ideas appear important enough to pursue experimentally, but both fission and fusion are unlikely to play significant roles in climate stabilization without aggressive research and, in the case of fission, without the resolution of outstanding issues of high-level waste disposal and weapons proliferation.

Concluding Remarks

Even as evidence for global warming accumulates, the dependence of civilization on the oxidation of coal, oil, and gas for energy makes an appropriate response difficult. The disparity between what is needed and what can be done without great compromise may become more acute as the global economy grows and as larger reductions in CO2-emitting energy relative to growing total energy demand are required. Energy is critical to global prosperity.

References

Cembalest M (2021) 2021 Annual Energy Paper. JP Morgan Asset & Wealth Management.

Posted in Alternative Energy, Biomass, Fusion, Hydrogen, Nuclear Power Energy, Orbiting Solar, Peak Oil, Photovoltaic Solar, Wind | Tagged , , , , , | 6 Comments

Utility scale energy storage doesn’t scale up: limits to minerals and geography

Preface. Natural gas is finite, but aside from (pumped) hydropower, natural gas is the main way wind and solar are balanced now. Therefore, a tremendous amount of energy storage will be needed in the future as natural gas declines.

And get this: the piddly amount of energy storage batteries that exist are mainly being used for arbitrage types of services, not energy storage. Yet we will need days, weeks, even months of energy storage in the future.

Of the 4,231 TWh electricity in 2022, just 3.8 TWh was stored in batteries, equal to eight hours (EIA 2022), and most of that eight hours was used to keep the grid stable despite all the attempts by wind and solar to crash it with their intermittency, volatility, and unpredictability.  Of the energy stored in batteries, 25% went to frequency regulation, 21% arbitrage, 17% ramping & spinning reserve, 12% to store excess wind and solar generation (67% of that in California), 8% voltage or reactive power support, 5% system peak shaving, and 9% for emergency backup storage and other services. Only 3% –14 minutes – went to storage to provide additional power to the grid. And while some of the batteries were paired with solar or wind, much of their charge came from natural gas and other non-renewable sources (EIA 2024 Battery storage in the U.S. 2023 Early release battery storage figures. U.S. Energy Information Systems. Figures 7, 8, 12 https://www.eia.gov/analysis/studies/electricity/batterystorage/).

The electric grid in California has come close to blacking out due to not enough energy storage several times due to lack of storage, despite producing so much renewable energy at times that it has to be curtailed.  Especially solar power, which generates the most power when least needed mid-day and to a lesser extent with wind power (Werner 2022).

This can’t be fixed, energy storage can’t be scaled up, which I explain in my book When Trucks Stop Running: Energy and the Future of Transportation i.e. why battery storage and more transmission lines don’t scale (as well as in this post and other posts within energyskeptic).

The current total energy storage capacity of the US grid is less than 1%. What little capacity there is comes from pumped hydroelectric storage, which works by pumping water to a reservoir behind a dam when electricity demand is low. When demand is high, the water is released through turbines that generate electricity.

This study has quantified the energetic costs of 7 different grid-scale energy storage technologies over time. Using a new metric called “Energy Stored on Invested, ESOI”, they concluded that batteries were the worst performers, while compressed air energy storage (CAES) performed the best, followed by pumped hydro storage (PHS).

But unfortunately, pumped hydro and compressed air energy storage can only contribute a small amount of storage, because there are few places left to put dams and underground salt domes. Eventually, as fossil fuels decline, wind and solar power will need to provide at least 80% or more of the electric power, since biomass doesn’t scale up.  Utility-scale electrochemical battery energy storage is essential to keeping the electric grid up in the future, not only to balance sudden surges and dips in intermittent power, but to provide at least a month of energy storage to provide for the seasonal nature of wind and solar, when neither is contributing power to the grid (Droste-Franke, B. 2015. Review of the need for storage capacity depending on the share of renewable energies in”Electrochemical energy storage for renewable sources and grid balancing”,  Elsevier).

In figure 4 it’s clear that the only energy storage battery that could materially scale up for up to 12 hours of world electricity energy storage is a sodium sulfur battery (Zinc-bromine battery flow batteries could too, but these are not within 10 years of being commercial).

The conclusion of this paper is:

“Although many potential short- and long-term energy resources are available to society, the greatest endowments of renewable low-carbon electricity are wind and solar. However, they require load-balancing techniques to mitigate their intermittent and variable nature. Electrical energy storage will allow the use of electricity in renewable-sourced grids with the same demand-centric perspective that is provided today from fossil fuel-sourced grids. The energy capacity required is likely between 4 and 12 hours of average power demand. To build an energy storage infrastructure of this size will require materials and energy at amounts comparable to annual global production values. Unless the cycle life of electrochemical storage technologies is improved, their energy costs will prohibit their deployment. CAES and NaS show the greatest potential for grid storage at global scale. Unless the cycle life of electrochemical storage technologies is improved, their energy costs will prohibit their deployment as a load-balancing solution at global scale”.

I have a chapter in my book “When Trucks stop running” about energy storage batteries that covers this in greater detail.  But to give you an idea of how far utility energy storage is from being able to store just one day of U.S. electricity generation (11.12 TWh), I used data from the Department of Energy (DOE/EPRI 2013) energy storage handbook “Electricity storage handbook in collaboration with NRECA”, to calculate the cost, size, and weight of NaS batteries capable of storing 24 hours of electricity generation in the United States.  The cost would be $40.77 trillion dollars, cover 923 square miles, and weigh a husky 450 million tons.

Sodium Sulfur (NaS) Battery Cost Calculation:

  • NaS Battery 100 MW. Total Plant Cost (TPC) $316,796,550. Energy
    Capacity @ rated depth-of-discharge 86.4 MWh. Size: 200,000 square feet.
  • Weight: 7000,000 lbs, Battery replacement 15 years (DOE/EPRI p. 245).
  • 128,700 NaS batteries needed for 1 day of storage = 11.12 TWh/0.0000864 TWh.
  • $40.77 trillion dollars to replace the battery every 15 years = 128,700 NaS * $316,796,550 TPC.
  • 923 square miles = 200,000 square feet * 128,700 NaS batteries.
  • 450 million short tons = 7,000,000 lbs * 128,700 batteries/2000 lbs.

Using similar logic and data from DOE/EPRI, Li-ion batteries would cost $11.9 trillion dollars, take up 345 square miles, and weigh 74 million tons. Lead–acid (advanced) would cost $8.3 trillion dollars, take up 217.5 square miles, and weigh 15.8 million tons.

Below is the paper, and here are two other news sources that covered the story:

And there simply aren’t enough minerals on earth to make a transition to “renewables”:

Alice Friedemann  www.energyskeptic.com Women in ecology  author of 2021 Life After Fossil Fuels: A Reality Check on Alternative Energy best price here; 2015 When Trucks Stop Running: Energy and the Future of Transportation, Barriers to Making Algal Biofuels, & “Crunch! Whole Grain Artisan Chips and Crackers”.  Podcasts: Crazy Town, Collapse Chronicles, Derrick Jensen, Practical Prepping, KunstlerCast 253, KunstlerCast278, Peak Prosperity

***

Barnhart, Charles J. and Benson, Sally M. January 30, 2013. On the importance of reducing the energetic and material demands of electrical energy storage. Energy Environ. Sci., 2013, 6, 1083-1092.

Two prominent low-carbon energy resources, wind and sunlight, depend on weather. As the percentage of electricity supply from these sources increases, grid operators will need to employ strategies and technologies, including energy storage, to balance supply with demand.

We quantify energy and material resource requirements for currently available energy storage technologies: lithium ion (Li-ion), sodium sulfur (NaS) and lead-acid (PbA) batteries; vanadium redox (VRB) and zinc-bromine (ZnBr) flow batteries; and geologic pumped hydroelectric storage (PHS) and compressed air energy storage (CAES). By introducing new concepts, including energy stored on invested (ESOI), we map research avenues that could expedite the development and deployment of grid-scale energy storage. ESOI incorporates several storage attributes instead of isolated properties, like efficiency or energy density. Calculations indicate that electrochemical storage technologies will impinge on global energy supplies for scale up — PHS and CAES are less energy intensive by 100 fold. Using ESOI we show that an increase in electrochemical storage cycle life by tenfold would greatly relax energetic constraints for grid-storage and improve cost competitiveness. We find that annual material resource production places tight limits on Li-ion, VRB and PHS development and loose limits on NaS and CAES. This analysis indicates that energy storage could provide some grid flexibility but its build up will require decades. Reducing financial cost is not sufficient for creating a scalable energy storage infrastructure. Most importantly, for grid integrated storage, cycle life must be improved to improve the scalability of battery technologies. As a result of the constraints on energy storage described here, increasing grid flexibility as the penetration of renewable power generation increases will require employing several additional techniques including demand-side management, flexible generation from base-load facilities and natural gas firming.

Broader context

To increase energy security and reduce climate forcing emissions, societies seek to transition from fossil fuel based energy resources to renewable energy resources including wind and solar. However, an energy system based on renewable sources presents a host of challenges. Wind and solar resources vary with weather phenomena, yielding a variable and intermittent supply of energy. Electricity grid operators will need to employ several grid firming techniques including electrical energy storage. Building up energy storage for the power grid will require physical and financial resources. This study focuses on the energetic costs of storage. We calculate the energy and material demands on society required to build and maintain electrical energy storage capable of supplementing electricity generation mixes comprised primarily of wind and solar. We present a novel metric for comparing the energy performance of storage technologies: energy stored on energy invested (ESOI). This metric is especially useful because it combines several attributes of storage technologies that affect their energy costs, not just, for example, efficiency. Using ESOI, we map research and development avenues – primarily a 5 to 10 fold increase in cycle life – that will significantly reduce the energetic and material costs. Otherwise, the energetic cost of electrochemical storage technologies will preclude wide-scale adoption of grid-scale energy storage. Additionally, this work informs technology development and the planning of present and future energy systems.

1 Introduction

Stable operation of the electric grid requires that the power supply instantaneously matches the power demand. Grid operators continually balance the energy demands of consumers by dispatching available generation.1 This complicated task will become even more demanding in the future. Driven by the need to reduce the emission of CO2 and increase energy security, policy makers have implemented and continue to implement measures requiring greater power generation to shift to low-carbon energy resources.2,3 Wind and solar power show great potential as low carbon sources of electricity, but they depend on the weather. Grid operators cannot employ these resources at their discretion.

As the percentage of power generation by variable sources grows, flexibility in power grid operation will become increasingly necessary.4,5 Without increased flexibility variable resources will be underutilized and suffer from lower capacity factors — the financially critical ratio of actual energy provided to potential based on name plate capacity. Reduced capacity factors drive up the levelized cost of electricity. Curtailment of variable resources increases as their percentage of the grid’s power supply climbs from 20% to 30%.6 Beyond 30%, sharp reductions in capacity factors occur without increases in system flexibility.7

Future grid operators will achieve flexibility by employing techniques that modulate the balance of supply and demand. Proposed techniques include: real-time adjustments of customer electricity use through demand side management; installing generation overcapacity and transmission resources; or decoupling the instantaneous match of supply and demand with energy storage. Large-scale storage maximizes generation utilization without affecting when and how consumers use electrical power.

Storage is an attractive load-balancing technology for several reasons. It increases grid reliability and decreases carbon emissions by reducing transmission load and allowing spinning power plants to operate at optimum efficiencies.4 Storage could provide grid flexibility in locations that have ambitious climate-change policies and relatively low-carbon electricity sources including natural gas combined cycle, hydroelectric and nuclear.8 Finally, storage provides ancillary grid services including regulation, volt–ampere reactive (VAR) power and voltage support.9

The benefits of grid-scale energy storage are clear. The question then is cost. How much energy must society consume to build and maintain grid-scale storage? Will material availability limit deployment? What will the financial cost be? Today, financial cost obstructs storage adoption, yet valuable insights concerning application and optimal scheduling continue to make inroads.9,10 In this paper we focus on physical costs: energy and materials.

Our analysis is presented as follows. First we identify reasonable storage capacities appropriate for future grids with high percentages of renewable power generation. Secondly, we calculate the embodied energy required to maintain operational storage worldwide. Here, we present a novel metric for quantitatively assessing the energetic performance of storage technologies: energy stored on energy invested (ESOI). Thirdly, we apply the methods of Wadia et al.11 and calculate material dependencies for grid-scale energy storage. Finally, we discuss implications of these energetic and material constraints on storage deployment and recommend research and development directions that could relax these constraints.

This study builds on several foregoing studies that consider the material constraints of battery technologies. The electrification of vehicles has led to careful consideration of the materials needed to produce an adequate supply of vehicle batteries.12–14 Here we extend their material analysis to grid-scale storage by adding additional technologies. Our principle contribution is the quantification and discussion of the energetic costs of grid-scale energy storage in the context of providing grid flexibility for variable resources.

1.1 Electrical energy storage at global scale

Energy storage devices establish and maintain reversible chemical, pressure or gravitational potential differences between the storage medium and local environmental equilibrium. The design of an energy storage device is motivated by its application. Engineers place emphasis on different attributes – cost, efficiency, weight, capacity, etc. For grid-scale applications energy density is less important than cost, safety, efficiency and longevity.

The total energy capacity of storage needed to provide flexibility in the future is an active area of future energy system scenario research and ranges from no storage required to up to three days.15,16 We draw our estimates from several authoritative studies that explore future generation mix scenarios that include up to 50–80% renewable resources11,15,17,18 (see ESI for details). In the following analyses we use a narrower global storage capacity of 4 to 12 hours of world average power demand as a point of reference. This can be described as any equivalent time and power combination. For example, this is equivalent to the amount of energy needed to provide 1/2 of world electricity needs for 8 to 24 hours etc. It corresponds to an energy capacity of 8.4 to 25.3 TW h assuming present day average global power demand: 2.1 TW.19 For comparison, present day fossil fuel energy stores are over 15 times greater. We use this range to ask, ‘how much material and energy will be required to build storage for this range of estimates?’ Will these requirements preclude or present challenges for storage technologies? Are there attributes of storage technologies that R&D efforts should focus on to reduce energetic and material requirements?

For this analysis, we only included current representative electrical energy storage technologies with a developmental stage of pilot, commercial or mature, that show promise of economic viability within a ten-year time frame.9 We selected three batteries, two flow batteries, and two geological storage technologies for analysis: lithium-ion (Li-ion), sodium sulfur (NaS), and lead-acid (PbA); vanadium redox (VRB) and zinc-bromine (ZnBr); and compressed air energy storage (CAES) and pumped hydroelectric storage (PHS). Several books and review papers describe these technologies at length.22–28

2 Calculations and results

2.1 Energetic requirements

Building storage devices requires energy for resource acquisition, transportation, fabrication, delivery, operation, maintenance and disposal. This requisite energy is its embodied energy. In this section we analyze the energy costs for storage technologies from three perspectives. The first compares initial energy costs of storage technologies. The second compares the energy costs for storage technologies over a 30 year period. The third presents a new metric, Energy Stored on Invested (ESOI), which has advantages over single parameter metrics, such as cost, efficiency or cycle-life.

We compare the energy costs of storage technologies by considering their cradle-to-gate embodied energy requirements. In a cradle-to-gate analysis, a specific Life Cycle Assessment (LCA) valuation, a technology’s use phase and disposal phase are omitted. We obtained these values for storage technologies from published LCA studies.13,29,30 A recent review of battery LCA by Argonne National Laboratory recognizes that battery LCA data often lack detailed energy and material flows in the best of cases.13 More commonly data is non-existent or decades out-of-date. We can, using these data, consider the implications of energy costs, obtain comparisons between technologies, and identify technology attributes that, if targeted by research, will lead to reductions in energy use in storage deployment. We converted values from study specific units to an embodied energy storage ratio, εgate — a dimensionless number that indicates the amount of embodied primary energy required for one electrical energy unit of storage capacity.

We obtained LCA data for technologies from three sources.13,29,30 Additional LCA data for materials were obtained from various reports and software databases.31–36 We truncate values to cradle-to-gate from studies that included cradle-to-grave analyses for consistency e.g. Denholm and Kulcinski, 2004.30 Values reported by Rydh and Sanden, 2005 (ref. 29) where in units of MJ primary fuel per kg of battery. These were converted from per kg to per MJ electricity capacity by assuming a practical energy density for electrochemical storage technologies (see Table 2).

Fig. 1A shows the cradle-to-gate embodied primary energy per unit of electrical energy capacity, εgate, in pink for grid-scale storage technologies. The embodied energy associated with materials and manufacturing are shown in blue and green boxes respectively. Median values for materials and manufacturing do not sum to median total εgate values because some studies only report total εgate and additional estimates for material embodied energy were obtained from LCA software databases and reports as described above. Electrochemical storage technologies require 3 to 7 times more energy per unit storage capacity than PHS and CAES. While it requires 694 units of energy to manufacture 1 unit of VRB storage capacity, it only takes 73 units for 1 unit of CAES capacity.

Fig. 1 Energy storage technologies require varying amounts of energy for manufacturing and for their production. (A) Cradle-to-gate primary embodied energy per unit of electrical energy storage capacity, ?gate, for storage technologies. (B) Levelized embodied energy required to build out grid-scale energy storage. Colored lines indicate the levelized embodied energy costs for storage technologies for a 30 years period as a function of capacity.

Fig. 1 Energy storage technologies require varying amounts of energy for manufacturing and for their production. (A) Cradle-to-gate primary embodied energy per unit of electrical energy storage capacity, ?gate, for storage technologies. (B) Levelized embodied energy required to build out grid-scale energy storage. Colored lines indicate the levelized embodied energy costs for storage technologies for a 30 years period as a function of capacity.

2.2 Levelized embodied energy

Selecting a storage technology based on static, up-front embodied energy costs alone is insufficient. Over time, cycle life (the number of times a technology can be charged and discharged) and efficiency greatly affect cumulative embodied energy requirements. Prior analysis led to two important findings: (a) technologies like PbA, whose energy requirements are dominated by production and transportation, are sensitive to cycle life and (b) technologies like Li-ion, NaS, VRB, ZnBr, PHS, CAES whose energy requirements are dominated by operation, are sensitive to round-trip efficiency.37 The energy cost will depend on the cycle life (λ) and round-trip efficiency (η) of storage technologies. The depth-of-discharge (D) modulates both cycle life and installation energy capacity size. A battery with a shallow D will require a larger installed capacity to provide a specified amount of energy storage. Table 1 shows attributes used for our analysis.

Table 1 Storage technology attributes affecting life-cycle energy requirements

  η  λ at depth-of-discharge (DOD)  
% 100% 80% 33% ε gate 
a Sources: ref. 23. b Sources: ref. 29. c Primary energy per unit electrical energy.
Li-ion 90 4000 6000 8500 454
NaS 75 2400 4750 7150 488
PbA 90 550 700 1550 321
VRB 75 2900 3500 7500 694
ZnBr 60 2000 2750 4500 504
CAES 70 >25000 DOD indep. 73
PHS 85 >25000 DOD indep. 101

A simple AC–AC round-trip η cannot be computed for CAES because it uses additional energy from natural gas used to heat the air as it leaves the storage cavity. By subtracting natural gas energy inputs and considering the differences in energy quality between natural gas and electricity, analysts report net electrical storage efficiencies between 66 and 71%.30,38 NaS and flow battery efficiencies are lower than other electrochemical technologies due to parasitic energy losses associated with thermal management and pumps.23

For nearly all electrochemical storage technologies, cycle life depends on the operating temperature and the depth of discharge. This is due to the kinetic behavior of chemical reactions. Rydh and Sanden 2005 (ref. 29) provides a table that shows cycle-life ranges for three different depths of discharge: 33%, 80% and 100%. Linden, 2010 (ref. 23) describes in detail the relationship between kinetics and cycle life for electrochemical storage technologies. Here, we assume the optimum operating temperature and select the depth of discharge and coupled cycle life that minimizes the levelized energy consumption (italic font in Table 1).

We calculate a levelized embodied energy for storage technologies as follows:

where tday is the number of days operating per year (365), and T is the levelization period in years. We assume EES technologies are replaced entirely and that recycling is not significant due to rapid deployment and scale up. Recycling would likely reduce the εgate preferentially for technologies with shorter cycle life, but this effect was not quantified here. PbA’s low εgate might be attributed to extensive present day recycling of automotive batteries.39 The normalization factor incorporating cycle life is rounded up to the next integer. Similar to levelized cost of electricity (LCOE) studies, we select a levelization period of 30 years.40

The solid lines in Fig. 1B, correspond to storage technologies and show the LEembodied (x-axis) required to build and maintain storage capacity (y-axis). The horizontal red lines indicate the world energy storage capacity reference of 4 to 12 hours of average power demand. Once a line has entered into the shaded regions the storage capacity as indicated by they-axis will require 1% and 3% of today’s global primary energy production to manufacture and maintain storage devices assuming a 30 years levelization period. Electrochemical storage technologies require 10 to 100 times more embodied energy for a given energy capacity than geological storage technologies.

2.3 Energy stored on invested

The levelized embodied energy calculation is useful for estimating the energy required to build grid-scale storage, but it suffers from biases introduced by assuming a levelization period and operational hours per year or a capacity factor. Motivated by energy returned on invested (EROI) analysis,41 we present a new formula that avoids these biases: energy stored on invested (ESOI). ESOI is the ratio of electrical energy stored over the lifetime of a storage device to the amount of primary embodied energy required to build the device:
(2)

where D, the depth-of-discharge, modulates the energy stored. Fig. 2 shows the ESOI for load-balancing storage technologies. It contrasts with the static cradle-to-gate energy costs shown in Fig. 1A. Over their entire life, electrochemical storage technologies only store 2–10 times the amount of energy that was required to build them.

Fig. 2 A bar plot showing ESOI, the ratio of total electrical energy stored over the life of a storage technology to its embodied primary energy. Higher values are less energy intensive.

Fig. 2 A bar plot showing ESOI, the ratio of total electrical energy stored over the life of a storage technology to its embodied primary energy. Higher values are less energy intensive.

2.4 Material resource requirements

In addition to energy costs, storage technologies require material resources. Several prior studies have estimated the material requirements for energy storage.12–14 The principal contribution of this study is quantifying the energetic requirements of energy storage. Materials are a second physical cost and we conducted our own analysis in order to discuss the implications these material requirements have on the time required to scale energy storage for load-balancing renewable resources in future energy systems.

Consider the elemental constituents of storage technologies. Fig. 3A–C show how global annual production, price and specific embodied energy vary with the mass fraction of elements in the Earth’s lithosphere.§ The top plot shows the total mass of elements produced annually worldwide in metric tonnes (1000 kg). The specific value is the 5 years annual average from 2006 to 2011.33 The colors of the plotted data correspond with the storage technology that each element supplies. The middle plot denotes price of elements in U.S. dollars per kg. The bottom plot shows the amount of embodied energy per kg of element acquisition is required using today’s extraction and purification techniques. The amount of energy required to extract and process a kg of material depends on its chemical form in the lithosphere. We obtained LCA data for elements from LCA studies, consultant firms and software packages: Li;31,32 Co;33 Na;34 S;35 Pb;31,34 V;32,36 Zn.31,34

Fig. 3 Energy storage technologies depend on the availability of critical materials and geologic resources. Lithospheric abundance of critical elements loosely correlates with resource production (A), price (B) and embodied energy (C). The blue lines represent a simple linear regression with grey envelopes outlining a confidence interval of 0.95

Fig. 3 Energy storage technologies depend on the availability of critical materials and geologic resources. Lithospheric abundance of critical elements loosely correlates with resource production (A), price (B) and embodied energy (C). The blue lines represent a simple linear regression with grey envelopes outlining a confidence interval of 0.95

The relative abundance of technology specific elements in the earth’s crust does not necessarily indicate their ability to be mined and produced, but it provides an initial assessment of material limits faced by certain technologies.42,43 For example, sulfur, the limiting electrochemical agent for NaS, is over 40 times more abundant than lead, the limiting agent for PbA. In general, annual production increases with lithospheric abundance and price decreases. Considering annual production alone, NaS manufacturing has advantages over VRB manufacturing due to an in-place production infrastructure that produces over 1000 times more requisite material.

2.5 Energy storage potential of resources

How much energy can a critical material or resource store? The energy storage potential (ESP) estimates the energy capacity of a storage technology’s critical resources.11,37 In this case, the ESP is limited by one of the two elements or molecules of the battery cell’s electrochemical couple: , where ρ is the theoretical energy density, M is mass of limiting material available, and mf is the mass fraction within the electrochemically active materials with corresponding ρTable 2 lists parameters used in ESP calculations. For ESP calculations, several assumptions and caveats were made:

Table 2 Electrochemical storage technology properties

Technology Reactants m f ρ theoretical (ρpractical)
a Sources: All information from ref. 23 unless otherwise noted.48
Li-ion (cylindrical spiral-bound) LixC6 Li 0.04 448 W h kg−1
Li1−xCoO2 Co 0.35 -200
NaS (NGK-Tepco) 2Na + xS Na 0.42 792
(x = 5 − 3) S 0.58 -170
PbA (prismatic) Pb + PbO2 Pb 0.93 252
H2SO4 -35
VRB V(SO4) V 0.31 167a
VO2(HSO4) (30a)
ZnBr Zn + Br2 Zn 0.29 436
Br 0.71 -70
  • We only considered materials that constitute the storage medium. There may be other resources, rare-earth elements for example, that play a key role in a storage technologies operation. The U.S. Department of Energy has identified elements critical for energy storage in “Critical Materials Strategy”.44This report indicates that some battery technologies, NiMH for example, use a cathode material designated as AB5, where A is typically rare earth mischmetal containing lanthanum, cerium, neodymium and praseodymium.44
  • The reserve base is an estimate based on measured or indicated amounts of minerals including minerals that are marginally economical and sub-economical to extract as defined by the USGS MCS report.33If a material is in low demand then reserve bases will likely be underestimates of resource availability.
  • The theoretical energy density is based on the active anode and cathode materials only. In practice, batteries only realize 25% to 35% of their theoretical energy density because of necessary inactive components.23Necessary components including electrolytes, containers, separators, current collectors and electrodes add mass and volume to the battery which reduces energy density.
  • CAES and PHS require cement and steel for construction; they are not materially limited. The embodied energy associated with acquiring steel will limit its acquisition well before limits in the physical material availability of iron and carbon in the lithosphere. However, they do require unique geological formations. A thorough estimate for national or worldwide PHS potential has yet to be made. The U.S. Energy Information Agency (EIA) and the U.S. Department of the Interior estimate remaining U.S. pumped hydro storage capacity at ten times present day levels.45,46These studies are conservative in that they do not consider coastal PHS. Considering these studies, we conservatively assume that the world has at least ten times present day pumped hydro capacity: 102 GW h × 10 = 1 TW h.
  • For CAES we estimate the ESP by considering locations identified for carbon dioxide sequestration and the energy density of compressed air: ESP = ρCAES× V, where Vis the reservoir volume. The volumetric energy density, ρCAES, of compressed air of atmospheric composition increases almost linearly with reservoir pressure.38 Existing CAES plants, for example Huntorf, have variable reservoir pressures of 60 bars and energy densities between 3 and 5 kW h m−3. We assume hydrostatic reservoirs in underground aquifers at depths greater than 500 m and an energy density ρCAES = 5 kW h m−3. The global volume estimates for CO2 sequestration for depleted oil and gas reservoirs and saline aquifers are 2 × 10¹²m3 and 7.9 × 10¹² m3 respectively.47

Fig. 4 shows the ESP for grid-scale storage technologies. The shaded section on the left shows the ESP for EES limiting materials based on their annual production (colored bars). Using Pb as an example, if the entire annual production of lead was used to create PbA batteries, the total energy storage capacity would be 1.1 TW h or about 2% of the average world daily electricity demand. Sulfur, if used entirely for NaS manufacturing, would yield nearly 1000 times greater energy storage capacity. The main section of Fig. 4 shows ESP as a function of time (x-axis) assuming linear growth. This provides an estimate for the time required for a storage technology to reach an energy storage capacity goal of 4 to 12 hours (red horizontal lines). The shaded region on the right shows ESP as a function of economically viable reserve estimates or as a function of conducive geologic formations. Traditionalfossil fuel storage reserves are shown as reference (see footnote‡).

Fig. 4 shows the ESP for grid-scale storage technologies. The shaded section on the left shows the ESP for EES limiting materials based on their annual production (colored bars). Using Pb as an example, if the entire annual production of lead was used to create PbA batteries, the total energy storage capacity would be 1.1 TW h or about 2% of the average world daily electricity demand. Sulfur, if used entirely for NaS manufacturing, would yield nearly 1000 times greater energy storage capacity. The main section of Fig. 4 shows ESP as a function of time (x-axis) assuming linear growth. This provides an estimate for the time required for a storage technology to reach an energy storage capacity goal of 4 to 12 hours (red horizontal lines). The shaded region on the right shows ESP as a function of economically viable reserve estimates or as a function of conducive geologic formations. Traditionalfossil fuel storage reserves are shown as reference (see footnote‡).

Fig. 5 compares the embodied energy required to obtain a kg of various elements to the ESP of a kg of those elements. Assuming that the energy required to manufacture battery technologies are comparable, elements with a higher ESP/embodied ratio, like Na and Br, are less energy intensive.

Fig. 5 compares the embodied energy required to obtain a kg of various elements to the ESP of a kg of those elements. Assuming that the energy required to manufacture battery technologies are comparable, elements with a higher ESP/embodied ratio, like Na and Br, are less energy intensive.

Discussion

Researchers have identified capital and levelized cost points that permit profitable avenues for storage.9,49,50 In response, industry and academia currently focus on developing inexpensive storage technologies. However, by asking the simple question, “Will energy and material costs limit the ability of storage to provide load-balancing for the electrical grid?”, we identify other critical criteria that must be addressed to achieve sufficient and rapid scale up of the storage industry. Storage adds infrastructure and necessarily increases material and energy demands. Society’s ability to accommodate these demands will dictate the maximum quantity and rate of storage deployment. Other energetic, material and land use constraints may limit renewable energy production technologies, precluding the need for massive grid-scale energy storage, and such studies are needed.

3.1 On energetic costs

Comparing εgate for storage technologies in Fig. 1A leads to two general conclusions. First, technologies that use readily available, inexpensive and abundant materials like air or waterrequire much less embodied energy than technologies that require rare elements mined from the earth. Second, older technologies like PbA contain less embodied energy associated with manufacturing than newer technologies like VRB because they benefit from progression and advancements in their production and manufacturing ‘learning-by-doing’ that also leads to reductions in financial costs.

Consider the levelized embodied energy costs over a 30 years time frame shown in Fig. 1B. PbA, the most demanding technology, requires over 1.5 years of worldwide primary energy demand to create 12 h of storage. Even if this demand was to be spread out over the next 30 years, the world would need to produce 5% more energy just to build PbA storage. This is doable, but would require sustained and cooperative efforts from government and industry. Less energy would be available for other uses. If we want to limit the amount of energy needed to build storage systems then we need to start building it now and continue for a long time. Alternatively, if we can rely on CAES and PHS, then energy requirements will not be a limitation and it could be built more quickly. Developing electrochemical technologies with comparable levelized embodied energy values to CAES and PHS would be immensely beneficial.

The most effective way a storage technology can become less energy intensive over time is to increase its cycle life. This suggests that the current R&D focus on reducing costs is not necessarily sufficient to create a scalable energy storage infrastructure. Instead, the focus needs to be on identifying energy storage options with much lower levelized energy costs – comparable to PHS and CAES. Granted, the accuracy of the LCA data could be greatly improved. Case studies for cycle life data, efficiency and depth-of-discharge should be sought to augment the highly generalized data presented here. The general implications would not change however. Unless cycle life is increased by a factor of 3 to 10 and embodied energy costs are reduced, the amount of storage required to provide load-balancing for significant fractions of renewable generation will tax societies’ energy systems.

The ESOI ratio compares the cumulative amount of energy stored to the embodied energy cost. Whereas CAES and PHS store >100 times more energy over its life than the energy required to build them, PbA’s low cycle life (300) leads to a poor ESOI ratio of 2. All of the electrochemical storage options have low ESOI ratios. CAES and PHS likely have higher ESOI values than those calculated here given our conservative cycle life estimate of 25,000. Ranked from least to most limited by energetic requirements, the technologies considered here are as follows: CAES, PHS, Li-ion, NaS, VRB, ZnBr, PbA.

A singular focus on improving storage efficiency misses the greatest opportunity for reducing the amount of energy required by storage technologies. We should not only consider the energy dissipated with every cycle due to inefficiencies, but the energy required, up-front, for manufacturing the technology. The total energy per unit capacity lost due to inefficiencies over the lifetime of a technology depends on the total number of cycles, λ, and the efficiency, ηεη = (1 − η)λ. For all electrochemical storage technologies, the up-front energy cost, εgate/D, dominates the energy budget (cf.Table 1). As a superior metric, ESOI includes all of these terms in a meaningful and intuitive way that quantitatively assesses the energy performance of storage technologies.

3.2 On material resource costs

Developing storage technologies that use Earth-abundant materials with high annual production rates like Na, S and Zn is not only practical, but the production infrastructure is already in place. All electrochemical storage technologies considered here besides NaS will require a significant portion of their active resources’ annual production. For example, one can estimate from Fig. 4 that about 3 days of Na production yields the ESP equivalent of 1 year of Pb production and 10 years of Co production. If battery manufacturing rates were to increase rapidly over the next half century, demand for these materials would increase greatly. Likely, this would encourage mining industry R&D and resource exploration efforts, increasing the amount of economically viable reserves.51 The challenge will be in the extraction of storage critical resources. For an individual technology to reach 12 hours of capacity, annual production by mass will need to double for lead, triple for lithium, and increase by a factor of 10 or more for cobalt and vanadium. This will drive up the price of these commodities.

Geologic storage, in particular CAES, faces negligible material limits. The challenge for geologic energy storage is finding suitable sites that accommodate not only technical requirements, but environmental considerations as well. Ranked from least to most limited by material availability, the technologies considered here are as follows: CAES, NaS, ZnBr, PbA, PHS, Li-ion, VRB.

3.3 Proposed technology targets

Although our results identify major challenges for EES at grid-scale, they, more importantly, indicate research directions that will loosen storage material and energy constraints. The ESOI of storage technologies depends linearly on their efficiency, depth-of-discharge, embodied energy and cycle-life (eqn (2)). Consider the current range and theoretical limits on these parameters. Fig. 6 shows how ESOI varies with efficiency, cycle life and embodied energy. With this framework efficiency and depth-of-discharge can be increased at most by about 25–33% or a factor of 1/4 to 1/3. What about εgate? Using current and developing new low-energy extraction techniques and reducing energy costs in manufacturing through efficiencies gained by learning, we anticipate that embodied energy costs could be reduced at most by a factor of 2 to 3.

Fig. 6 Two contour plots show how ESOI depends on cycle life (x-axis), efficiency (y-axis of upper plot) and embodied energy (y-axis of lower plot).

Fig. 6 Two contour plots show how ESOI depends on cycle life (x-axis), efficiency (y-axis of upper plot) and embodied energy (y-axis of lower plot).

The third parameter in eqn (2), cycle life, has a range for current technologies from <1000 to >25,000, a factor of 25. Clearly then, the greatest potential for increasing the ESOI for storage technologies lies with a R&D focus on extending cycle life. Ongoing research may push cycle life for some technologies including lead-acid beyond 40,000.52 The lower plot of Fig. 6 implies that at high cycle life values >15,000, reductions in εgate provide the greatest increase in ESOI. PHS has very high cycle life and low εgate. Limited by geologic setting, further PHS development would benefit from research into plant component resistance to harsh salt water environments. This would permit robust, long-lasting PHS at coastal locations.

Much energy storage research currently focuses on high specific energy density (W h kg−1).53,54 This quality is very important for electric vehicles and portable electronics. Cycle life is less of a concern in these applications because batteries in portable electronics and vehicles lack market drivers to outlive these goods. For grid scale applications, energy density is not limiting (see ESI, spatial footprint). Based on ESOI calculations, EES research should focus on making robust and long-lived storage devices, extending cycle life. The less frequently a storage technology needs to be decommissioned, recycled and built anew, the less energy and material resources will be required to maintain capacity.

3.4 Concluding remarks

Although many potential short- and long-term energy resources are available to society, the greatest endowments of renewable low-carbon electricity are wind and solar. However, they require load-balancing techniques to mitigate their intermittent and variable nature. Electrical energy storage will allow the use of electricity in renewable-sourced grids with the same demand-centric perspective that is provided today from fossil fuel-sourced grids. The energy capacity required is likely between 4 and 12 hours of average power demand. To build an energy storage infrastructure of this size will require materials and energy at amounts comparable to annual global production values. Unless the cycle life of electrochemical storage technologies is improved, their energy costs will prohibit their deployment. CAES and NaS show the greatest potential for grid storage at global scale. Unless the cycle life of electrochemical storage technologies is improved, their energy costs will prohibit their deployment as a load-balancing solution at global scale.

EES will not play a singular role in providing flexibility for power grids supplied by renewable resources. Given the high energy costs and necessary increases in material production introduced by storage, grid-operators should employ other techniques in concert. Integrating storage technologies, demand-side management including smart-grid applications, and most likely natural gas firming generation resources should prove to be a challenging yet rewarding goal that will ultimately greatly reduce carbon emissions and increase grid reliability and security.

Acknowledgements

This work was conducted by Stanford University’s Global Climate and Energy Project (GCEP). We greatly appreciate the support GCEP’s sponsors provided (http://gcep.stanford.edu).

Related Articles

References of paper

  1. (CAISO) California Independent Service Operator, ‘Integration of Renewable Resources: Operational Requirements and Generation Fleet Capability at 20% RPS’, California ISO, 2010.
  2. F. Pavley and F. Nunez, California Assembly Bill No. 32-Global Warming Solutions Act of 2006, 2006, http://www.arb.ca.gov/cc/docs/ab32text.pdf Search PubMed .
  3. CARPS, California Codes: Public Utilities Code. Section 399.11–399.31. California Renewables Portfolio Standard Program, 2009, http://www.leginfo.ca.gov/cgi-bin/calawquery?codesection=puc, accessed 27 May 2012 Search PubMed .
  4. P. Denholm and R. M. Margolis, Energy Policy, 2007, 35, 4424–4433 CrossRef .
  5. P. Denholm, E. Ela, B. Kirby and M. Milligan, NREL Technical Report, 2010, NREL/TP-6A, p. 61 Search PubMed .
  6. D. Corbus, D. Lew, G. Jordan, W. Winters, F. Van Hull, J. Manobianco and B. Zavadil, IEEE Power Energ. Mag., 2009, 7, 36–46 Search PubMed .
  7. P. Denholm and R. M. Margolis, Energy Policy, 2007, 35, 2852–2861 CrossRef .
  8. (CCST) California Concil on Science and Technology, California’s Energy Future – The View to 2050, Summary Report, California council on science and technology technical report, 2011 Search PubMed .
  9. D. Rastler, Electricity Energy Storage Technology Options: A White Paper Primer on Applications, Costs, and Benefits, Electric power research institute technical report, 2010 Search PubMed .
  10. E. Barbour, I. a. G. Wilson, I. G. Bryden, P. G. McGregor, P. a. Mulheran and P. J. Hall, Energy Environ. Sci., 2012, 5, 5425 Search PubMed .
  11. C. Wadia, P. Albertus and V. Srinivasan, J. Power Sources, 2011, 196, 1593–1598 CrossRef CAS .
  12. B. A. A. Andersson and I. RÃde, Transport Res. Transport Environ., 2001, 6, 297–324 CrossRef .
  13. J. L. Sullivan and L. Gaines, A Review of Battery Life-Cycle Analysis: State of Knowledge and Critical Needs ANL/ESD/10-7, Argonne national laboratory technical report, 2010 Search PubMed .
  14. M. F. Ashby and J. Polyblank, Granta Teaching Resources, 2012, 2, 38 Search PubMed .
  15. C. Augustine, R. Bain, J. Chapman, P. Denholm, E. Drury, D. Hall, E. Lantz, R. Margolis, R. Thresher, D. Sandor, N. Bishop, S. Brown, G. Cada, F. Felker, S. Fernandez, A. Goodrich, G. Hagerman, S. Heath, G. ONeil and K. Paquette, ‘Renewable Electricity Futures Study: Volume 2 Renewable Electricity Generation and Storage Technologies’, NREL TP-6A20-52409-2, 2012, vol. 2.
  16. D. MacKay, Sustainable Energy – Without the Hot Air, UIT Cambridge Limited, Cambridge, illustrate edn, 2009, vol. 78, p. 384 Search PubMed .
  17. P. Denholm and M. Hand, Energy Policy, 2011, 39, 1817–1830 CrossRef .
  18. M. Hand, S. Baldwin, E. DeMeo, J. Reilly, T. Mai, D. Arent, G. Porro, M. Meshek and D. Sandor, ‘Renewable Electricity Futures Study’, NREL TP-6A20-52409, 2012.
  19. IEA, Key World Energy Statistics, International energy agency technical report, 2010 Search PubMed .
  20. USDOE, Strategic Petroleum Reserve Annual Report for Calendar Year 2010 DOE/FE – 0545, United States Department of Energy Technical Report, November, 2011 Search PubMed .
  21. EIA, Underground Natural Gas Storage Capacity, Form EIA-191M and Form EIA-191A, U.S. energy information administration technical report, 2012 Search PubMed .
  22. S. M. Schoenung, Characteristics and Technologies for Long- vs. Short-Term Energy Storage. A Study by the DOE Energy Storage Systems Program SAND2001-0765, Sandia National Laboratories, U.S. Dept. of Energy Technical Report, March, 2001 Search PubMed .
  23. T. Reddy and D. Linden, Linden’s Handbook of Batteries, McGraw-Hill Prof Med/Tech, 4th edn, 2010, p. 1200 Search PubMed .
  24. R. A. Huggins, Energy Storage, Springer, New York, 1st edn, 2010, p. 400 Search PubMed .
  25. F. S. Barnes and J. G. Levine, Large Energy Storage Systems Handbook, CRC Press, Boca Raton, FL, 1st edn, 2011, p. 244 Search PubMed .
  26. Y.-F. Y. Yao and J. T. Kummer, J. Inorg. Nucl. Chem., 1967, 29, 2453–2475 CrossRef CAS .
  27. R. H. Radzilowski, Y. F. Yao and J. T. Kummer, J. Appl. Phys., 1969, 40, 4716 CrossRef CAS .
  28. S. Succar, Large Energy Storage Systems Handbook, CRC Press, Boca Raton, FL, 2011, ch. 5, pp. 111–153 Search PubMed .
  29. C. Rydh and B. Sandén, Energy Convers. Manage., 2005, 46, 1957–1979 CrossRef CAS .
  30. P. Denholm and Kulcinski, Energy Convers. Manage., 2004, 45, 2153–2172 CrossRef CAS .
  31. P. G. Hammond and C. Jones, Proc. Instn Civil. Engrs: Energy, 2008, 161, 4434–4443 Search PubMed .
  32. ESU-services, Abstract of LCIs, 2010, http://www.esu-services.ch/data/abstracts-of-lcis/ Search PubMed .
  33. USGS, Mineral Commodity Summaries, U.S. geological survey technical report, 2011 Search PubMed .
  34. Gabi, Gabi Software, Gabi 5, PE International, 2012 Search PubMed .
  35. R. T. Struck, M. D. Kulik and E. Gorin, Consolidation Coal Company, 1969 Search PubMed .
  36. P. Merier and G. Kulcinski, Life-Cycle Energy Cost and Greenhouse Gas Emissions for Gas Turbine Power, Fusion Technology Institute, University of Wisconsin-Madison Technical Report, December, 2000 Search PubMed .
  37. C. J. Rydh and B. a. Sandén, Energy Convers. Manage., 2005, 46, 1980–2000 CrossRef CAS .
  38. S. Succar and R. Williams, Compressed Air Energy Storage: Theory, Resources, and Applications for Wind Power Acknowledgments, Princeton Environmental Institute, Energy Systems Analysis Group Technical Report, April, 2008 Search PubMed .
  39. D. R. Wilburn and D. A. Buckingham, U.S. Geological Survey Scientific Investigations Report, 2006, p. 9 Search PubMed .
  40. G. M. Masters, Renewable and efficient electric power systems, John Wiley & Sons, Hobokon, NJ, illustrate edn, 2004, p. 654 Search PubMed .
  41. C. A. S. Hall, C. J. Cleveland and R. K. Kaufmann, Energy and Resource Quality: The Ecology of the Economic Process, Wiley Interscience, 1986, p. 602 Search PubMed .
  42. P. C. K. Vesborg and T. F. Jaramillo, RSC Adv., 2012, 15 Search PubMed .
  43. W. M. Brown, The Meaning of Scarcity in the 21st Century: Drivers and Constraints to the Supply of Minerals Using Regional, National and Global Perspectives Volume IV Sociocultural and Institutional Drivers and Constraints to Mineral Supply, U.S. geological survey open-file report 02–333 technical report, 2002 Search PubMed .
  44. D. Bauer, D. Diamond, J. Li, D. Sandalow, P. Telleen and B. Wanner, U.S. Department of Energy Critical Materials Strategy, U.S. Dept. of Energy Technical Report, December, 2010 Search PubMed .
  45. OECD/IEA, Renewable Energy Essentials: Hydropower, International Energy Agency Technical Report Figure 2, 2010 Search PubMed .
  46. USBR, Hydropower Resource Assessment at Existing Reclamation Facilities, United States Department of the Interior, Bureau of Reclamation, Power Resources Office Technical Report, March, 2011 Search PubMed .
  47. S. Benson, P. Cook, J. Anderson, S. Bachu, H. Nimir, B. Basu, J. Bradshaw, G. Deguchi, J. Gale, G. Goerne, W. Heidug, S. Holloway, R. Kamal, D. Keith, P. Lloyd, P. Rocha, B. Senior, J. Thomson, T. Torp, T. Wildenborg, M. Wilson, F. Zarlenga, D. Zhou, M. Celia, B. Gunter, J. King, E. Lindegerg, S. Lombardi, C. Oldenburg, K. Pruess, A. Rigg, S. Stevens, E. Wilson and S. Whittaker, IPCC Special Report on Carbon Dioxide Capture and Storage, Intergovernmental Panel on Climate Change, Cambridge, U.K., 2005, ch. 5 Search PubMed .
  48. I. Scott and S.-H. Lee, Large Energy Storage Systems Handbook, CRC Press, Boca Raton, FL, 2011, ch. 6, pp. 153–181 Search PubMed .
  49. M. Kintner-Meyer, P. Balducci, C. Jin, T. Nguyen, M. Elizondo, V. Viswanathan, X. Guo and F. Tuffner, Energy Storage for Power Systems Applications: A Regional Assessment for the Northwest Power Pool (NWPP), Pacific Northwest National Laboratory (PNNL), Battelle, United States Department of Energy Technical Report, April, 2010 Search PubMed .
  50. J. Eyer and G. Corey, Energy Storage for the Electricity Grid: Benefits and Market Potential Assessment Guide. A Study for the DOE Energy Storage Systems Program, February, 2010 Search PubMed .
  51. M. W. Hitzman, 2002, 24, 63–68.
  52. C. D. Wessells, R. a. Huggins and Y. Cui, Nat. Commun., 2011, 2, 550 CrossRef .
  53. M. Armand and J.-M. Tarascon, Nature, 2008, 451, 652–657 CrossRef CAS .
  54. J. Goodenough and M. Buchanan, Basic research needs for electrical energy storage, U.S. Department of Energy, Office of basic energy science technical report, 2007 Search PubMed

References from preface

Werner E (2022) California is awash in renewable energy — except when it’s most needed. The state has moved quickly to increase solar power, but can’t store it all for peak demand hours. The Washington Post. https://www.washingtonpost.com/us-policy/2022/09/21/california-is-awash-renewable-energy-except-when-its-most-needed/

Footnotes
† Electronic supplementary information (ESI) available: Storage capacity estimates, spatial footprint calculations and results. See DOI: 10.1039/c3ee24040a
‡ Strategic Petroleum Reserve: Large fossil fuel energy stores include the U.S. strategic petroleum reserve (SPR) and the North American underground natural gas storage network. The SPR stores 695.9 million bbl of oil (390 TW he) as of April 20, 2012 for emergency use.20 Underground natural gas storage is used to meet seasonal demand variations in natural gas use. Storage capacity of U.S. working gas (the total stored gas minus the cushion gas required to maintain pressure) has varied between 1600 and 3800 billion cf. (426 TW he) between 2006 and 2011.21 To convert these fossil fuel stores of energy to W he, we assumed that a bbl of oil and a cf. of gas contains 5.78 × 10⁶ and 1055 BTU of energy respectively. We assume a conservative conversion efficiency from thermal energy (BTU) to electrical energy (kW h) of 33%.
§ Lithospheric abundance data obtained viaref. 42. Geochemistry and fossil fuel consumption segregate Co, S and V as outliers. Cobalt naturally exists in mineral compounds usually extracted as co-products of nickel and copper mining.33 Isolating pure cobalt from various mineral ores is an expensive process. Today sulfur is obtained as an undesired by-product of oil and gas refining. Currently, sulfur is in oversupply which leads to stockpiling and a suppressed market price.33 The available supply of vanadium is uncertain because, presently, vanadium is primarily recovered as a by-product or co-product of mining and coal, crude oil, and tar sand refining.33 Vanadium is a unique case: it is obtained as a waste material from smelters and oil refineries. LCA analysis for vanadium varies significantly from 43 MJ to 3711 MJ per kg depending on whether vanadium is consider a primary product or a by-product.32,36
Posted in Alternative Energy, Batteries, Battery - Utility Scale, CAES Compressed Air, Mining, Peak Critical Elements, Pumped Hydro Storage (PHS) | Tagged , , , , , , , | 18 Comments

Lifespan of infrastructure, transportation, and buildings

Preface. What follows is from the International Energy Agency 2020 report “Energy technology perspectives” on how to transition to net zero emissions by 2050. This might require the replacement of just about everything, since power plants, steel blast furnaces, cement kilns, buildings, trucks, cars, buses and more that run fossil fuels now would have to be replaced or greatly modified to run on hydrogen, electricity, or other renewables since most of this infrastructure will last for decades, and much of it is quite young, especially in China. Though since oil peaked in 2018, the energy and time to do this are quite finite…

Consider dams for example. By 2050, more than half the global population will live downstream from tens of thousands of large dams near or past their intended lifespan. Most of the world’s nearly 59,000 big dams—constructed between 1930 and 1970—were designed to last 50 to 100 years.  Or less with climate change — extreme rainfall and flooding events are becoming more frequent, increasing the risk of reservoirs overflowing and accelerating the build up of sediment, which affects dam safety, reduces water storage capacity, and lowers energy production in hydroelectric dams.  16 percent of the world’s dams are in the United States, more than 85% of them already operating at or past their life expectancy (Hood 2021).

Alice Friedemann   www.energyskeptic.com  author of “Life After Fossil Fuels: A Reality Check on Alternative Energy”, 2021, Springer; “When Trucks Stop Running: Energy and the Future of Transportation”, 2015, Springer, Barriers to Making Algal Biofuels, and “Crunch! Whole Grain Artisan Chips and Crackers”. Podcasts: Collapse Chronicles, Derrick Jensen, Practical Prepping, KunstlerCast 253, KunstlerCast278, Peak Prosperity , XX2 report

***

Figure 1.12 Typical lifetimes for key energy sector assets

Notes: The red markers show expectations of average lifetimes while the blue bars show typical ranges of actual operation in years, irrespective of the need for interim retrofits, component replacement and refurbishments. “Buildings” refers to building structures, not the energy consuming equipment housed within. Examples of “urban infrastructure” assets include pavement, bridges and sewer systems.

The operating lifetime of some assets, especially those that produce materials or transform energy, can span several decades: this means that it could be a long time until they are replaced by cleaner and more efficient ones.

Figure 1.13 Age structure of existing fossil power capacity by region and technology in operation 2018 (source: Platts 2020a)

About 50% of the installed fossil-fired power generation capacity in China was built within the last ten years, and 85% within the last 20 years. The average age of coal plants is over 40 years in the United States and around 35 years in Europe, while it is below 20 years in most Asian countries, and just 13 years in China. Gas-fired power plants are generally younger: they are on average less than 20 years old in all major countries with the exception of Russia, Japan and United States, reflecting the fact that gas was only introduced as a fuel for power generation in many countries from the 1990s. Gas plants however have a shorter technical lifetime than coal plants. Of the 2 100 GW of coal-fired capacity in operation worldwide today and the 167 GW under construction, around 1 440 GW could still be operating in 2050 – 900 GW of it in China. Of the 1 800 GW of gas power plants in operation today and 110 GW under construction, only 350 GW are likely to still be operational in 2050.

Figure 1.14 Age profile of global production capacity for key industrial subsectors

Notes: CSAM = Central and South America. HVC = high-value chemicals. Average ages are calculated by region or country, depending on data availability, for 2019. Steel data are calculated based on plant-level data, while cement, ammonia, methanol and HVC calculations are based on historic data on capacity additions at the national level. Sources: Informed by capacity and production data from Steel Institute (2018), Wood Mackenzie (2018), IFA (2020), Platts (2020b), and USGS (2020).

In heavy industry sectors, China again takes centre stage (Figure 1.14). It accounts for nearly 60% of global capacity used to make iron from iron ore – the most energyintensive step in primary steel production. It also accounts for just over half the world’s kiln capacity in cement production and for around 30% of total production capacity for ammonia, methanol and high-value chemicals (HVCs) combined in the chemicals sub-sector. The majority of this capacity is at the younger end of the age range in each asset class, averaging between 10 and 15 years, compared with a typical lifetime of 30 years for chemical plants and 40 years for steel and cement plants. The range of ages of individual plants within the country varies considerably, but the output growth over the last 20 years in China’s steel (more than seven-fold) and cement (nearly fourfold) sub-sectors shows the relatively short time frame over which most of these installations have been added.

Our estimates for the steel industry’s key assets (blast furnaces and direct reduced iron [DRI] furnaces) incorporate plant-level information on the years when plants were most recently refurbished. Taking this information into account implies that European blast furnaces are among the most recently renewed plants on average (a theme discussed in Chapter 7).

The chemical sub-sector has a more even distribution of capacity both regionally and in terms of age than cement and steel industries. Several chemical facilities have been built in recent years in advanced economies such as the United States as well as in the Middle East. Most of the investment in methanol and HVC capacity has taken place in regions with access to low cost petrochemical feedstocks, particularly North America, Middle East and China. The shale revolution has made US ethane (a compound present in natural gas and a key petrochemical feedstock) comparable in price to ethane in the Middle East, leading to a re-balancing in the geographical spread of chemical production capacity. Methanol and HVC plants are on average around ten years old. Ammonia output growth has been slower than that of HVCs and methanol, with emerging economies generally adding these facilities early in their development, in step with agricultural development. Ammonia plants are on average 15 years old, and around 16 years old in China.

Figure 1.15 Building stock by year of construction and share of stock that remains in 2050

Note: Building floor area covers residential, commercial, services, education, health, hospitality, public and other non-residential sectors but excludes industrial premises. Sources: Informed by NRCan (2020), RECS (2020), CBECS (2020), and EU Commission (2020), NBS China (2020).

The energy conversion devices that lead to direct emissions in the buildings sector (e.g. natural gas combustion for space and water heating) have a short lifetime compared with power plants and industrial assets: they tend to last for around 15 years. However, the buildings in which they are housed will shape energy consumption and subsequent emissions from the sector for decades. The average age of the buildings stock is between 12 and 15 years for most emerging economies and 30 to 40 years for advanced economies. About half of today’s buildings stock is likely to be in use in 2050 (Figure 1.15). The average lifetime of a building varies from 30-50 years for commercial buildings to 70-100 years for modern residential construction and 150 years or more for historic buildings, although low-quality construction can reduce the lifetime of residential buildings to 30 years or less, especially in rapidly emerging economies (IEA, 2019g).

Around half of today’s buildings stock is likely still to be in use in 2050.

The age of a building tends to make a big difference to its heating and cooling needs. Buildings constructed before 1960 for example, can require three-times (or more) as much heat as those built in accordance with current building codes. Building energy codes increase efficiency and reduce energy needs, with the energy requirements of new buildings reducing by around 20% since 2000 globally and by more than 30% in the United States and the European Union8 (IEA, 2019h). However, the long life of buildings and a relatively small number of renovations means that overall progress is slow: around 60% of the global building stock in use today was erected when there were no code requirements regarding energy performance, and this rises to 85% or more in most emerging economies.

Figure 1.16 Age profile and geographic distribution of road transport vehicles

The global vehicle fleet is generally young, with about 70% of cars, trucks and buses being less than ten years old (Figure 1.16). The global passenger car fleet in 2019 reached about 1 billion vehicles. As cars age, many get exported from advanced economies to emerging economies where they may be driven for many more years. The lifetime of cars, trucks and buses is roughly comparable, but trucks in particular are used very intensively by their first owner over a period of three to five years, and as a result they are typically used infrequently for low-intensity operations by the time they reach a decade or more of age.

The past decade has seen a dramatic shift the location of where new cars are sold, with China surpassing the European and North American market in the early 2010s. Emerging economies have gone from accounting for less than 25% of new car sales in 2005 to making up about half of global sales today (IEA, 2019f). The result is that the car fleet in emerging economies is newer than in advanced ones. Around 85% of the cars on China’s roads are less than a decade old; in Europe, Japan and North America, cars manufactured within the past ten years make up only about 70% of the fleet. The same general pattern is seen with trucks and buses, but the shifts in new sales of each of these modes are even starker: the majority of trucks sold in the past decade are in emerging economies, as are two-thirds of the buses. With recent declines in car sales in China and India, global car sales may peak in the coming few years.

Figure 1.17 Age profile and geographic distribution of aircraft

While about 70% of the global aircraft fleet operating in 2019 was built after 2000, aircraft may continue to operate for 50 years or more (Figure 1.17). The median age of the fleet is around 15 years. Newer aircraft predominantly are providing additional capacity to service rapidly growing demand in Asian Pacific commercial passenger aviation markets. Aircraft operating in Europe are roughly of median age on average, while aircraft servicing the North American market tend toward the older end of the distribution range.

References

Hood M (2021) World’s ageing big dams pose ’emerging risk’. phys.org

Posted in Airplanes, Automobiles, Concrete, Dams, Electricity Infrastructure, Energy Infrastructure, Limits To Growth, Manufacturing & Industrial Heat, Oil & Gas, Transportation Infrastructure, Trucks | Tagged , , , , , , | 5 Comments

Far Out power #6: Stale beer, crayfish shells, and burning metal powder

Preface. Unfortunately, turning beer into biogas requires a pandemic so that it isn’t drunk at pubs instead. Scientists assure us there will be more pandemics as we mow down (rain)forests for shopping malls and come into contact with new viruses, so fair warning, buy the beer before it turns into biogas…

Alice Friedemann www.energyskeptic.com  author of “When Trucks Stop Running: Energy and the Future of Transportation”, 2015, Springer, Barriers to Making Algal Biofuels, and “Crunch! Whole Grain Artisan Chips and Crackers”. Podcasts: Collapse Chronicles, Derrick Jensen, Practical Prepping, KunstlerCast 253, KunstlerCast278, Peak Prosperity , XX2 report

* * *

2020. ‘Liquid Gold’: Stale beer turned into renewable energy in Australia. Euronews.

Millions of litres of beer have been lying stale in Australia’s pubs and clubs amid the coronavirus pandemic. But, rather than let it all go to waste, the expired beer is being converted into renewable energy to help power a wastewater treatment plant. The beer biodegrades under high temperatures in large digester tanks, using natural bacterial processes which release biogas. This biogas, in turn, generates electricity. At SA Water’s Glenelg Wastewater Treatment Plant, just west of Adelaide, the beer is combined with another type of waste, sewage sludge. Together, the blend creates a strong biogas which is used to power the whole facility. The wastewater plant has been re-purposing 150,000 litres of expired beer every week – enough to power 1,200 houses in total. 

Zejun L et al (2020) Synthesis of 3D-interconnected hierarchical porous carbon from heavy fraction of bio-oil using crayfish shell as the biological template for high-performance supercapacitors. Carbon.

The Chinese Academy of Sciences (CAS) made it possible to use crayfish shell as the biological template for high-performance supercapacitors. Shells were dried, ground and pretreated in an alkaline solution to retrieve templates, which were then mixed with the heavy fraction of bio-oil derived from agricultural waste to manufacture hierarchical porous carbons, a kind of supercapacitor material. This method possesses an environmentally friendly solution for the power storage problem of the rapidly growing market for wearable displays, electric vehicles and smartphones.

[ The best part I think are the yummy crawfish, if the researchers are tired of eating them at the laboratory, I am willing to help out ]

Burn Metal Powder

Ground very finely, iron powder burns at high temperatures, releasing energy as it oxidizes in a process that emits no carbon and produces easily collectable rust, or iron oxide, as its only emission. And other metals besides iron can be used. The two solid fuel boosters that helped the old U.S. space shuttle to reach its orbit each contained 80 tons of aluminum powder, which was 16% of the total weight of the solid fuel.

But metal powders are not renewable and are inefficient. They are an energy carrier, like hydrogen or batteries, not a primary energy source. Although energy return on invested is one way to think of whether a new kind of energy might work, and the energy needed to create metal powder is likely greater than the power you’d get from burning it, an even simpler consideration is that if an energy source isn’t primary then it will be an energy sink.

Burning iron powder to generate electricity could approach a theoretical efficiency around 40% with the other 60% lost in the steam turbine generation processes.

Since civilization would crash if trucks stopped running, the foremost problem the world faces is how to replace diesel fuel. But metal powders can’t be used in internal combustion engines, though it might be possible in a steam engine. But those are so huge and heavy, that like batteries, would keep a truck from going anywhere. And even if that problem were overcome, metal powder isn’t renewable and takes energy to create.

The idea is not to use metal powders as a primary energy source, but as a way to store, transport and trade it as a zero-carbon fuel.

After combustion, of course, you’re left with a pile of rust—iron oxide.

Bergthorson 2018 Recyclable metal fuels for clean and compact zero-carbon power. Progress in Energy and Combustion Science 68: 169-196

Blain L (2020) World first: Dutch brewery burns iron as a clean, recyclable fuel. Newatlas.com.

Hellemans A (2015) Metal Powder: the New Zero-Carbon Fuel? IEEE Spectrum.

Posted in Biofuels, Far Out | Tagged , , | Comments Off on Far Out power #6: Stale beer, crayfish shells, and burning metal powder

Not enough rare metals to scale up solar power


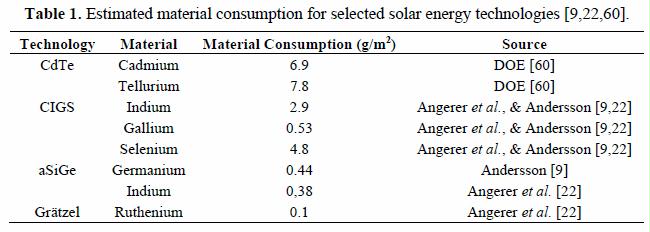
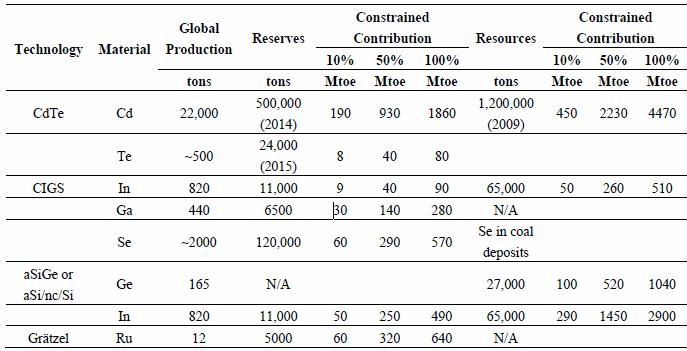
Preface. Sunshine may be free, but the materials to make solar contraptions sure aren’t.  Since sunshine arrives in a diluted form, vast expanses of solar photovoltaic panels will be needed to produce the world’s 24,000 Terawatt hours of electrical power that are now mainly generated by highly energy dense fossils such as oil and coal. Some people have taken as tab at how much land:

  • 586,000 square km (226,256 square miles) of the Earth’s surface with solar panels to generate all the world’s energy needs (here)
  • 496,805 square kilometers (191,817 square miles) (here)

The authors diminish how huge this would be by dismissing this area as a small fraction of global land, but it’s not just the expense or area of panels.  Add on the immense amount of energy and expense for roads, transmission lines, substations, and replacing the panels every 18 to 25 years (Ferroni and Hopkirk 2016).  And for what? This site and my books “When trucks stop running” and “Life after fossil fuels” explain why electricity can’t run heavy-duty transportation or manufacturing. End of story. Solar panels can’t be made or delivered to their final site.

Leena and Höök (2015) looked at the materials required to scale solar generation up to Terawatts of power, and found that CdTe, CIGS, a-Si and ruthenium-based Grätzel solar cells will all be limited by material availability and only able to provide small shares of the present world energy consumption. This is because they depend on Indium, tellurium, germanium, ruthenium, and other materials having a potentially tight supply due to their scarcity, difficulty of being recycled, and competition with other products (i.e. pigments, coatings, plastics, alloys, electronic devices, lasers, diodes, LED lights, metallurgy). Yes, there are indeed Limits to Growth.

Silver was not investigated, but a recent analysis indicated that silver could form a serious bottleneck for the large scale construction of concentrated solar power (the mirrors) and silicon technologies that use silver as an electrode material [19].

Solar panels and wind turbines not only need rare metals, they are embedded in a system that needs them too — rechargeable batteries, computers, the electric grid, complex circuits, require specific rare metals such as neodymium, electronic indium, silver, praseodymium, dysprosium, and terbium (Thompson 2018).

For solar and wind alone, neodymium and indium production need to grow by more than 12 times by 2050, neodymium by seven times, and silver  three times, yet dozens of other industries need them as well (Exter 2018).

Ten percent of global energy is used in mining.  It takes a lot of fossil fuels to  mine, blow up hillsides to get at rocks, transport ore, crush ore, mill into fine pieces and infuse with chemicals, smelt in a blast furnace, fabricate into parts, and ship to assembly factories.  Lower grade ores are even more energy intense, so the production of rare minerals will also be constrained by energy shortages in the future.  And a financial downturn could limit the production of minerals as well.

Peak conventional oil arrived in 2018, yet new mines take 10-20 years to construct. Time is running out.

And there simply aren’t enough minerals and energy on earth to make a transition to “renewables”: Simon P. Michaux (2021) The mining of Minerals and the Limits to growth video

Alice Friedemann  www.energyskeptic.com Women in ecology  author of 2021 Life After Fossil Fuels: A Reality Check on Alternative Energy best price here; 2015 When Trucks Stop Running: Energy and the Future of Transportation”, Barriers to Making Algal Biofuels, & “Crunch! Whole Grain Artisan Chips and Crackers”.  Podcasts: Crazy Town, Collapse Chronicles, Derrick Jensen, Practical Prepping, KunstlerCast 253, KunstlerCast278, Peak Prosperity

* * *

Leena, G., Höök, M. (2015) Assessing Rare Metal Availability: Challenges for Solar Energy Technologies. Sustainability 7: 11818-11837

Abstract: Solar energy is commonly seen as a future energy source with significant potential. Ruthenium, gallium, indium and several other rare elements are common and vital components of many solar energy technologies, including dye-sensitized solar cells, CIGS cells and various artificial photosynthesis approaches. This study surveys solar energy technologies and their reliance on rare metals such as indium, gallium, and ruthenium. Several of these rare materials do not occur as primary ores, and are found as byproducts associated with primary base metal ores. This will have an impact on future production trends and the availability for various applications. In addition, the geological reserves of many vital metals are scarce and severely limit the potential of certain solar energy technologies. It is the conclusion of this study that certain solar energy concepts are unrealistic in terms of achieving TeraWatt (TW) scales.

Continued oil dependence is environmentally, economically and socially unsustainable [1]. Peaking of conventional oil production has been a topic of interest for more than 50 years [2]. Anthropogenic emissions of greenhouse gases and potentially harmful climatic change are strongly connected to future hydrocarbon combustion [3], so reducing fossil fuel use has been an integral part of climate negotiations. All this has resulted in renewed interest in alternative energy systems. IPCC states that the present energy system is not sustainable and that the solar energy could become a significant contributor to the energy infrastructure [4].

Solar energy is commonly seen as a future energy source with significant potential. The amount of energy that the Earth receives from the sun in a single hour is many times greater than the combined output of fossil energy. Harvesting this abundant solar influx could, in theory, supply mankind with all the energy it demands for millions of years.

However, Ion concluded that the supply potential of an energy source is generally dependent on concentration [5]. Numerous inexhaustible energy sources exist, but their practical significance is often hampered by low energy density. This applies to solar energy as it arrives in dilute form (up to 2500 kWh/m2 annually depending on location) requiring significant area in comparison with more concentrated energy sources such as coal or nuclear.

To mitigate the low energy concentration in solar rays, numerous technical solutions have been put into practice while others are being developed. Photovoltaic solar cells of various types capable of converting the solar rays directly to electricity are already in the market, while concentrating solar power based on thermal cycles is another solution. Another possibility is artificial photosynthesis, aiming at mimicking natural photosynthesis, which can convert solar energy to carbohydrates or even hydrogen for easy storage and human consumption. New renewable energy forms (geothermal, solar energy, wind) only account for roughly 1.1% of the primary energy consumed in the world [6]. IPCC estimates that direct solar energy constitutes only 0.1% of the primary energy supply [7].

The path to a solar future is long, and significant amounts of work, research and development remain before solar energy will be a major energy supplier.

It is also necessary to investigate solar energy feasibility using a life-cycle perspective. Power plant installations consume concrete, steel, plastics and similar everyday materials that are available in relative abundance and can be easily produced.

Other materials are uncommon or even rare and can only be produced in small volumes or by complex measures. Some of these rare materials, mainly metals, are essential parts in certain solar energy technologies.

Historically, the most important obstacle for solar energy has been high costs in relation to competing energy sources. If economics are disregarded and future solar energy systems assumed to achieve a globally significant scale, the underlying reliance on rare metals might appear as one limiting factor. Ruthenium, gallium, indium and several other metals are essential components of certain solar energy technologies, such as dye-sensitized cells, thin-film cells and other innovative solar energy technologies. More general approaches have also raised the importance of rare metals for high technology such as the CRM Innonet (Critical Raw Materials Innovation Network) financed by the European Commission [8].

The infrequent occurrence of these rare materials makes it necessary to ask whether they could limit the growth of future solar energy expansion plans. Some researchers have already considered material constraints for future solar energy applications [9–12]. There are assessments of natural resource requirements for renewable energy systems, but they often dismiss potential resource constraints on inadequate grounds [13,14]. In this study, geological endowment of important minerals and the required production methods for obtaining usable products are discussed. Reserve and resource data were compiled from various geological assessments, mainly from the United States Geological Survey [15]. Based on the findings, rough estimates are calculated for possible electricity production based on respective PV technologies. The findings are finally discussed from a sustainability perspective.

Solar Energy and Rare Metals.  The resource base for solar energy can be regarded in practical terms as limitless. However, due to the dilute nature of solar energy, only a small fraction of this energy flow can be transformed into a form usable for society. A useful metaphor is the distinction between tank and tap. Although the tank may be enormous, it is the size of the tap that matters for users. It is only incoming solar radiation that can be transformed into useful energy that matters for society. Thus, electricity is the required output from most solar energy systems.

Some solar thermal technologies aim to use the heat of solar radiation for direct heating or for powering conventional steam cycles. These systems generally rely on mirrors that concentrate solar energy on a single point or a line. Fresnel lenses and parabolic troughs are simple and inexpensive approaches that can achieve temperatures of 400–600 °C. Point focusing systems are more complex, but can reach temperatures as high as around 1200 °C. Solar-powered Stirling engines [16], parabolic trough systems [17], and concentrating solar power systems [18] have all been discussed more comprehensively by others. The mirrors are plated with silver due to the high optical reflectivity of this metal. Silver is not investigated in further detail in this study, but a recent analysis indicated that silver could form a serious bottleneck for the construction of concentrated solar power on a large scale [19].

Photovoltaics (PV) or solar cells are alternative ways of harvesting solar energy by converting light directly into electricity. Today, roughly 90% of the PV market is dependent on silicon [20]. Current and foreseeable solar energy markets will probably be dominated by silicon technologies. Silicon-based PV systems, forming the first generation of solar cells, will not be discussed in any detail since silicon is a common material. However, silicon technologies commonly use silver as an electrode material and this dependence is discussed in detail by Grandell and Thorenz [19].

Thin-film photovoltaics are referred to as second generation PV technologies. These involve several approaches dependent on rare metals. Third generation photovoltaic technology has currently reached a pre-market stage. Such technologies include dye-sensitised solar cells (DSSC), organic solar cells, and other novel approaches.

Thin-Film Solar Cells consist of thin photoactive layers, typically in the range of 1–4 µm thick, leading to a light-weight structure. A semiconducting material is deposited on a common material such as glass or polymer. The need for semiconducting material is greatly reduced and could be up to 99% less compared to c-Si based technology [21]. However, cost advantages from low material use are somewhat offset by a lower electricity generation efficiency. Silicon thin-films can be produced by chemical vapor deposition. Depending on the process, one can obtain amorphous, microcrystalline or polycrystalline structures. The solar cells made from these materials tend to have lower energy conversion efficiency than bulk silicon, but the production technology is very cost effective. The semiconducting material can be deposited on cheap materials, and both flat and curved surfaces are possible. As a transparent conducting oxide, typically an indium-tin-oxide (ITO) film with a thickness of 60 nm will be sputtered on the p-side of the semiconductor [22]. Amorphous silicon suffers from optically induced conductivity changes that lead to efficiency losses, resulting from the Staebler-Wronski effect [23], but this can be alleviated by doping Ge into the structure. The efficiency of the cells is in the range of 11.6% [24].

Tellurium is classified as a critical metal [21], and is used in cadmium-telluride (CdTe) technology, which is currently the most commercially successful thin-film application in the market. The band gap of CdTe cells is 1.4 eV, which is very close to the ideal value of 1.5 eV [25]. Modules have achieved 17.5% efficiencies and the best reported cell efficiencies are as high as 20.4% [24].

CIGS cells are another successful thin-film technology based on a compound semiconductor made of copper, indium, gallium, and selenide. Copper/indium/selenide (CIS) and copper/gallium/selenide (CGS) form a solid solution with the chemical formula of Cu(InxGaz)Se2, where the value of x can vary from 1 (pure copper indium selenide) to 0 (pure copper gallium selenide). The material is a tetragonal chalcopyrite crystal structure, and a band gap can be varied between 1.04 eV (CIS) and 1.7 eV (CGS) through different material combinations [25]. Recently 15.7% module efficiency has been reported [24]. Selenide can also be substituted by sulfur.

Dye-Sensitized Solar Cells function on a different principle than first and second generation technologies. The incoming light is absorbed by a dye sensitizer that is anchored to the surface of a mesoporous oxide film, typically TiO2. The dye gets excited by a photon, and the resulted electron is injected into the conduction band of the film. The electrons diffuse to the anode and are conducted over an external load to the cathode. The construction of the solar cell and its operation principle are explained in detail by Gong [26].

The appeal of dye sensitized solar cells is that they rely on fairly abundant and inexpensive materials.

Manufacturing does not require elaborate equipment, and the simplicity of this type of solar cell can potentially lead to good price/performance ratio. However, the most efficient cells generally rely on dyes that are derived from rare metals.

The dye is essential for photovoltaic performance and needs to be carefully selected to fulfill several technical requirements related to light absorption, ability to anchor the dye on the semiconducting oxide, electron transfer properties between the dye and the semiconductor oxide and stability. Thus far, the dyes are based on metal complexes of ruthenium. These dyes are superior to all other known dyes in terms of light absorption. The highest performance achieved is 11.1%, exhibited by the black dye, an atrithiocyanato-ruthenium complex [26]. Other approaches on an organic metal-free basis are being developed [27].

The idea of a Concentrating Photovoltaic System is to generate concentrated illumination with the help of systems of lenses or mirrors. The concentration factor can vary from 2 suns (low concentration) to 100 suns (medium concentration) or up to 1000 suns (high concentration). The concentrated solar radiation is then directed to a small area of high-efficiency multijunction (MJ) solar cells.

Multijunction systems are currently the most proficient PV systems and can reach over 44% efficiency [24]. The fundamental difference between multi-junction solar cells and c-Si solar cells is that there are several junctions connected in series instead of one. This is to better cover the solar spectrum. To achieve a working MJ cell, various suitable materials are placed in layers. Each layer is optically in series, with the highest band gap material at the top. The first junction receives the entire incoming spectrum. Photons above the band gap of the first junction are absorbed in the first layer. Photons below the band gap of the first layer pass through to the lower layers to be absorbed there.

The thermodynamic Carnot cycle efficiency can be approached if all solar photons can be converted to electricity. In theory, it can be shown that 59% efficiency can be achieved with four junction devices [28] and as the number of junctions approaches infinity, the efficiency can reach as high as 68% [29]. However, it is difficult to construct such opto-electronically matched junctions, and thus commercial devices are either tandem or triple-junction cells. Typical materials used in multi-junction cells are InGaP (band gap 1.67 eV) for top layers, GaInAs or GaAs (1.18 eV) for middle layers and Ge (0.66 eV) as a bottom layer [30].

There are various emerging solar cell technologies, still far from commercial markets. Organic photovoltaics (OPV) are based on cheap, abundant, non-toxic materials and a high-speed roll-to-roll manufacturing process. However, problems related to low conversion efficiency and instability over time make it difficult to foresee the future potential of the technology. Other novel technologies still in the fundamental development phase include quantum dots or wires, quantum wells, and super lattice technologies [21].

Technologies aimed at mimicking photosynthesis are also a way of converting solar energy to satisfy human needs. These approaches are commonly grouped in a field known as artificial photosynthesis. They are not directly similar to photovoltaics, but also tend to rely on rare metals. Natural photosynthesis uses light-harvesting complexes to collect incident photons, which participate in chemical reactions to produce carbohydrates and oxygen from carbon dioxide. However, natural photosynthesis observed in plants has very low efficiencies (typically ~1%) for biomass production and this has stimulated great interest in creating an artificial counterpart with higher efficiency [31].

Artificial photosynthesis could be used to convert and store solar energy as carbohydrates or alternatively as hydrogen. In theory, this could solve many of the intermittency problems that are related to more conventional forms of solar energy. The rare metal ruthenium is a key component in many approaches and may be a limiting factor for implementation.  other platinum-group metals and nickel might constitute alternatives [32].

Occurrence of Rare Elements

Many of the rare metals used in solar cells occur in low concentration within the Earth’s crust. Most do not occur as primary ores, and are only found as by-products associated with primary base metal and precious-metal ores. This section briefly reviews the geological abundance of some rare elements used in solar energy applications.

Cadmium is primarily extracted from zinc ores, mainly from sphalerite deposits. Cadmium has chemical properties similar to zinc’s and can replace it in crystal lattices of certain ores. Sphalerite ore contains 3%–11% zinc along with 0.0001%–0.2% cadmium and less than 0.0001%–0.01% indium, copper, silver, iron, gold, germanium and thallium [12]. Carbonate-hosted sphalerite in Mississippi Valley-type (MVT) deposits have high cadmium concentrations, while sedimentary exhalative (sedex) occurrences have low concentrations [33]. Certain coals can also have relatively high cadmium content, but they are all sub-economic for the moment [15].

The estimated abundance of indium is 0.1 ppm in the earth’s crust, making it the 69th most abundant element [34]. However, indium is highly dispersed in nature and enriched deposits of economic interest are rare. A comprehensive overview of indium and its mineralogy has been conducted by Schwarz-Schampera and Herzig [35]. Indium is only recovered as a by-product from zinc-sulfide ore mineral sphalerite [15]. Indium can also be found as trace element in deposits of other base metals, but it is generally difficult to process and extract it economically.

Gallium can be found in low concentration in many ores. Burton et al. [36] investigated the presence of gallium in 280 minerals and determined the crustal abundance to be 17 ppm, while Emsley [34] gives an average concentration of 18 ppm. Andersson [9] notes that gallium is approximately as abundant as copper but seldom forms any enriched mineralisation. In contrast, copper is enriched by a factor of 200–800 in mined ores, while gallium rarely occurs in minable concentrations. Such differences will have significant repercussions for production feasibility. Gallium only seems to be concentrated in certain oxide minerals, primarily bauxite but also corundum and magnetite [36]. Bauxite ores contain from 0.003% to 0.008% gallium [37]. World resources are estimated to be 2 million tonnes in bauxite deposits and 6500 tons in zinc deposits [38]. Recent works have also identified certain coals as potentially massive sources [39], although only a small part of the gallium can be recovered in practice [15].

Germanium occurs primarily through silicate minerals in the earth’s crust due to ionic substitution with the silicon ion. Typical concentrations are a few ppm. Moskalyk gives a mean concentration of 6.7 ppm [40], while Höll et al. states an average of 1.7 ppm [41]. The highest enrichments can be found in non-silicate formations as zinc/copper-sulphides, primarily low-iron sphalerite, or in certain coals [42]. In addition, fly ash from certain coals can contain as much as 1.6%–7.5% germanium [40], and may be an important source if proper recovery methods are developed. Furthermore, high concentrations have been commonly found in iron-nickel meteorites, and this suggests that major shares of the earth’s germanium may reside in the planetary core [42]. A review of germanium and its occurrence have been provided by Höll et al. [41].

Both selenium and tellurium are found in low concentrations in copper ores and commonly recovered as side-products from copper refining [43]. Additionally, selenium occurs at concentrations between 0.5 and 12 ppm in various coals, which equals a much larger resource base than the worlds copper ores (USGS, 2015) [15]. Yodovich and Ketris reviewed selenium in coal and pointed out that coal ash has enriched selenium concentrations [44]. However, recovering selenium from coal does not appear likely due to the high volatility of the material [12]. World selenium reserves are estimated to be 120,000 tons derived from copper ores [15].

Tellurium is the 72nd most abundant element in the Earth’s crust, with 5 ppb. Some tellurium minerals are found in nature such as calaverite, sylvanite or tellurite, but are not mined [34]). USGS estimates the world tellurium reserves to be 24,000 tons based on identified copper ores [15], but also mentions the possibility of recovering tellurium from certain gold-telluride or lead-zinc ores. Over 90% of tellurium is produced from anode slimes from copper refining, which can contain as much as 8% tellurium [34].

Ruthenium and platinum are rare elements that occur together with other platinum-group metals. The largest platinum-group metal deposit is the Bushveld Complex in South Africa [15]. Nearly 90% of the world’s known platinum reserves are located in South Africa [45], while other deposits can be found in Russia, North America, and Zimbabwe, and only to a smaller degree in other countries [15]. Andersson highlighted how this dominance of a single country would make platinum group metal supply sensitive to monopolistic behavior and geopolitical issues [9].

Production and Future Outlooks

Mining and processing of ore deposits requires mining, rock blasting, transportation, crushing, milling, and different chemical procedures. The conversion form ore to a marketable commodity is usually an energy intensive process.

Moving to low grade ores inescapably requires more energy input per unit mass unless technological improvements can offset the disadvantages caused by lower ore grades.

As a consequence, production of materials derived from low concentration ores will be sensitive to future energy prices, especially when moving towards lower and lower ore grades.

The rare materials used in several solar technologies chiefly occur as byproducts of base metal ores. Platinum is an exception; PGMs are mined as well as by-products and primary products. As a result, future production of those materials is intrinsically linked to the base metal production. This relationship makes it challenging to significantly increase production of by-products without increasing the production of the main product.

Base Metal Production

About 90% of all zinc production is accomplished by the electrolytic process, while 10% rely on older pyrometallurgical treatment. For lead production, after sintering, lead is usually smelted in a blast furnace. Smelting frees the metal from the oxidized form. About half of lead originates from recycled sources [47]. Copper production is mainly (80%) done by pyrometallurgical processing of sulphide ores, with the remainder being hydrometallurgical treatment of oxide ores. Fthenakis et al. provide a comprehensive overview of copper and zinc production and their flow schemes [12]. Treatment of various residues is the main feedstock for recovering numerous other metals, such as indium or cadmium, as by-products.

More than half of the present world mine production of lead comes from China [15]. In addition, 58% of the global zinc mine production originates from China, Australia and Peru. Nearly 55% of present world copper production originates from Chile (31% alone), USA, Peru, and China. Global production of base metals is not evenly distributed, intrinsically affecting the recovery and supply of by-products.

A similar situation can be seen for bauxite mining and aluminum production. Bauxite is converted via Bayer process to alumina, an aluminum oxide, which is further electrolysed to obtain pure metal. World production of bauxite and aluminum has increased significantly after 1950

Australia and China presently account for roughly 55% of the world bauxite production, and China alone also accounts for 47% of global aluminum production [15].

World production of base metals is unevenly distributed with significant concentration in a few countries, resembling the situation for world supply of fossil fuels [48,49].

Occurrences have been identified in all over the world, but many of them are sub-economic or otherwise unattractive deposits. However, it should be specifically noted that geological abundance has little to do with the likelihood of significant future production, as actual recovery must be both technically and socioeconomically feasible. As a consequence, seemingly abundant but dilute formations may never be attractive for mining, while scarce but highly concentrated deposits can be attractive to exploit.

Recovery of By-Products

Hartman finds that significant shares of the gallium reserves will not be produced in any foreseeable time, simply because they are a by-product of bauxite mining and have to be primarily governed by future aluminum demand [50]. Gallium is extracted from bauxite in conjunction with aluminum oxide based on the Bayer process [37]. The second recovery method involves electrolytic processes with mercury, allowing gallium extraction after addition of caustic soda. Despite environmental challenges surrounding mercury, this method is employed many countries. The last recovery method is based on chelating agents and addition of diluted acids, eventually making gallium recoverable by direct electrolysis. Moskalyk has provided a more comprehensive overview of the production methods and the worldwide suppliers of gallium, which is produced by a small number of producers and world primary production is currently in the order of 400 tons, with additional gallium derived from recycling of scrap electronics containing GaAs.

Germanium production usually consists of two stages, where the first step creates a concentrate and the second is the actual recovery. Hydrometallurgical processes using precipitation are generally preferred. In comparison, thermal and pyrometallurgical processes have inherent complications with the volatility of germanium oxides and sulphides and their environmental challenges. Moskalyk compiled a review of worldwide germanium production and suppliers [40].

More than 90% of the world’s tellurium is recovered from anode slimes collected from electrolytic copper refining, and the remainder is a by-product of lead refineries and from bismuth, copper, and lead ores [15]. Anode slimes are primarily treated to recover gold, silver, platinum, palladium and rhodium, while selenium and tellurium are of secondary priority [12]. The actual percentage of tellurium recovery from anode slimes is variable and depends on concentration. Recovery is done by cementation with copper to form copper telluride. This is further processed to a sodium telluride solution with caustic soda and air. In the next step pure tellurium metal or tellurium oxide are produced for solar cell applications. Fthenakis et al. have compiled a more detailed overview of tellurium production [12]. Important tellurium producing countries are Japan, Russia, and Canada [15].

Cadmium production originates from smelting of zinc and lead-zinc ores. The cadmium sponge, a by-product from precipitating zinc sulphate solution at the zinc smelter is almost pure cadmium (more than 99% purity) and is used as the main feedstock in cadmium recovery facilities [43]. Fumes and dust from zinc sinter plants are also important feedstock for further purification. Comprehensive overview of cadmium recovery processes have been made by Safarzadeh et al. [51]. Commonly, cadmium is seen as a highly toxic metal and cadmium disposal is connected to environmental hazards. Thus, recovering cadmium from primary and secondary sources is of great importance [51]. China and South Korea are the largest producers and account for roughly half of world production, followed by Kazakhstan, Canada, Japan and Mexico [15]. Additionally, recycling of Ni-Cd batteries is also a source for cadmium.

Indium production is similar to cadmium and recovery is chiefly done as a by-product from collected dust, fumes, and other residues from zinc refining. Advantages in indium recovery processing have now increased, and extraction rates have reached 75% of the treatable residues [52]. Many details on the actual production technology are proprietary, but some general recovery methods based on standard methods and general information from producers have been compiled by Fthenakis et al. [12]. More discussions on indium production and worldwide suppliers have been conducted by Alfantazi and Moskalyk [52] and Fthenakis et al. [12]. More than 50% of the world’s primary indium production originates from China [15].

Mined platinum group metal (PGM) ores are initially crushed and grinded before being concentrated in a froth flotation process. Addition of water, air, and chemicals created a froth containing the PGM metals and is collected. Following the matte-smelting process, high purity platinum is refined through a series of hydrometallurgical processes [45]. Ruthenium is recovered as a byproduct during platinum-group metal refining. This is mainly done through insolubility in aqua regia, which leaves a solid residue that can be refined to obtain pure ruthenium, osmium, and other commonly associated metals. Solvent extraction has been described as a method [53], although very little details are available for ruthenium refining methods presently in use. Figure 4 shows the production of indium, selenium and PGMs.

Competition from Non-Solar Energy Sectors

Many of the critical metals discussed here also have important uses other than solar energy applications. Therefore, it can be argued that the assumption that all the available reserves or production of the rare materials would go to solar energy pursuits is unrealistic.

In reasonable cases, only a share of the metal flows would be available for solar energy solutions. How large this share will become is a complicated question and will be affected by several factors, such as how the metals’ intensity in solar applications and the competing markets will evolve. What are the perspectives for substitution, substituting materials or substituting technologies and approaches both in the solar sector and the competing markets?

More than 80% of the world’s cadmium is used to make rechargeable batteries, but other important uses are for pigments, coatings, and platings, stabilizers for plastics, alloys and photovoltaics. However, due to environmental and health concerns significant effort has been made to replace cadmium with other less toxic substances [15].

Gallium has been described as a backbone of the electronics industry and constitutes an important component in semiconductors, diodes and laser systems. Gallium arsenide for semiconductor applications makes up 95% of global gallium consumption [37]. Only some 2% of the produced GaAs is consumed by photovoltaic industry, whereas other uses include electric circuits, laser technology, diodes, and LED lights [22].

The photovoltaic industry is the most important end-use segment of tellurium with a 40% market share. It is followed by thermoelectric modules, which function as a small heat pump and are based on semiconducting materials. Other uses include metallurgy and the rubber industry [54]. Currently photovoltaics form a niche market for selenium, whereas 40% of selenium is consumed for the production of electrolytic manganese, which is a key material component for alkaline and litium-ion batteries. Other uses for selenium are found in the glass industry, agriculture, pigments and metallurgy [54]. About 90% of indium flows in the production of ITO (indium-tin-oxide), which is a transparent, conducting foil used in flat display panels and thin-film coatings. Other end-uses include solders, cryogenics, and special alloys. The electrical industry, including photovoltaics, is responsible for only 3% of the global indium consumption [55].

Ruthenium is used for creating wear-resistant electrical contacts, thick film chip resistors, and for various catalyst applications. The electrical industry is the most important ruthenium consuming sector, with a market share of over 60% [57]. Currently almost no ruthenium is used in the photovoltaics and solar energy industries.

In summary, many of the materials used here will be subjected to competition regarding usage. In some places it is possible to switch to substitutes, but likely several sectors will continue to rely on the same rare metals that several solar energy technologies are built around. The kind of financial repercussions this will bring should be investigated more closely and taken into account in any holistic study of economic long-term feasibility.

Recycling of Scarce and Rare Metals

Valero and Valero point out that there is no substitute for metals if they are irretrievably dispersed by human use [58].  Therefore, recycling is an important factor for making the best possible use of produced metals and should be encouraged. To some extent, recycled material can also help with balancing production from mining by alleviating mismatches in supply and demand.

However, recycling does not increase recoverable volumes. It is only a way to reuse some of the already mined materials again and prevent them from being locked up in scrap heaps or waste disposals. It is important to remember that recycling is only something that makes the use of materials more sustainable while it is incapable of removing intrinsic limits caused by recoverable volumes.

Some of the metals discussed here are already extensively recycled or reused—gallium in particular, as the world primary gallium production capacity in 2011 was estimated to be between 260 and 320 tons, while the recycling capacity was 198 tons [15].

This analysis uses the amount of known global metals reserves or resources as bases and calculates the maximum PV electricity production, which can be achieved with the given amount of metal. One can thus argue that this approach intrinsically includes recycling with the very optimistic assumption of a 100% recycling rate.

Material Consumption of Solar Technologies

Harvest solar energy is often seen as abundant, rich, and lasting supply of energy without any practical constraints. That is not entirely true, as the conversion technologies are dependent on raw material inputs necessary for construction. Solar energy technologies harvest renewable energy, but there are no such things as renewable power plants. Material availability or production bottlenecks may lead to significant constraints for the necessary building components for solar energy technologies.

This section explores whether scarcity of certain key materials may provide an upper limit for some selected solar energy technologies. Similar studies were performed by Andersson and others [9,59]. No good material consumption estimates could be found for artificial photosynthesis approaches, but it is expected to be at a similar magnitude as the other solar energy technologies.

Material requirement per square meter for solar energy is a key property, as the incoming energy must be harvested over large areas. Table 1 gives some estimated material consumptions for relevant technologies. These consumption figures are based on a 100% material utilization [9,22], which is optimistic because it entirely ignores process losses. However, this optimistic assumption may compensate for some of the potential reductions in material requirements since year 2000.

Leena 2015 available reserves and solar limits

Solar insolation can be as high as over 2000 kWh/m2 per annum at excellent sites like the desert areas of Sahara or in Australia, where clouds are virtually nonexistent. For comparison the global average insolation value is 1700 kWh/m2. The average value for Central Europe and Northern Europe is in the range of 1000 kWh/m2.

The last two columns in Table 2 give the annual electricity production of the respective solar technology, assuming that 50% or 100% of the respective world material reserves are devoted to solar cell fabrication. For comparison, the present global primary energy demand is over 13,371 million tons of oil equivalents (MTOE) [6].

A more comprehensive study would naturally use more realistic assumptions about solar hours related to geographical location into account than in this study. However, we do not believe that such details would change the overall picture that material constraints pose a challenge for moving solar technology from its present small scale (134 GWp installed capacity by the end of 2013, resulting in ~14 Mtoe globally) to production of globally significant amounts of energy [61].

Even though the consumption of rare materials is only a few grams per square meter, the diffuse influx of solar energy requires large areas to provide significant energy amounts. This results in considerable material use that could possibly surpass production capacity and resource availability for rapid growth rates.

Available reserves and resources were mostly taken from the USGS where available [15]. Reserve (or resource) data on some metals did not allow the USGS to make estimates compatible with their standards. In such cases, reserve estimates were taken from other sources: ruthenium, germanium [34], indium [62], gallium [38], and germanium [63].

Leena 2015 Table 2 supply constraints

Table 2. Potential contribution to future world energy supply constrained by available reserves and resources. Three cases with 10%, 50% and 100% diversions to solar energy applications were considered. For comparison, world primary energy consumption in 2014 was slightly more than 13,000 Mtoe, final energy consumption 4700 Mtoe and electricity consumption 1600 Mtoe [6].

Table 2 shows the results of the analysis in a matrix with respect to global reserves—and when possible to global resources—and with three different resource allocations to the solar sector, namely 10%, 50% and 100%. Depending on competing end-uses for the critical metals, different resource allocations seem reasonable. Global reserves reflect those deposits, which can be mined with current technology economically. Thus, figures related to reserves show a minimum level of how much solar energy can be produced with the technologies in question. Global resources can be understood as an upper limit. The estimations are very uncertain, and for some metals, even missing, and therefore estimations based on resources should be viewed critically.

  1. Discussion

For CdTe the constraining metal is tellurium. Currently 40% of the annual tellurium markets are consumed in the photovoltaic industry. The USGS does not give any resource estimation for reasons of data accuracy, and therefore the estimation used in the analysis refers to global tellurium reserves. In this case and assuming 50% market share, electricity production from CdTe panels would be limited to 40 Mtoe annually. However the reserve figure considers only tellurium from the anode slimes of copper refining with a currently relatively low recovery rate of approximately 40%. Fthenakis argues that the recovery rate could technically be as high as the recovery rate for copper in the electrolytic refining process, 80%. Even higher rates, such as 95% for gold, would technically be possible [64]. The question is more economical in nature, i.e., whether the price of tellurium is a sufficient incentive for higher recovery rates. In addition to copper mines, other geological reserves for tellurium exist, such as by-product in lead-zinc ores, primary tellurium mines, ocean crusts and sour oil and gas [65]. However, no resource estimation exists for these additional sources and therefore they are excluded from the analysis. Also the material intensity has a potential for remarkable improvements by a factor of four as shown by Woodhouse et al.: the efficiency can be almost doubled while, at the same time, the active layer thickness can be cut to 1 µm. It is however, not yet clear to what extent this potential will become reality for commercial applications [66]. In the optimistic case, this would allow more than 300 Mtoe or 3500 TWh of annual electricity production. This is comparable with the cumulative capacity of 0.9–1.8 TWp until 2050 modelled by Fthenakis [64].

Grätzel cells are constrained by the availability of ruthenium, which is currently used mostly in the electrical industry. Even if half of the known reserves were devoted to solar cell production, only some 300 Mtoe could be annually produced. CIGS technology is constrained by both indium and gallium. Indium is consumed currently to 90% for ITO production. Even if all available indium resources were to be used in the solar industry—an unrealistic assumption—a maximum of some 500 Mtoe as annual production seems plausible. Another technology dependent on indium is based on amorphous silicon. The dependency on germanium can be avoided by a tandem structure, which also has a stabilizing effect on the efficiency of the module. Thus, the constraining metal is indium. ITO films are also used beside solar energy in various other application areas such as flat panel displays, plasma displays or touch panels. Therefore, the upper limit for electricity produced by amorphous silicon seems to be in the range of some hundreds of Mtoe annually.

Silicon is the second most abundant element in the Earth’s crust, making up approximately one fourth of it when measured by mass. However, Grandell and Thorenz foresaw a problem with scaling up silicon technologies due to material constraints from silver, commonly used as an electrode material, and estimated the upper limit to be some 13,000 TWh annual electricity production or 1000 Mtoe [19]. This estimate is based on a very low silver content (0.82 g/m2), which already reflects a technical approach to reduce silver consumption, such as the “wrap through technology” or substitution of silver with copper, both of which are currently in development stage. Indium currently used in ITO could possibly be replaced by FTO (fluorine doped tin oxide) and AZO (aluminium doped zinc oxid).

The above mentioned figures can be compared with world primary energy consumption (13,000 Mtoe), world final energy consumption (4700 Mtoe) or world electricity production (1600 Mtoe). All figures refer to the year 2014 [6]. The world energy sector is expected to experience a shift away from fuels towards electricity due to climate concerns and energy security questions. Currently one third of the global final energy consumption is due to the traffic sector, mainly consisting of oil consumption. In the future this will be to a large degree electricity consumption. Additionally, the rising economies in the developing world are another factor stressing the need for more electricity production. If we assume that 50% of the currently known global resources of Te and 10% of the resources of Ru and In are devoted to the solar industry, we could generate 500 Mtoe, or in the most optimistic case, 800 Mtoe of solar electricity annually. Additionally c-Si technology provides more potential for PV electricity generation, but the technology is constrained by silver dependence and it remains to be seen to which degree new approaches with decreased silver content will enter the market.

If a future global energy system based on solar energy is sought, it is vital to consider material challenges or alternatively focus on other technological pathways than those explored here. A practical path for future research is use of alternative and more abundant materials if solar energy is to become a sustainable backbone of the global energy system. Todorov et al. showed that thin-films based on the abundant copper-zinc-tinchalcogenide kesterites (Cu2ZnSnS4 and Cu2ZnSnSe4) could reach over 9.6% conversion efficiency [67]. The selenium usage in these cells could in theory be entirely replaced by sulphur, creating a thin-film cell only relying on abundant materials. For certain other technologies, such as dye-sensitized cells, it would be fairly easy to replace scarce or rare materials with more abundant ones. Organic dyes that do not required noble metal complexes have been discussed by Hara et al. [68].

  1. Conclusions

When summarizing several promising solar energy technologies, it was found that they rely on several critical metals as important components. Many technologies are likely going to face constraints in material supply if scaled to the TW level (Table 2). Material questions are an important factor for the development of several future solar energy technologies. Without a holistic treatment of required material questions, solar energy production outlooks should be regarded with sound skepticism. Increasing demand for scarce materials may become a factor of importance in the future. Many of the unusual materials are key ingredients to various technologies, including several of the more promising solar energy applications.

There are prospects for reducing material requirements by significant amounts for CIGS and CdTe by utilizing even thinner films and advanced light trapping technologies [9,66]. Large scale development of the studied solar technologies would likely require either substantial reductions in material intensity, technical advancements in electricity generation efficiency or increased world mineral reserves as well as significant increases in mine production.

These results points to obstacles for certain solar technologies when it comes to reaching a TW scale. Indium, tellurium, germanium and ruthenium are in potentially tight supply. Research and development paths that aim to circumvent the dependence on rare materials are generally encouraged from a longer perspective. Additionally, the constraints imposed by nature on critical metals may direct solar energy research to usage of other materials in the long run. Solar energy technologies that do not require rare elements are the only feasible technology for large-scale implementation. CdTe, CIGS, a-Si and ruthenium-based Grätzel cells will all be limited by material availability and only able to provide small shares of the present world energy consumption (Table 2). It is important to use CIGS, CdTe and the other technologies discussed in this study as bridges to alternative and less limited solar energy applications.

References

Exter PV, et al. 2018. Metal demand for renewable electricity generation in the Netherlands. Universiteit Leiden.

Ferroni F, Hopkirk RJ (2016) Energy Return on Energy Invested (ERoEI) for photovoltaic solar systems in regions of moderate insolation. Energy Policy 94: 336–344

Thompson A. 2018. We Might Not Have Enough Materials for All the Solar Panels and Wind Turbines We Need. Popular Mechanics.

  1. International Energy Agency (IEA). World Energy Outlook 2014; Organisation for Economic Co-operation and Development OECD/IEA: Paris, France, 2014.
  2. Miller, R.G.; Sorrell, S.R. The future of oil supply. Philos. Trans. R. Soc. A 2014, doi:10.1098/rsta.2013.0179.
  3. Höök, M.; Tang, X. Depletion of fossil fuels and anthropogenic climate change—A review. Energy Policy 2013, 52, 797–809.
  4. Edenhofer, O.; Pichs-Madruga, R.; Sokona, Y.; Farahani, E.; Kadner, S.; Seyboth, K.; Adler, A.; Baum, I.; Brunner, S.; Eickemeier, P.; et al. (Eds.) Climate Change 2014: Mitigation of Climate Change. Contribution of Working Group III to the Fifth Assessment Report of the Intergovernmental Panel on Climate Change; Cambridge University Press: Cambridge, UK; New York, NY, USA, 2014.
  5. Ion, D.C. World energy supplies. Proc. Geol. Assoc. 1979, 90, 193–202.
  6. International Energy Agency (IEA). Key World Energy Statistics 2014. Available online: http://www.iea.org/publications/freepublications/publication/key-world-energy-statistics-2014.html (accessed on 20 March 2015).
  7. Edenhofer, O.; et al. (Eds.) IPCC Special Report on Renewable Energy Sources and Climate Change Mitigation; Prepared by Working Group III of the Intergovernmental Panel on Climate Change; Cambridge University Press: Cambridge, UK; New York, NY, USA, 2012; p. 1075.
  8. CRM Innonet. Available online: http://www.criticalrawmaterials.eu/ (accessed on 13 May 2015).
  9. Andersson, B.A. Materials availability for large-scale thin-film photovoltaics. Prog. Photovolt. Res. Appl. 2000, 8, 61–76.
  10. Feltrin, A.; Freundlich, A. Material considerations for terawatt level deployment of photovoltaics. Renew. Energy 2008, 33, 180–185.
  11. Fthenakis, V. Sustainability of photovoltaics: The case for thin-film solar cells. Renew. Sustain. Energy Rev. 2009, 13, 2746–2750.
  12. Fthenakis, V.; Wang, W.; Kim, H.C. Life cycle inventory analysis of the production of metals used in photovoltaics. Renew. Sustain. Energy Rev. 2009, 13, 493–517.
  13. Davidsson, S.; Höök, M.; Wall, G. A review of life cycle assessments on wind energy systems. Int. J. Life Cycle Assess. 2012, 17, 729–742.
  14. Davidsson, S.; Wachtmeister, H.; Grandell, L.; Höök, M. Growth curves and sustained commissioning modelling of renewable energy: Investigating resource constraints for wind energy. Energy Policy 2014, 73, 767–776.
  15. U.S. Geological Survey (USGS). Mineral Commodity Summaries. Available online: http://minerals.usgs.gov/minerals/pubs/mcs/ (accessed on 30 March 2015).
  16. Kongtragool, B.; Wongwises, S. A review of solar-powered Stirling engines and low temperature Differential Stirling engines. Renew. Sustain. Energy Rev. 2003, 7, 131–154.
  17. Price, H.; Lüpfert, E.; Kearney, D. Advances in Parabolic Trough Solar Power Technology. J. Sol. Energy Eng. 2002, 124, 109–125.
  18. Treib, F.; Nitsch, J.; Kronshage, S.; Schillings, C.; Brischke, L.A.; Knies, G.; Czisch, G. Combined solar power and desalination plants for the Mediterranean region—Sustainable energy supply using large-scale solar thermal power plants. Desalination 2003, 153, 39–46.
  19. Grandell, L.; Thorenz, A. Silver supply risk analysis for the solar sector. Renew. Energy 2014, 69, 157–165.
  20. 20. Fraunhofer ISE. Photovoltaics Report (2014) Updated:24 October 2014. http://www.ise.fraunhofer.de/en/downloads-englisch/pdf-files-englisch/photovoltaics-report-slides.pdf
  1. International Renewable Energy Agency (IRENA). Renewable Energy Technologies: Cost Analysis Series. Volume 1: Power Sector. Solar Photovoltaics. https://www.irena.org/DocumentDownloads/Publications/RE_Technologies_Cost_AnalysisSOLAR_PV.pdf
  2. Angerer, G.; et al. Rohstoffe für Zukunftstechnologien. Einfluss des branchenspezifischen Rohstoffbedarfs in rohstoffintensiven Zukunftstechnologien auf die zukünftige Rohstoffnachfrage; Fraunhofer IRB Verlag: Stuttgart, Germany, 2009.
  3. Staebler, D.L.; Wronski, C.R. Optically induced conductivity changes in discharge-produced hydrogenated amorphous silicon. J. Appl. Phys. 1980, 51, 3262–3268.
  4. Green, M.A.; Emery, K.; Hishikawa, Y.; Warta, W.; Dunlop, E.D. Solar cell efficiency tables (version 44). Prog. Photovolt Res. Appl. 2014, 22, 701–710.
  5. Kemell, M.; Ritala, M.; Leskelä, M. Thin Film Deposition Methods for CuInSe2 Solar Cells. Crit. Rev. Solid State Mater. Sci. 2007, 30, 1–31.
  6. Gong, J.; Liang, J.; Sumathy, K. Review on dye sensitized solar cells (DSSCs): Fundamental concepts and novel materials. Renew. Sustain. Energy Rev. 2012, 16, 5848–5860.
  7. Hwang, S.; Lee, H.W.; Park, C.; Lee, H.; Kim, C.; Park, C.; Lee, M.H.; Lee, W.; Park, J.; Kim, K.; et al. A highly efficient organic sensitizer for dye-sensitized solar cells. Chem. Commun. 2007, 46, 4887–4889.
  8. King, R.R.; Bhusari, D.; Larrabee, D.; Liu, X.Q.; Rehder, E.; Edmondson, K.; Cotal, H.; Jones, R.K.; Ermer, J.H.; Fetzer, C.M.; et al. Solar cell generations over 40% efficiency. Prog. Photovolt. Res. Appl. 2012, 20, 801–815.
  9. Birkmire, R.W. Compound polycrystalline solar cells: Recent progress and Y2 K perspective. Sol. Energy Mater. Sol. Cells 2001, 65, 17–28.
  10. Guter, W.; et al. Current-matched triple-junction solar cell reaching 41.1% conversion efficiency under concentrated sunlight. Appl. Phys. Lett. 2009, doi:10.1063/1.3148341. 31. Concepcion, J.V.; House, R.L.; Papanikolas, J.M.; Meyer, T.J. Chemical approaches to artificial photosynthesis. Proc. Natl. Acad. Sci. USA 2012, 109, 15560–15564.
  11. Osterloh, F. Inorganic Materials as Catalysts for Photochemical Splitting of Water. Chem. Mater. 2008, 20, 35–54. 33. Schwartz, M.O. Cadmium in Zinc Deposits: Economic Geology of a Polluting Element. Int. Geol. Rev. 2000, 42, 445–469.
  12. Emsley, J. Nature’s Building Blocks: An A-Z Guide to the Elements, 2nd ed.; Oxford University Press 2011.
  13. Schwarz-Schampera, U.; Herzig, P.M. Indium: Geology, Mineralogy, and Economics; Springer: Heidelberg, Germany, 2002; p. 257.
  14. Burton, J.D.; Culkin, F.; Riley, J.P. The abundances of gallium and germanium in terrestrial materials. Geochim. Cosmochim. Acta 1959, 16, 151–180.
  15. Moskalyk, R.R. Gallium: The backbone of the electronics industry. Miner. Eng. 2003, 16, 921–929.
  16. Greber, J.F. Gallium and Gallium Compounds. In Ullmann’s Encyclopaedia of Industrial Chemistry, 6th ed.; John Wiley & Sons: Hoboken, NY, USA, 2002; p. 30080. 39. Dai, S.; Ren, D.; Li, S. Discovery of the superlarge gallium ore deposit in Jungar, Inner Mongolia, North China. Chin. Sci. Bull. 2006, 51, 2243–2252.
  17. Moskalyk, R.R. Review of germanium processing worldwide. Miner. Eng. 2004, 17, 393–402.
  18. Höll, R.; Kling, M.; Schroll, E. Metallogenesis of germanium—A review. Ore Geol. Rev. 2007, 30, 145–180.
  19. Bernstein, L.R. Germanium geochemistry and mineralogy. Geochim. Cosmochim. Acta 1985, 49, 2409–2422.
  20. Fthenakis, V. Life cycle impact analysis of cadmium in CdTe PV production. Renew. Sustain. Energy Rev. 2004, 8, 303–334.
  21. Yudovich, Y.E.; Ketris, M.P. Selenium in coal: A review. Int. J. Coal Geol. 2006, 67, 112–126.
  22. British Geological Survey. Mineral Profile, Platinum. Available online: http://www.bgs.ac.uk/ mineralsUK/statistics/mineralProfiles.html (accessed on 30 March 2015).
  23. Rosa, R.N.; Rosa, D.R.N. Exergy cost of mineral resources. Int. J. Exergy 2008, 5, 532–555.
  24. International Lead and Zinc Study Group. Statistics. Available online: http://www.ilzsg.org/static/ statistics.aspx?from=5 (accessed on 15 April 2015).
  25. Höök, M.; Hirsch, R.; Aleklett, K. Giant oil field decline rates and their influence on world oil production. Energy Policy 2009, 37, 2262–2272.
  26. Höök, M.; Zittel, W.; Schindler, J.; Aleklett, K. Global coal production outlooks based on a logistic model. Fuel 2010, 89, 3546–3558.
  27. Hartman, H.L. SME Mining Engineering Handbook, 1st ed.; Society for Mining, Metallurgy & Exploration Inc.: Ann Arbor, MI, USA, 1992; p. 2394.
  28. Safarzadeh, M.S.; Bafghi, M.S.; Moradkhani, D.; Ilkchi, M.O. A review on hydrometallurgical extraction and recovery of cadmium from various resources. Miner. Eng. 2007, 20, 211–220.
  29. Alfantazi, A.M.; Moskalyk, R.R. Processing of indium: A review. Miner. Eng. 2003, 16, 687–694.
  30. Khan, M.A.; Morris, D.F.C. Application of solvent extraction to the refining of precious metals II. purification of ruthenium. Sep. Sci. Technol. 1967, 2, 635–644.
  31. Selenium Tellurium Development Association. Available online: www.stda.org (accessed on 30 March 2015).
  32. Polinares. Fact Sheet: Indium. Polinares Working Paper Nr. 39. Available online: http://www.polinares.eu/ docs/d2-1/polinares_wp2_annex2_factsheet5_v1_10.pdf
  33. USGS. Minerals Yearbook 2012. Germanium [Advance release]. Available online: http://minerals. usgs.gov/minerals/pubs/commodity/germanium/myb1-2012-germa.pdf (accessed on 15 March 2015). 57. Matthey, J. Platinum 2012; Johnson Matthey Public Limited Company: Hertfordshire, UK, 2012; p. 64.
  34. Valero, A.L.; Valero, A. A prediction of the exergy loss of the world’s mineral reserves in the 21st century. Energy 2011, 36, 1848–1854.
  35. Andersson, B.A.; Jacobsson, S. Monitoring and assessing technology choice: The case of solar cells. Energy Policy 2000, 28, 1037–1049.
  36. U.S. Department of Energy. Critical Materials Strategy. Available online: http://energy.gov/sites/ prod/files/DOE_CMS2011_FINAL_Full.pdf (accessed on 15 April 2015). 61. International Energy Agency (IEA). PVPS Report: Snapshot of Global PV 1992–2013. Preliminary Trends Information from the IEA PVPS Programme. http://www.iea-pvps.org/fileadmin/dam/public/report/statistics/PVPS_report_-_A_Snapshot_of_ Global_PV_-_1992-2013_-_final_3.pdf
  37. Mikolajczak, C. Availability of Indium and Gallium. http://www.commodityi ntelligence.com/images/2010/jan/11%20jan/availability_of_indium_and_galliumwhite_papermik olajczak_sept09.pdf
  38. Elsner, H.; Melcher, F.; Schwarz-Schampera, U.; Buchholz, P. Elektronikmetalle—Zukuenftig steigender Bedarf bei unzureichender Versorgungslage?; Commodity Top News Nr. 33; BGR: Berlin, Germany, 2010.
  39. Fthenakis, V. Sustainability metrics for extending thin-film photovoltaics to terawatt levels. MRS Bull. 2012, 37, 1–6.
  40. Houari, Y.; Speirs, J.; Candelise, C.; Gross, R. A system dynamics model of tellurium availability for CdTe PV. Prog. Photovolt. Res. Appl. 2014, 22, 129–146.
  41. Woodhouse, M.; et al.; Eggert, R. Perspectives on the pathways for cadmium telluride photovoltaic module manufacturers to address expected increases in the price for tellurium. Sol. Energy Mater. Sol. Cells 2013, 115, 199–212.
  42. Todorov, T.K.; Reuter, K.B.; Mitzi, D.B. High-Efficiency Solar Cell with Earth-Abundant Liquid-Processed Absorber. Adv. Mater. 2010, 22, E156–E159.
  43. Hara, K.; Sato, T.; Katoh, R.; Furube, A.; Yoshihara, T.; Murai, M.; Kurashige, M.; Shinpo, A.; Ito, S.; Suga, S.; et al. Novel Conjugated Organic Dyes for Efficient Dye-Sensitized Solar Cells. Adv. Funct. Mater. 2005, 15, 246–252.
Posted in Alternative Energy, Mining, Peak Critical Elements, Peak Rare Earth Elements, Photovoltaic Solar, Recycle, Recycling | Tagged , , , , , , , | 5 Comments

Why rare and valuable metals are not recycled

metal recycling ratesGlobal estimates of end-of-life recycling rates for 60 metals and metalloids. Source: Reck, B. K. et al. 2012. Challenges in Metal Recycling. Science 337: 690-695

Preface. This is a post about why rare and critical metals aren’t recycled at all or at best, just a small percent. Basically it is still cheaper to mine them from scratch than to try to separate them out from electronic devices, and often impossible since they are an alloy or embedded with other metals that chemicals, heat, pressure and other techniques can’t separate out.

Mining and smelting ores is incredibly energy intensive.  As ore quality declines, it will require more and more energy to crush the rock to get the metals out.  But oil quality is declining too (tar sands, fracked oil, and Venezuelan heavy oil require so much energy to process the energy return is very low.  And worse yet, oil is declining and will get more scarce and expensive (world peak oil production peaked in 2018).  Electric mining trucks? Ha. Most sites are too far from the grid, and what electricity they do have comes from diesel powered generators.

Recycling harms health. Especially lead. One in three of the world’s 2.4 billion children under age 20 has a blood level exceeding what would trigger public health alarms in the U.S. The potent neurotoxin can reduce a child’s intelligence test score and cause other health problems; lead poisoning is blamed for nearly $1 trillion of lost lifetime earnings. Most lead enters the environment through poorly regulated smelters that recycle car batteries. Lead poisoning has worsened considerably during the past 2 decades because car sales in those countries have tripled, the report says. Scientists consider no amount of lead exposure safe, but the U.S. Centers for Disease Control and Prevention has set the threshold for action at 5 micrograms per deciliter—the level met or exceeded in 800 million children worldwide (Science 2020).

Alice Friedemann  www.energyskeptic.com  Author of Life After Fossil Fuels: A Reality Check on Alternative Energy; When Trucks Stop Running: Energy and the Future of Transportation”, Barriers to Making Algal Biofuels, & “Crunch! Whole Grain Artisan Chips and Crackers”.  Women in ecology  Podcasts: WGBH, Financial Sense, Jore, Planet: Critical, Crazy Town, Collapse Chronicles, Derrick Jensen, Practical Prepping, Kunstler 253 &278, Peak Prosperity,  Index of best energyskeptic posts

* * *

The more intricate a product and the more minerals used, the better it will perform, but the more difficult it is to recycle the metals essential to making it work so well to begin with

With infinite amounts of energy, money, and time metals could be recycled.  But in the real world it doesn’t happen due to the high cost, complex processes, and large amount of energy it takes to separate material, as well as poor recycling technologies, product design, and social behavior.

Less than 1% of 34 rare and critical metals are recycled.  These metals are essential for microchips, solar PV, consumer electronics — pretty much all high-tech products have them. 

But it is simply thermodynamically impossible to separate and recover many of them since they’re used in such tiny amounts for extremely precise purposes, and mixed with other rare metals (Bloodworth 2014, Reck 2012).

Metals such as tantalum, gallium, germanium, and rare-earth elements are oxidized and lost in the smelter slag (Hageluken 2012).

The most commonly recycled metals are also the cheapest and most abundant on the planet, such as steel, aluminum, copper, zinc, lead, and nickel, with rates often over 50%.  This high recovery rate is due to their presence in relatively pure form in large amounts in products. But even these are reused 2 or 3 times before being lost to landfills.

The methods to recover rare metals are far more complex.  These metals are used in myriad applications, from cell phones to satellites. Up to 60 different elements go into the manufacture of microprocessors and circuit boards (Gunn 2013), usually in tiny quantities and often in combinations not found in nature.

The need to recycle is obvious — only by doing so can the life of these resources be extended to future generations, since ores continue to be of lower and lower grades that need more energy to extract while at the same time the oil, coal, and natural gas energy needed to extract minerals is diminishing.

Even the valuable precious metals only have a recycling rate of 60%, and just a 50% recovery of platinum, palladium, and rhodium from auto catalytic converters because so many old cars are exported to developing countries that don’t have recovery technology.  For the same reason, when it comes to the platinum group metals in electronics, the rate is even lower, just 5 to 10%.

Many of these metals are highly toxic to plants and animals, yet they’re recycled at very low rates, one of the reasons a fifth of China’s arable land is polluted with toxic heavy metals (Chin 2014). One of the worst, cadmium, is mainly recycled from nickel-cadmium batteries, but at very low rates.  Mercury recovery is at best 10-20% recovered from fluorescent light bulbs.  Ecotoxicity from metal-containing nanomaterials is also a problem.

The US Geological survey estimates the average recycling rate for most metals is 50% (Papp 2007). This means that after just 4 recycles, we’ve lost 95% of the original amount.

This is a shame, because most metals used in electronic devices use rare earth metals for which there is no substitution with the same efficiency.  And a shortage of some looms, the reserves-to-production ratio for gallium, germanium, and indium (indispensable for touch screens and other displays) is estimated to be less than 20 years of supply (Frondel et al. 2006).  Less than 1% of rare elements are cycled from e-waste. It’s too expensive to recycle them, so they end up in furnaces burned up with the plastic boards containing them.  The few places rare earth metals are recovered don’t want to share their proprietary methods with other potential recyclers.

Worse yet, planned obsolescence is alive and well.  Objects are still designed to break down and impossible to repair, forcing customers to buy a new one.

Thermodynamics is the ultimate limitation at the final processing stage and can’t be separated out.

Material is lost along the way

  1. Initial collection: a fraction of overall electronic equipment is turned into recycling centers, the percent depends on social and government factors.
  2. Recycling centers: much of the electronic waste is sent to countries that have inadequate recycling facilities
  3. Preprocessing & Sorting – some components are too much effort to take apart, so they’re discarded. Nor is there enough material to justify the cost of machine recycling technology.
  4. Recycling technology: Usually just shredding, crushing, magnetic sorting is done.  It’s too expensive to recover even more with lasers, near-infrared, or x-ray sorting.
  5. Product design: often makes it hard to separate products out, such as laminated permanent magnets in computers.
  6. Smelter – the easier, larger, most common metals make it to the smelter, i.e. iron, aluminum, etc.  Not all material that was collected and could be smelted reaches the smelters, especially if smelters are distant.

Downcycling (Bardi 2014).

One of the big problems with waste recycling is known as “downcycling”, because the recycled material isn’t as good as the original product. Consider steel.  Although we recycle 68% of iron and steel, the problem is that the original steel was custom-made for a particular application to be hard or strong or corrosion resistant.  This is done by adding other elements and creating an alloy with the needed properties (i.e. chromium, cobalt, silicon, manganese, vanadium, and other elements).  Trying to control the concentration of these other metals during recycling is so complex and expensive that it usually isn’t done.  As a result, recycled steel is lower-quality since it can’t be counted on to be as hard, strong, or corrosion-resistant and can’t be re-used in many industries.

Every time paper is recycled its fibers get shorter which makes an inferior product. Downcycling prevents perpetual recycling.

Similarly, when different kinds of plastics are mixed the resulting plastic has poor mechanical properties with limited uses.

Beverage cans have magnesium mixed in with the aluminum, requiring several more stages of separation to be transformed back into pure aluminum.

In all cases, recycling grows more difficult as the recycled fraction increases or higher performance is needed from the recycled material.

In the end, that takes more money and energy, which is why economically justifiable recycling is far less than 100%.  Rare metals like indium and gallium are not recycled at all.

Biellow, David. 9 Aug 2012. Recycling Reality: Humans Set to Trash Most Elements on the Periodic Table. Scientific American

Almost all lead is recycled, among the only elements on the periodic table to earn that distinction. With good reason, mind you: the soft metal is a potent neurotoxin known to impact children’s brain development, among other nasty health effects. Today, nearly all lead is used in batteries (though it was once put into gasoline, leading to widespread contamination, and, in places like Afghanistan, still is.) Most of this dangerous element is now endlessly cycled from battery to battery, thanks to stringent regulations (though enough of it ends up being improperly recycled to constitute one of the world’s worst pollution problems.)

In principle, all metals are infinitely recyclable and could exist in a closed loop system, note the authors of a survey of the metals recycling field published in Science on August 10. There’s a benefit too, because recycling is typically more energy-efficient than mining and refining raw ore for virgin materials. Estimates vary but mining and refining can require as much as 20 times the amount of energy as recycling a given material. Think about it: a vast amount of energy, technology, human labor and time are expended to get various elements out of the ground and then that element is often discarded after a single use.

Lead is not alone in being recycled, of course. Aluminum, copper, nickel, steel and zinc all boast recycling rates above 50% (though not much above 50%). The same principles can be usefully applied to other materials, like plastics. After all, these ubiquitous polymers are made from another scarce resource oil and many are, in principle, recycleable. Yet, the overall recycling rate for plastics, grouped as a whole, is only 8% (as of 2010, per EPA numbers.) Take the case of polypropylene (or #5 plastic if you’re checking the bottom of your food containers). The bulk of this polymer that gets recycled comes from car batteries. It is, in essence, tagging along with the lead. In other cases water bottles, yogurt cups, you name it it simply disappears into the nation’s landfills.

Meanwhile, the majority of elements on the periodic table and we use almost every element on the periodic table for something or other are also nearly completely unrecycled.

As an example, industrial ecologists Barbara Reck and T.E. Graedel of Yale University compare the fates of nickel versus neodymium. Nickel is ubiquitous, particularly as an alloy for steel. Of the 650,000 metric tons of the silvery-white metal that reached the end of its useful life in one product in 2005, roughly two-thirds were recycled. And that recycled nickel then supplied about one-third of the demand for new nickel-containing products. That means the overall efficiency of human use of nickel approaches 52%. Not bad, but there’s room for improvement, given that almost half of all nickel is only used once before it is discarded.

Nearly 16,000 metric tons of neodymium a so-called rare earth metal were employed in 2007, mostly for permanent magnets in everything from hybrid cars to wind turbines. Roughly 1,000 metric tons of the element reached the end of its useful life in one product or another and “little to none of that material is currently being recycled,” the survey authors note. This despite the fact that a “rare earth crisis” stems from China’s near monopoly of the neodymium trade.

Mining for neodymium is not benign (which is why the world lets China monopolize its production). And it’s not just neodymium. Mining waste or tailings, leach ponds, slurries and the like are among the world’s largest chronic waste problems. North America alone produces 10 times as much mining waste as it does the municipal solid waste (as it’s known) from all the neighborhoods in the U.S. Much of that is just rock, sand and dust the mountaintop in mountaintop removal mining. And mined products also cause waste further down the product line, such as the ash leftover after the coal is burned (the U.S.’s largest single form of waste).

This issue of profligate use gets worse: we are currently making this problem even harder to solve. How? One word: gadgets. In most gadgets you can think of, tiny amounts of rare elements are used to enhance functionality. As the industrial ecologists write in Science: “The more intricate the product and the more diverse the materials set it uses, the better it is likely to perform, but the more difficult it is to recycle so as to preserve the resources that were essential to making it work in the first place.” It’s as true of iPhones as it is of photovoltaic panels and none of them have shown much success in being recycled. “End of life losses will also increase sharply soon,” unless something changes, the industrial ecologists warn.

Then there are the alloys, where thermodynamics dictate that the alloying element is almost always going to be lost due to the difficulty of separation. That means the chromium used in stainless steel will usually lose its luster, for example. Worse, this form of contamination can mean that the recycled alloy can’t be re-used manganese-aluminum alloys are unsuitable once recycled for 95 percent of the uses for aluminum. As a result, “current designs are actually less recycleable than was the case a few decades ago,” the authors note. Perhaps the use of such metal combinations should be minimized?

In the end, our approach to recycling is bizarre, given our resources. “Few approaches could be more unsustainable,” Reck and Graedel write. In the end, we’ll learn to reuse all the elements of the periodic table, or we’ll lose elements to use.

REFERENCES

Bardi, Ugo. 2014. Extracted: How the Quest for Mineral Wealth Is Plundering the Planet. Chelsea Green Publishing.

Bloodworth, A. 2014. Track flows to manage technology-metal supply. Recycling cannot meet the demand for rare metals used in digital and green technologies. Nature 505: 19-20.

Chin J, et al. 2014. China details vast extent of soil pollution. About a fifth of nation’s arable land is contaminated with heavy metals. Wall Street Journal.

Frondel, M., et al. 2006. Trends der angebots- und nachfragesituation bei mineralischen rohstoffen. Federal ministry of economics and energy.

Gunn, A. G. 2013. In Proc. 12th Bienn. Soc. Geol. Appl. Miner. Depos. Meet (SGA, 2013)

Hageluken, C et al. 2012. Precious Materials Handbook, Ch 1. Hanua-Wolfgang.

Papp, J. F. 2007. 2005 minerals yearbook: recycling—metals. U.S. Geological Survey.

Pihl, E., et al. 2012. Material constraints for concentrating solar thermal power. Energy 44: 944-954

Reck, B. K. et al. 2012. Challenges in Metal Recycling. Science 337: 690-695

Science. 2020. News at a glance. One in three children poisoned by lead.

Wadia, C. et al. 2009. Materials Availability Expands the Opportunity for Large-Scale Photovoltaics Deployment. Environ. Sci. Technol 43: 2072-2077


Posted in Peak Critical Elements, Peak Platinum Group Elements, Peak Precious Elements, Peak Rare Earth Elements, Recycle, Recycling, Ugo Bardi | Tagged , , , , , , , , | 5 Comments

What are rare earth metals and how are they used?

Preface.  After oil, the main feature of new products will be drastic simplification. The re-use of existing stuff. Lack of precision machine tools as they rust away. Back to basics: wood, iron, and clay.

Yet every high-tech object depends on critical, rare earth, platinum group, and precious metals that are often controlled by just China or one or two other nations.  At least there are dozens of countries to import oil from. But China is building mines all over the world and that makes supply chains quite vulnerable, especially as China uses its own metals to make products and not export these elements.  They’re gaining such control that it’s like Saudi Arabia buying up all the other oil fields in the world. And they not only control the mined minerals, they control the entire supply chain all the way up to finished products.

Mining is one of the most nasty, polluting, activity on earth. It uses 10% of fossil energy, so it can’t survive oil decline.  And because the remaining ores are so dispersed and have low concentrations of metals, it takes more and more energy to get them at a time when energy is declining.

Clearly rebuildable devices like wind and solar, which depend on hundreds of other devices like computers, electronics, satellites, and so which all are built with rare earth elements is not sustainable, clean, or green. A pyrrhic victory for China, turning their landscapes into Mordor for flash-in-the-pan temporary electronic goods while the oil age lasts.

Alice Friedemann www.energyskeptic.com  author of “Life After Fossil Fuels: A Reality Check on Alternative Energy”, April 2021, Springer, “When Trucks Stop Running: Energy and the Future of Transportation”, 2015, Springer, Barriers to Making Algal Biofuels, and “Crunch! Whole Grain Artisan Chips and Crackers”. Podcasts: Collapse Chronicles, Derrick Jensen, Practical Prepping, KunstlerCast 253, KunstlerCast278, Peak Prosperity , XX2 report

***

Light rare earths:  (La) Lanthanum (Ce) Cerium (Pr) Praseodymium (Nd) Neodymium (Sm) Samarium

Heavy rare earths: (Eu) Europium (Gd) Gadolinium (Tb) Terbium (Dy) Dysprosium (Ho) Holmium (Er) Erbium (Tm) Thulium (Yb) Ytterbium (Lu) Lutetium (Y) Yttrium

Their properties:

  • Silvery-white/gray in color
  • High luster but tarnish readily in air
  • Most REE compounds are strongly paramagnetic
  • Catalytic, chemical, electrical, metallurgical, nuclear, magnetic and optical properties
  • High electrical conductivity
  • Many REE fluoresce strongly under UV light
  • High melting and boiling points
  • Reacts with dilute acid to release H2 rapidly at room temperature
  • Reacts with H2O to liberate H2 slowly when cold and quickly upon heating

Rare Earth & Platinum-group metals are used in many products:

  1. Magnets (Neodymium, Praseodymium, Terbium, Dysprosium, Samarium): Motors, disc drives, MRI, power generation, microphones and speakers, magnetic refrigeration
  2. Metallurgical alloys (Lanthanum, Cerium, Praseodymium, Neodymium, Yttrium): NimH batteries, fuel cells, steel, lighter flints, super alloys, aluminum/magnesium
  3. Phosphors (Europium, Yttrium, Terbium, Neodymium, Erbium, Gadolinium, Cerium, Praseodymium): display phosphors CRT, LPD, LCD; fluorescent lighting, medical imaging, lasers, fiber optics
  4. Glass and Polishing (Cerium, Lanthanum, Praseodymium, Neodymium, Gadolinium, Erbium, Holmium, Baryte): polishing compounds, decolorizers, UV resistant glass, X-ray imaging
  5. Catalysts (Lanthanum, Cerium, Praseodymium, Neodymium, ruthenium, rhodium, palladium, osmium, iridium, platinum): petroleum refining, catalytic converter, diesel additives, chemical processing, industrial pollution scrubbing

Applications with Rare Earth elements or Critical elements:

  • Aerospace: Beryllium
  • Aluminum production (fluorspar), alloys (Magnesium, Scandium)
  • Automobiles (Cerium, dysprosium, Europium, lanthanum, neodymium, Praseodymium, terbium, Yttrium)
  • Catalytic converters (Cerium)
  • Cathode-ray tubes (Gadolinium, Terbium, Yttrium)
  • Ceramics (Fluorspar)
  • Computer chips (Indium)
  • Defense (Neodymium, Praseodymium, Dysprosium, Terbium, Europium, Yttrium, Lanthanum, Lutetium, Scandium, Samarium)
  • Drilling oil and gas (Baryte)
  • Electric bicycles: 0.1 kg neodymium, praseodymium per bicycle
  • Electric vehicles 1.7 kg of Neodymium & Praseodymium (Nd) per car (Bohlsen 2017), Neodymium (Niobium) electric motors (Samarium)
  • Electronics and electricity (Tungsten)
  • Fertilizers
  • Fire retardants (Antimony)
  • Fiber optics (Germanium, Erbium Europium, Terbium, Yttrium)
  • Flourescent light bulbs (europium, terbium, yttrium)
  • Fuel cells (SOFC use lanthaneum, cerium, prasedymium)
  • Healthcare (Baryte, Erbium)
  • Hybrid engines (Dysprosium)
  • Integrated circuits (silicon metal)
  • iPods (dysprosium, neodymium, praseodymium, samarium, terbium)
  • Lasers (Europium, Holmium, Ytterbium)
  • LCD screens (Indium)
  • Lenses (Lanthanum)
  • Light-emitting diodes (LEDs) (Gallium)
  • Lighting (Lanthanum, Samarium, Europium, Scandium)
  • Luminescent compounds (Promethium)
  • Magnets for turbine systems, car parts, scientific instruments, smart phones, electric vehicles, stereo loudspeakers TVs (mainly neodymium, praseodymium)
  • Metallurgy and alloys (Baryte, Cerium)
  • Nuclear power (Europium, Gadolinium, Cerium, Yttrium, Samarium, Erbium, Beryllium, Niodymium)
  • Oil refinery (Cerium)
  • Optics (fluorspar)
  • Phones, computers, hybrid vehicles, magnets (Cobalt)
  • Photovoltaic cells (Germanium, silicon metal)
  • Pigments
  • Satellites (Niobium)
  • Semi-conductors (gallium, Holmium)
  • Solar panels: copper, indium, gallium, selenide (CIGS) solar cells
  • Steel production (coking coal, fluorspar, vanadium, Ytterbium)
  • Superconductors (high-temperature) Bismuth, Thulium, Yttrium
  • Superconductive compounds (Lanthanum)
  • Telecommunications and electronics (Beryllium)
  • Thermoelectric auto generators (Bismuth)
  • Water Treatment
  • Wind turbines up to 150 kg neodymium, praseodymium per MW (Bohlsen), (dysprosium, neodymium, praseodymium, terbium)

Cerium                 Catalytic converters, oil refining, glass-lens production, glass polishing, flints for lighters, water treatment, self-cleaning ovens

Dysprosium        Lasers, nuclear-reactor control rods, high-power magnets

Erbium                  Fiber optics, nuclear reactor control rods

Europium            TV & computer displays, lasers, optical electronics

Gadolinium         Cancer therapy, MRI contrast agent

Holmium              High-power magnets, lasers

Lanthanum         Oil refining cracking catalyst, fuel cells, hybrid-car batteries, camera lenses, carbon arc lamps for T and film industries, camera lenses

Lutetium              Chemical processing LED lightbulbs

Neodymium       Computer hard drives, cell phones, high-power permanent magnets for electric motors, wind turbines, capacitors, lasers, ear bud headphones, microphones

Praseodymium Permanent magnets, coloring pigment in photographic filters, Aircraft engines, carbon arc lights, glass in airport signal lenses, goggles for welders & glassmakers, fluoride glass in fiber optic cables to amplify signals

Samarium            High-power magnets, ethanol, PCB cleansers

Scandium            Aerospace components, aluminum alloys, mercury vapor lamps to make them brighter, aluminum baseball bats, lacrosse sticks, bicycle frames, fuel cells

Terbium               Solid-state electronics, sonar systems

Thulium                X-ray machines, superconductors

Ytterbium            Portable x-ray machines, lasers

Yttrium                 Lasers, TV and computer displays, microwave filters, strengthen glass, magnesium, ceramic, and aluminum alloys

How are they used (2010)

27%        Magnets

18%        Catalysts

16%        Metal alloys

12%        Polishing powder

  8%        Other

  6%        Glass

  5%        Ceramics

  5%        Phosphors

Posted in Alternative Energy, Mining, Peak Rare Earth Elements | Tagged , , , , | Comments Off on What are rare earth metals and how are they used?