
Preface. What follows is from the International Energy Agency 2020 report “Energy technology perspectives” on how to transition to net zero emissions by 2050. This might require the replacement of just about everything, since power plants, steel blast furnaces, cement kilns, buildings, trucks, cars, buses and more that run fossil fuels now would have to be replaced or greatly modified to run on hydrogen, electricity, or other renewables since most of this infrastructure will last for decades, and much of it is quite young, especially in China. Though since oil peaked in 2018, the energy and time to do this are quite finite…
Consider dams for example. By 2050, more than half the global population will live downstream from tens of thousands of large dams near or past their intended lifespan. Most of the world’s nearly 59,000 big dams—constructed between 1930 and 1970—were designed to last 50 to 100 years. Or less with climate change — extreme rainfall and flooding events are becoming more frequent, increasing the risk of reservoirs overflowing and accelerating the build up of sediment, which affects dam safety, reduces water storage capacity, and lowers energy production in hydroelectric dams. 16 percent of the world’s dams are in the United States, more than 85% of them already operating at or past their life expectancy (Hood 2021).
Alice Friedemann www.energyskeptic.com author of “Life After Fossil Fuels: A Reality Check on Alternative Energy”, 2021, Springer; “When Trucks Stop Running: Energy and the Future of Transportation”, 2015, Springer, Barriers to Making Algal Biofuels, and “Crunch! Whole Grain Artisan Chips and Crackers”. Podcasts: Collapse Chronicles, Derrick Jensen, Practical Prepping, KunstlerCast 253, KunstlerCast278, Peak Prosperity , XX2 report
***
Figure 1.12 Typical lifetimes for key energy sector assets
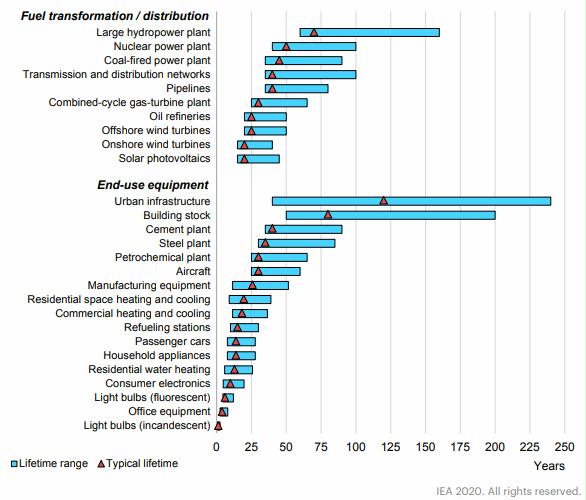
Notes: The red markers show expectations of average lifetimes while the blue bars show typical ranges of actual operation in years, irrespective of the need for interim retrofits, component replacement and refurbishments. “Buildings” refers to building structures, not the energy consuming equipment housed within. Examples of “urban infrastructure” assets include pavement, bridges and sewer systems.
The operating lifetime of some assets, especially those that produce materials or transform energy, can span several decades: this means that it could be a long time until they are replaced by cleaner and more efficient ones.
Figure 1.13 Age structure of existing fossil power capacity by region and technology in operation 2018 (source: Platts 2020a)
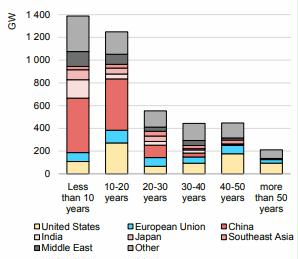
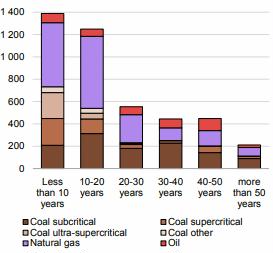
About 50% of the installed fossil-fired power generation capacity in China was built within the last ten years, and 85% within the last 20 years. The average age of coal plants is over 40 years in the United States and around 35 years in Europe, while it is below 20 years in most Asian countries, and just 13 years in China. Gas-fired power plants are generally younger: they are on average less than 20 years old in all major countries with the exception of Russia, Japan and United States, reflecting the fact that gas was only introduced as a fuel for power generation in many countries from the 1990s. Gas plants however have a shorter technical lifetime than coal plants. Of the 2 100 GW of coal-fired capacity in operation worldwide today and the 167 GW under construction, around 1 440 GW could still be operating in 2050 – 900 GW of it in China. Of the 1 800 GW of gas power plants in operation today and 110 GW under construction, only 350 GW are likely to still be operational in 2050.
Figure 1.14 Age profile of global production capacity for key industrial subsectors
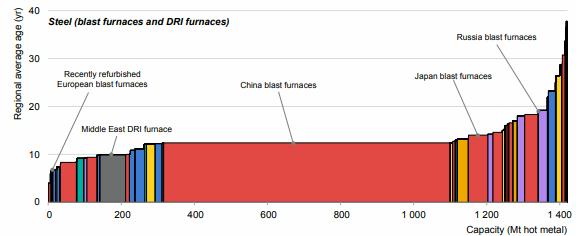
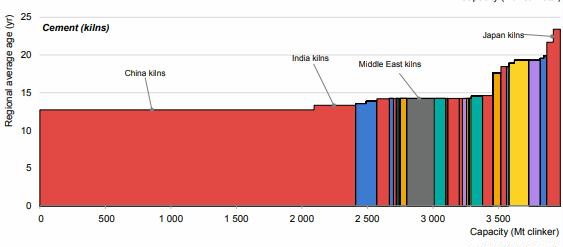
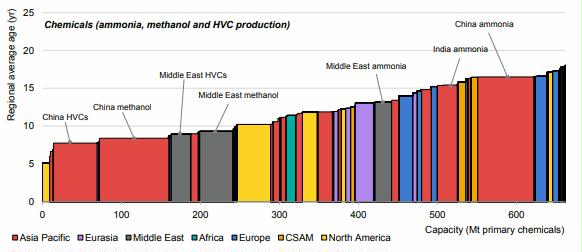
Notes: CSAM = Central and South America. HVC = high-value chemicals. Average ages are calculated by region or country, depending on data availability, for 2019. Steel data are calculated based on plant-level data, while cement, ammonia, methanol and HVC calculations are based on historic data on capacity additions at the national level. Sources: Informed by capacity and production data from Steel Institute (2018), Wood Mackenzie (2018), IFA (2020), Platts (2020b), and USGS (2020).
In heavy industry sectors, China again takes centre stage (Figure 1.14). It accounts for nearly 60% of global capacity used to make iron from iron ore – the most energyintensive step in primary steel production. It also accounts for just over half the world’s kiln capacity in cement production and for around 30% of total production capacity for ammonia, methanol and high-value chemicals (HVCs) combined in the chemicals sub-sector. The majority of this capacity is at the younger end of the age range in each asset class, averaging between 10 and 15 years, compared with a typical lifetime of 30 years for chemical plants and 40 years for steel and cement plants. The range of ages of individual plants within the country varies considerably, but the output growth over the last 20 years in China’s steel (more than seven-fold) and cement (nearly fourfold) sub-sectors shows the relatively short time frame over which most of these installations have been added.
Our estimates for the steel industry’s key assets (blast furnaces and direct reduced iron [DRI] furnaces) incorporate plant-level information on the years when plants were most recently refurbished. Taking this information into account implies that European blast furnaces are among the most recently renewed plants on average (a theme discussed in Chapter 7).
The chemical sub-sector has a more even distribution of capacity both regionally and in terms of age than cement and steel industries. Several chemical facilities have been built in recent years in advanced economies such as the United States as well as in the Middle East. Most of the investment in methanol and HVC capacity has taken place in regions with access to low cost petrochemical feedstocks, particularly North America, Middle East and China. The shale revolution has made US ethane (a compound present in natural gas and a key petrochemical feedstock) comparable in price to ethane in the Middle East, leading to a re-balancing in the geographical spread of chemical production capacity. Methanol and HVC plants are on average around ten years old. Ammonia output growth has been slower than that of HVCs and methanol, with emerging economies generally adding these facilities early in their development, in step with agricultural development. Ammonia plants are on average 15 years old, and around 16 years old in China.
Figure 1.15 Building stock by year of construction and share of stock that remains in 2050
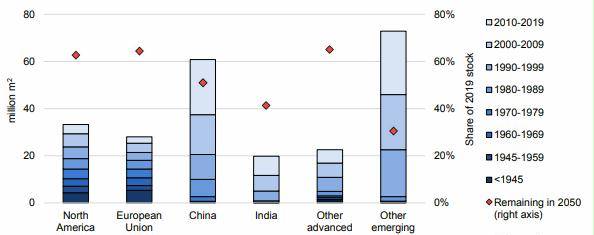
Note: Building floor area covers residential, commercial, services, education, health, hospitality, public and other non-residential sectors but excludes industrial premises. Sources: Informed by NRCan (2020), RECS (2020), CBECS (2020), and EU Commission (2020), NBS China (2020).
The energy conversion devices that lead to direct emissions in the buildings sector (e.g. natural gas combustion for space and water heating) have a short lifetime compared with power plants and industrial assets: they tend to last for around 15 years. However, the buildings in which they are housed will shape energy consumption and subsequent emissions from the sector for decades. The average age of the buildings stock is between 12 and 15 years for most emerging economies and 30 to 40 years for advanced economies. About half of today’s buildings stock is likely to be in use in 2050 (Figure 1.15). The average lifetime of a building varies from 30-50 years for commercial buildings to 70-100 years for modern residential construction and 150 years or more for historic buildings, although low-quality construction can reduce the lifetime of residential buildings to 30 years or less, especially in rapidly emerging economies (IEA, 2019g).
Around half of today’s buildings stock is likely still to be in use in 2050.
The age of a building tends to make a big difference to its heating and cooling needs. Buildings constructed before 1960 for example, can require three-times (or more) as much heat as those built in accordance with current building codes. Building energy codes increase efficiency and reduce energy needs, with the energy requirements of new buildings reducing by around 20% since 2000 globally and by more than 30% in the United States and the European Union8 (IEA, 2019h). However, the long life of buildings and a relatively small number of renovations means that overall progress is slow: around 60% of the global building stock in use today was erected when there were no code requirements regarding energy performance, and this rises to 85% or more in most emerging economies.
Figure 1.16 Age profile and geographic distribution of road transport vehicles
The global vehicle fleet is generally young, with about 70% of cars, trucks and buses being less than ten years old (Figure 1.16). The global passenger car fleet in 2019 reached about 1 billion vehicles. As cars age, many get exported from advanced economies to emerging economies where they may be driven for many more years. The lifetime of cars, trucks and buses is roughly comparable, but trucks in particular are used very intensively by their first owner over a period of three to five years, and as a result they are typically used infrequently for low-intensity operations by the time they reach a decade or more of age.
The past decade has seen a dramatic shift the location of where new cars are sold, with China surpassing the European and North American market in the early 2010s. Emerging economies have gone from accounting for less than 25% of new car sales in 2005 to making up about half of global sales today (IEA, 2019f). The result is that the car fleet in emerging economies is newer than in advanced ones. Around 85% of the cars on China’s roads are less than a decade old; in Europe, Japan and North America, cars manufactured within the past ten years make up only about 70% of the fleet. The same general pattern is seen with trucks and buses, but the shifts in new sales of each of these modes are even starker: the majority of trucks sold in the past decade are in emerging economies, as are two-thirds of the buses. With recent declines in car sales in China and India, global car sales may peak in the coming few years.
Figure 1.17 Age profile and geographic distribution of aircraft
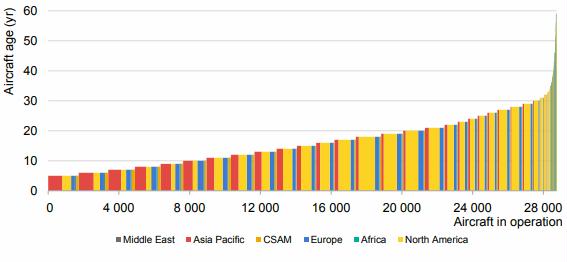
While about 70% of the global aircraft fleet operating in 2019 was built after 2000, aircraft may continue to operate for 50 years or more (Figure 1.17). The median age of the fleet is around 15 years. Newer aircraft predominantly are providing additional capacity to service rapidly growing demand in Asian Pacific commercial passenger aviation markets. Aircraft operating in Europe are roughly of median age on average, while aircraft servicing the North American market tend toward the older end of the distribution range.
References
Hood M (2021) World’s ageing big dams pose ’emerging risk’. phys.org
5 Responses to Lifespan of infrastructure, transportation, and buildings