
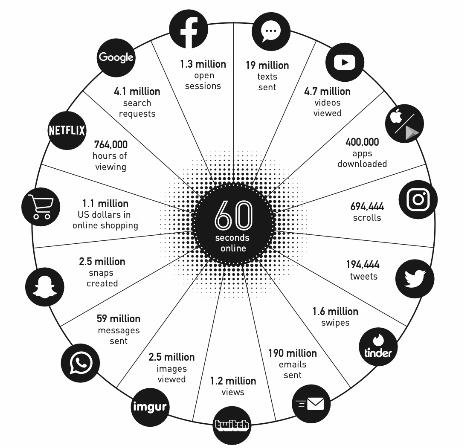
 One minute on the internet around the world. Source Infographic by @LoriLewas and @officiallyChad, 2020.
Preface. This is a book review of Pitron’s “The Dark Cloud”. Of note is the huge amount of electricity and rare earth and other critical elements this technology uses – which batteries, utility scale energy storage, wind, solar, electric vehicles and other renewables need as well (and they are dependent on computers and the electric grid).
Here’s one of many interesting tidbits from this book. When you Like (thumbs up) a photo or post on Facebook, here’s what happens:
- travel through the seven layers of the internet, the seventh layer being your smartphone, laptop computer, or other connected device.
- Your notification then sinks into the intermediary levels of the net (data link, network, transport, etc) until it reaches the first physical layer of the internet — the application — comprising undersea cables.
- From sender to receiver, the notification uses the 4G antenna of a mobile operator or a cable modem, and runs the length of the building’s shared telecoms infrastructure to reach the copper cables buried 80 centimeters (32 inches) under the pavement.
- It then travels along the cables running the length of major communication routes (such as highways, rivers, canals, and railroads) to join other ‘likes’ in the operator’s technical rooms.
- From there, it crosses the oceans via a data center.
- From the inmost depths of the net, your ‘like’ finally takes the reverse journey back to the seventh layer where your like will now be seen. Although your Facebook friend may be sitting next to you, your signal travelled thousands of kilometers.
By the time you finish reading the book, it will make sense that Greenpeace considers this infrastructure as “likely the largest single thing we build as a species” while we’re on earth. Pitron also wrote the excellent book “The Rare Metals War: the dark side of clean energy and digital technologies”.
Below are my Kindle notes.
Related: Katie Singer’s substack (2023) Digital Enlightenment.
Alice Friedemann www.energyskeptic.com Author of Life After Fossil Fuels: A Reality Check on Alternative Energy; When Trucks Stop Running: Energy and the Future of Transportation”, Barriers to Making Algal Biofuels, & “Crunch! Whole Grain Artisan Chips and Crackers”. Women in ecology Podcasts: WGBH, Financial Sense, Jore, Planet: Critical, Crazy Town, Collapse Chronicles, Derrick Jensen, Practical Prepping, Kunstler 253 &278, Peak Prosperity, Index of best energyskeptic posts
***
Pitron G (2023) The Dark Cloud: How the digital world is costing the earth. Scribe.
After visiting a dozen nations Pitron found that “digital pollution is colossal, and it is the fastest-growing type of pollution.”
Making the biggest contribution to this pollution are the billions of interfaces (tablets, PCs, smartphones) — our point of entry into the internet. Also weighing in is the data we produce at every moment. It is transported, stored, and processed in massive, energy-hungry infrastructures, and used to create new digital content requiring even more interfaces.
The global digital industry consumes enough water, material, and energy to give it a footprint triple that of a country such as the UK. Digital technologies currently use 10% of the world’s electricity, and account for close to 4% of global carbon dioxide emissions — almost double that of the global civil aviation
The five most powerful US companies in the digital economy — Facebook, Amazon, Apple, Netflix, and Google (‘FAANG’) — even want to keep us in the dark about its material impact. Such as:
Digital technologies consume 5 to 7 per cent more electricity every year, and could increase to as much as 20% of global electricity by 2025. The more time we spend on our screens, the more data we produce … and the more energy we use. Consider that for videos, high-definition will soon be overtaken by 4K (number of pixels) video resolution, even 8K video resolution, which ‘uses 32 times more data than high-definition’, according to one report. Another staggering statistic is put forward by a researcher for the magazine The Conversation: ‘A 10% increase in 4K video in 2030 alone would produce a 10% increase in the overall volume of electricity used by digital technology.’
The sector’s water and energy consumption, and its contribution to the drying-up of mineral resources, gives it a carbon footprint two to three times that of a country such as the UK or France. And this is unsurprising: there are some 34 billion pieces of digital equipment in circulation on the planet, representing a total of 223 million tonnes, or 179 million cars. In terms of energy consumption, Information and communication Technology (ICTs) account for around 10% of the world’s electricity, equivalent to the power generation of 100 nuclear reactors. If the digital world were a country, it would be the third-biggest consumer of energy after China and the USA, bearing in mind that 35% of today’s energy is coal-based. All told, digital represents just under 4% of global greenhouse-gas emissions.
***
In the US, teenagers spend up to 7 hours and 22 minutes of their free time per day in front of a screen. Three hours of that time is spent watching videos on Netflix or Orange Cinema Series (OCS), and at least one hour is spent on social networks such as TikTok, SnapChat, Twitch, House Party, and Discord.
Over half of the world’s population is now concentrated to urban areas, and while they only cover 2 per cent of the Earth’s surface, they are responsible for generating 75% of the world’s power, and producing 80 per cent of the world’s carbon dioxide emissions.
In 2007, the British architectural practice Foster + Partners was commissioned to raise Masdar from the sand, which it did using good common sense. The city is north-east facing, limiting its exposure to the sun; its streets run in the direction of the wind to allow a flow of air; and staircases are placed in front of lifts to encourage more physical exercise. As the technical hurdles piled up, officials conceded that the city could only run on 50% renewable energy rather than almost double that as anticipated. As for smart homes, the implementation of the ambitious Building Management System for optimizing Masdar residents’ electricity consumption has been held up, as users try to figure out how to get it to work. Today, only 10% of the initial plans for the eco-city have been built, and the city barely has 2,000 inhabitants.
It was only in 2016, in an article published by a group of Danish researchers, headed by Kikki Lambrecht Ipsen, in a scientific journal that a theoretical analysis framework was finally set out. Over six months, Ipsen reviewed the costs and benefits of seven categories of smart technologies, including smart windows, water meters, and energy grids — making up millions of pieces of hardware. He and his team found that, while they reduce the electricity consumption of urban areas, this benefit has a high material and energy cost, as large quantities of parts and equipment need to be industrialized and transported. Indeed, Lambrecht Ipsen’s cost-benefit analysis, published in 2019, reaches the astonishing conclusion that: ‘… the implementation of Smart City Solutions generally has a negative influence on the environmental sustainability performance of an urban system’.
If we take into account the true borders of these cities, which extend thousands of kilometers beyond the outer city limits to where smart technologies are manufactured, we are in fact making their overall impact worse. The digital industry is not saying it has a limited environmental impact; it is outright promising a net positive effect on the environment, with knock-on benefits for economic players transitioning to digital: small-scale farmers using satellite images to more accurately manage their inputs; car manufacturers developing eco-navigation tools capable of optimizing fuel efficiency; and major mining houses that, using sensors, can switch off the ventilation to unused galleries, lowering their electricity consumption. The examples are compelling.
Graphite
Graphite is a mineral that is indispensable to our connected lives, and without which the vast majority of smartphones and computers would not work.
China produces close to 70 per cent of this mineral whose particles, under the microscope, are the shape of snowflakes. Graphite mines are terrifically polluting. If you visited one, you would see it is ringed in by an impressive mineral arena and steeped in clouds of dust from excavators tearing down a mountain. The dug up whitish rocks are transported to dilapidated factories at the bottom of the valley where they are crushed, immersed in an acid bath, and loaded into very high-temperature furnaces. The end product — a grey powder that smells of rancid butter — is packed up in 25-kilogram sacks. This graphite powder contains hydrofluoric acid, a highly corrosive, extremely toxic, and potentially lethal solution?
The batteries of billions of telephones around the world each contain little more than two grams of graphite in order to have electric conductivity. But its manufacture comes at great human and environmental expense because of the residue emitted from the nearby mines and factories spread into the atmosphere for dozens of kilometers in all directions.
Digital pollution
China is where I unearthed the primary cause of digital pollution: the raw materials needed to manufacture the 34 billion mobile phones, tablets, and other devices in circulation in the world.
A 1960s telephone, complete with a rotary dial, at most would have required around 10 raw materials, such as aluminum and zinc. A 1990s mobile phone contained another 19 raw materials, including copper, cobalt, and lead. Today’s smartphones have more than 50 raw materials in the smartphone’s battery, casing, screen, and electronic. All of these have to be mined, creating tremendous pollution from tailings left behind and processing the ore: Aluminum, Americum, Antimony, Barium, Beryllium, Bismuth, Bromine, Calcium, Carbon, Chlorine, Chromium, Cobalt, Copper, Erbium, Iron, Fluorine, Gadolinium, Gallium, Germanium, Gold, Hafnium, Indium, Iodine, Iridium, Oead, Lithium, Magnesium, Manganese, Neodymium (what makes your phone vibrate), Neon, Nickel, Nitrogen, Oxygen, Palladium, Phosphorus, Platinum, Potassium, Rubidium, Scandium, Silicon, Silver, Sodium, Strontium, Sulphur, Tellurium, Thallium, Titanium, Tungsten, Vanadium, Yttrium, Zinc, Zirconium. The touchscreen is thanks to traces of ITO — indium tin oxide.
Then there’s the internet and its litany of telecommunication networks (cables, routers, and WiFi) and data centers, where connected objects can talk to one another. This gigantic infrastructure is drawing on a growing share of the Earth’s resources, with ICT accounting for 12.5% of global copper production, and 7% of global aluminum production (both abundant metals). ICT also uses minute metals with exceptional chemical properties. We also find them in flatscreen televisions, condensers, hard drives, integrated circuits, fiber optics, and semiconductors. These digital technologies guzzle a large share of annual global output: 15% of palladium, 23% of silver, 40% of tantalum, 41% of antimony, 42% of beryllium, 66% of ruthenium, 70% of gallium, 80% of germanium, and as much as 88% of terbium.
A more detailed list of metals and uses in ICT technology: Antimony 41% for fireproofing, Dysprosium 63% and Neodymium 26% for magnets, Gallium 70% for integrated circuits, Germanium 87% for fiber and infrared optics, Indium 60% for LCD screens, sputtering targets, semiconductors, LED, Terbium 88% for magnets and lighting, Erbium, europium, gadolinium 50% for lighting, beryllium 42% / Iridium 43% / Ruthenium 66% for various electrical and electronic applications.
It is increasingly clear how absurd it is to talk about the ‘dematerialization’ of our economies when the virtual has such a tremendous physical impact in the real world.
But admitting that our economies and way of life cannot be dematerialized without material is nothing short of heresy. Wasn’t the eruption of the digital realm, which is obviously ‘virtual’, supposed to curb our consumption of resources?
DATA CENTERS
By 2025, 80% of companies will have shut down their own data centers to move their contents to external providers that offer cloud services. This migration will lead to the liquidation of millions of servers around the world.
Software developers are largely to blame, as new applications and programs take up more and more memory and processing power, earning them the name ‘bloatware’: complex software that includes countless battery-guzzling features. GreenIT highlights this trend: ‘The average weight of web pages increased by 115 times between 1995 and 2015.’
Similarly, the power needed to compose a text message doubles every two or three years.
This explains why, over the last three decades, the lifespan of a computer has dropped from 11 to just four years. Homo sapiens becomes ‘homo detritus’, producing the equivalent of 5,000 Eiffel Towers of electronic waste, or e-waste, every year.
The built-in software in any product ‘allows the vendor to control who can carry out repairs, when and at what price … and because the product can’t even be repaired a lot of the time, you have to buy a new one’, says Kyle Wiens, founder of the Californian company iFixit, which helps users fix their electronic devices.
Material use impact
To measure the Material Input Per Service (MIPS) unit the resources needed to manufacture a product or provide a service are calculated. Looking at what goes into an object as opposed to what comes out of it delivers a radical change of perspective. The method assesses all the resources mobilized and displaced for the manufacture, use, and recycling of a given object — whether it’s a garment, a bottle of orange juice, a carpet, or a smartphone. Everything is covered: renewable and non-renewable resources (plants and minerals), agricultural land shifts, and the use of water and chemicals. For example, a T-shirt made in a factory in India requires electricity that is generated by coal, which requires cutting down a pine forest … The T-shirt’s MIPS factors in the cotton that is used, but also the bricks used to build the factory, the tungsten filament lighting the premises, the coal used to generate electricity, and the trees that were felled to plant the cotton, etc.
Making a T-shirt requires 226 kilograms of resources; a liter of orange juice, 100 kilograms of raw materials; and a newspaper, 10 kilograms. A few grams of gold has a MIPS of three tonnes! Clearly, the weight of the objects that surround us is far greater than we think — an average of 30 times more.
A one-kilometer car ride and an hour spent watching TV use one and two kilograms of resources respectively. One minute on the telephone ‘costs’ 200 grams. A text message ‘weighs’ 0.632 kilograms.
There are MIPS calculators online. I learned that my ecological rucksack is around 38 tonnes per year. The average is 40 tonnes.
Many products have quite a low MIPS ratio. Manufacturing a steel bar ‘only’ requires 10 times more resources than its final weight.
A two-kilogram laptop involves 22 kilograms of chemicals, 244 kilograms of fuel, and 1.5 tonnes of clean water, to list but a few resources. The MIPS ratio of a television ranges from 200:1 to 1,000:1. (A 15-kg TV would require between 3-15 tonnes of raw materials.) That of a smartphone is 1,200:1 (183 kg of raw materials for an end product weighing 150 grams). But the prize for the highest MIPS goes to the microchip: 32 kg of materials for an integrated circuit weighing two grams — a hair-raising ratio of 16,000:1.4
Multiply this volume by the MIPS of billions of servers, antennas, routers, and other WiFi terminals currently in service by 100, 1,000, or even 10,000, and you will reach the conclusion that these ‘dematerialized’ technologies not only consume materials, but are quite simply becoming one of the most massive enterprises in materialization in history.
It is not enough to be ‘low carbon’ to be eco-friendly; it takes being ‘low resource’ as well.
Making computer chips
A handful of companies, such as Samsung in South Korea, Intel and Qualcomm in the US, and the Taiwan Semiconductor Manufacturing Company (TSMC) now produce some 100 billion chips every year for everything from laptop computers, washing machines, and rockets to, of course, mobile phones.
The air in the clean room is renewed every six seconds.’ Chips are among the most complex electronic components out there. Making them requires some 60 raw materials, including silicium, boron, arsenic, tungsten, and copper, all of which are 99.9999999 per cent purified (seven nines).
Printing transistors is no easy feat. ‘Microchips can contain up to 20 billion transistors.
The 500 steps it takes to manufacture an integrated circuit involves thousands of subcontractors across dozens of countries. The quartz mine is probably in South Africa; the silicon wafers are manufactured in Japan; the photolithography equipment comes from the Netherlands; Austria is home to one of the world’s biggest manufacturers of vacuum pumps, the ball bearings of which are made in Germany; the integrated circuits are probably packaged in Vietnam to keep costs down; from there they are sent to Foxconn in China to be put into iPhones; and to optimize all these processes, TSMC would use software developed by Italian and Scottish universities.
The logistics alone ‘consume an absolutely monstrous amount of energy’, says the researcher Karine Samuel.
Extracting and refining silicon, casting wafers at 1,400 degrees Celsius (2,550 F), producing extreme ultraviolet light using machines drawing on light energy, and the dozens of cleaning operations of the wafers all require exorbitant amounts of energy.
So it comes as no surprise that the total amount of fuel burned is hundreds of times higher than the final weight of the integrated circuit.
Because integrated circuits need to be rinsed with deionized water [purer than distilled water] at every step of the manufacturing process, it takes a lot of water to develop chips. This puts TSMC’s water consumption at some 156,000 tonnes per day. Although 86% of it is recycled.
TSMC’s energy consumption: The smaller the object you produce, the larger energy-guzzling machines you need. TSMC’s factories in Taiwan supposedly require the equivalent of three nuclear reactors to operate, or 3% of Taiwan’s national peak energy consumption — a number that is expected to double over the next ten years. With 43% of the country’s electricity coming from coal- and oil-fired plants, ‘the carbon footprint of Taiwan’s electronics industry makes up 10% of the country’s total emissions.
Processing also emits another, imperceptible type of pollution: fluorinated gas. Colorless, odorless, and non-flammable, other products used by the digital and microelectronics industry are contributing to global warming. Among them are the 50 or so fluorinated gases (F-gases), which we know little about.
HFCs, SF6, PFCs, NF3, and CF4 are just some of the chemical formulas of these gases comprising one or several fluorine atoms. The gases are used in air-conditioning systems for cooling down cars, buildings … and data centers (the case for HFC). As for microelectronics, ‘They’re full of gas!’, says academic Karine Samuel. Fluorinated gases are used for their chemical properties in the manufacturing of semiconductors, integrated circuits, and flat-panel displays. They are produced in very small proportions, totaling only 2% of total greenhouse-gas emissions. The main F-gas, the HFC family, has the immense advantage of not destroying the ozone layer, unlike the CFC gases they replace. This takes HFCs a step forward in the right direction for the environment. But it’s not that simple.
‘A single molecule of this type of gas is far more potent than carbon dioxide.’ Their warming ability is a confounding 2,000 times higher on average. NF3 is 17,000 times more effective than carbon dioxide at trapping heat in the atmosphere. SF6 is an even more impressive 23,500 times more effective than carbon dioxide, making it the most potent greenhouse gas ever produced on Earth.
By 2050 these chemicals will represent 10 per cent of greenhouse gases. Because fluorinated gases are synthetic, nature cannot break them down. Consequently, they remain in the atmosphere for a very long time: 740 years for NF3, up to 3,200 years for SF6, and 50,000 years for CF4 — the greenhouse gas with the longest lifespan that we know of so far.
HFOs, which can be used for refrigerating data centers, have a much lower warming potential than HFCs. But before these miracle gases can be used, we have to abide by the laws of business. Honeywell invested hundreds of millions of dollars into the Solstice range. To get a return on its investment, the chemistry company has patented the range until 2030, and sells the gases at a cost that is 20 times higher than that of HFCs. While the prices are arguably justified, they are completely out of reach for developing countries. India is too poor to stop using HFCs.
SERVERS & DATA CENTERS
For cost and security reasons, a growing number of companies prefer entrusting the management of their servers to specialist providers such as Equinix, Interxion, EdgeConneX, CyrusOne, Alibaba Cloud, and Amazon Web Service. As good ‘hosts’, they accommodate their clients’ data in ‘colocation’ data centers — a bit like ‘hotels for servers’ linked to the internet. These facilities make up what is known as ‘the cloud’ — an outsourced service for storing data that is accessible from absolutely any interface, and so popular that it is the transit point for a third of the data produced in the world today.
Every day of your life, for your most basic needs, you are likely to use 100 data centers in 10 different countries. They’re at the heart of our computerized life. You can find these clusters of servers in the very heart of major cities — an old hotel, a fallout shelter, an air bunker, a post office sorting center, or a disused car factory.
There are nearly three million data centers with a minimum surface area of 500 square meters, 85,000 intermediate-sized data centers, and 10,000 or so data centers more or less the same size as Equinix AM4 In the midst of this web of steel and concrete thrive over 500 ‘hyperscale’ data centers with surface areas sometimes as big as a football pitch.
The global market for this infrastructure, currently worth in the region of 124 billion euros, is growing at an annual rate of 7%.
Humanity is quite literally drowning in a sea of data. One drop is worth one byte. The 47 zettabytes of data produced every year, equals the volume of the Mediterranean and the Black Sea combined.
The biggest data center on the planet is a one-hour car ride south of Beijing in the city of Langfang, and has a surface area of 600,000 square meters,
To support this spectacular growth, the industry has turned to real estate agents, or ‘site selectors’, who scour the globe for the most appropriate location for stowing the next fragment of the cloud: preferably as far as possible from any flood, farming, or residential areas, air routes, and railway lines in order to limit the risk of accidents, but less than an hour’s drive from an international airport so as to attract top talent. That’s not all: electricity transmission grids must be robust, the tax environment favorable, the cost of land attractive, and the construction workers competent so that the future data center can be up and running in less than eighteen months.
Nowhere else in the world does the growth of data exert more pressure on land than in Ashburn, 50 kilometers north-west of Washington in the state of Virginia, which handles no less than 70% of the world’s internet traffic. Over 57 data centers have converged on Ashburn.
Cooling an average-sized data center can take as much as 60,000 cubic meters of water per year — enough to fill 160 Olympic-size swimming pools.
The NSA commissioned its flagship data center on a training site of the National Guard on the outskirts of the city of Bluffdale, northern Utah, for its incredibly low cost of water, which is indispensable for cooling data centers. It was revealed that its facility was consuming between 100,000 and 200,000 cubic meters of water every month.
CHAPTER FIVE An appalling waste of electricity
In their quest for absolute availability, cloud companies are taking more precautions: ‘redundant’ power systems, with two electrical supplies, two generators, and rooms the size of public libraries filled with lead-acid batteries to ensure continuity between the time the outage occurs and the generators take over. The roofs of many of the data centers in the middle of New York ‘are dizzying outgrowths’ that comprise ‘water cooling towers for air-conditioning […] water tanks in the event of a cut-off, cranes to mount the diesel generators from the street … Their basements are loaded with cables, equipped with fuel oil tanks that hold several hundred thousand liters to supply the generators’, according to a global report on data centers. No other building costs as much per square meter as a high-level data center’.
Cloud companies are also duplicating the data centers themselves, and not without making sure that the mirror site is built on a different tectonic plate!
Gmail email service was replicated six times, while as a rule a cat video was stored in at least seven data centers around the world.
An investigation by the New York Times revealed that certain underused data centers can waste as much as 90% of the electricity they consume.
A 60-megawatt data center was meant to be built in Haarlemmermeer, which was the equivalent of the energy needs of a city of 120,000 inhabitants. By 2019 here were 20 data centers with six more lined up. Citizens began to complain. Recently elected, Mariette Sedee worried that the increased electricity needs would conflict with those of surrounding greenhouses for flowers, hospitals, and fire stations. She also questioned just where the 1,000 hectares of solar farms accompanying this digital spread would go, the equivalent of 2,000 football pitches.
In Haarlemmermeer, the construction of data centers can resume until 2030, ‘after which ‘there will no longer be space available for them’, warns the municipality. But challenges remain. ‘We are by no means an isolated case. Frankfurt, the Danish peninsula of Jutland, London, Paris, and Dublin all face the same problems,’ admits Dutch lobbyist Stijn Grove. The industry is, in fact, experiencing what is called the ‘Amsterdam effect’, and other municipalities may make similar decisions to avoid overload.
Google, Apple, Microsoft, and Facebook set up operations in Dublin, with the result that ‘data centers now consume more energy than the city’s population!’ said Olivier Labbé, managing director of a data-center engineering firm.
According to research by EirGrid Group, Ireland’s electric-power transmission operator, data centers could consume up to 29% of the country’s electricity by 2028! Today, 58% of the country’s electricity is generated from fossil fuels.
Coal fuels many data centers
We are touching on a sensitive topic: the origin of the electricity that keeps the internet running relentlessly is none other than coal.
The Appalachian region still accounts for a large portion of the 640 tonnes of coal produced every year in the US, 78% of which is mined underground. The cumulative power of the explosives used in West Virginia alone is the equivalent of the 13 ‘Little Boy’ atomic bombs dropped on Hiroshima. The practice of moving mountain tops apparently accounts for 3 per cent of the country’s electricity. Mountaintop removal has contributed to making some of the most active mining areas in West Virginia ‘40% flatter than they were before excavation’.
Coal meets 30% of Amazon Web Services’ electricity needs. The same applies to Netflix; it’s a startling figure, given that 15% of internet traffic worldwide is generated by the video-streaming platform. And 23% of Adobe’s mix, 36% of Oracle’s, and 23% of LinkedIn’s are allegedly also coal-based.
The entire digital industry, which taps 10% of the electricity generated on the planet, is reported to be responsible for 3.7% of greenhouse-gas emissions — a number that could double between now and 2025.
CHAPTER SIX Battle of the far north
My peregrinations have taken me as far as the extreme north of Sweden this winter in 2020, it is because the internet produces heat. Some data-center equipment can heat up to 60 degrees C, whereas a data center needs an ambient temperature of between 20 and 27 degrees Cto work optimally. Cooling systems use vast amounts of electricity — as much as ‘half of the electricity of a data center’.
Google, which owns some fifteen data centers around the world, often uses shell companies so that its name is only associated with these infrastructures once the builds are approved. In the US, the search engine also imposed strict confidentiality clauses on the municipalities where it set up in order to bypass any public discussion about the water and electricity consumption of its data centers.
As for Amazon, a document leaked on Wikileaks revealed that the company was discreetly multiplying its data centers under innocently named companies such as Vadata Inc and Vandalay Industries.
Fifteen kilometers of raging waters used to wash up against pine and birch forests, and, more importantly, he tells me, it was one of Sweden’s best-known spawning grounds for salmon. ‘It was paradise!’ says Roland, who lived a stone’s throw from the shore at the time. The life of Vuollerim’s 3,000 inhabitants gravitated around Lilla Luleälv … as did the lives of their children.
‘Every spare moment we had, my friends and I would jump on our bikes to come here to swim, bask on the rocks, and fish. It was like the river had a soul.’ But soon the government began to build hydroelectric power stations across the country to support Sweden’s economic development. Luleå’s river had great potential, as it would ultimately meet up to 10% of the country’s electricity needs. ‘The stream was gone’, he says, his throat tight. Dried up over some fifteen kilometers, the Lilla Luleälv remains the longest river in Western Europe drained at the hands of humans.
What remains is ineffable grief and long-lasting mourning. A mourning for water. We began to refer to the dam as “a massacre of the environment”, a facility that got the better of an extraordinary biodiversity; that “not the slightest impact assessment” of the hydroelectric power station was carried out. Boman talks to his children about the missing river as if talking about a loved one lost too soon.
The world’s best-known cryptocurrency, Bitcoin, itself guzzles 0.5 per cent of the world’s electricity,
CHAPTER SEVEN Expansion of the digital universe
Deploying 5G requires installing more antennas; they may be more powerful, but their range is more limited. The UK already has 26,000 3G and 4G antennas. 5G has half their wave spectrum, which means having to install twice as many just for England.
Measuring a few dozen centimeters, these antennas laden with rare metals such as gallium and scandium will be installed every 100 meters or so, on bus stops, streetlights, and even billboards. How will they be recycled? And what about the additional wired fiber-optic connections needed to relay data?
In the US, the Fiber Broadband Association already estimates that providing coverage to the 25 biggest metro markets in the country will require pulling 2.2 million kilometers of wired fiber — 55 times the circumference of the Earth!
What is the true ecological cost of this technological enterprise? It must be said that no one really knows: ‘no environmental impact assessments were carried out’, grumbles a member of the European Parliament I spoke to.
DRIVERLESS CARS
If there is one technology that 5G will help to mainstream, it is the connected car because it an relay huge amounts of data about the surrounding environment. Already GPS navigation and driver-assistance systems are prevalent. Over 500 million connected cars are expected to be on the road by 2025. But capturing the necessary information requires myriad cameras, radars, and sonar. A connected car is embedded with up to 150 electronic control units, producing, by the most conservative estimates, 25 gigabytes of data per hour. Its onboard computer therefore needs as much processing power as 20 laptop computers, and a total of 100 million lines of code to run its software.
We can nevertheless draw comparison with a spaceship, which requires 400,000 lines of code; the Hubble space telescope, which requires two million lines of code; a military drone, 3.5 million lines of code; and a Boeing 787, 14 million lines of code. In other words, a connected car’s software is as bloated as 250 spaceships put together, or 50 Hubble space telescopes, or seven Boeing 787s.
If driverless cars do one day go mainstream, they will produce, on account of their lidars and ultra-high-definition cameras, up to one gigabyte of data per second. And what will these vehicles use to communicate with? Road signs, smart roads, and other driverless cars connected to ‘edge data centers’ that offer the lowest possible latency. Paradoxically, the more ‘autonomous’ the car, the more it will depend on the surrounding infrastructure … There is nothing less autonomous than an autonomous vehicle.
One thing we can be sure of is that it will use far more electricity — up to 1,500 additional watts. How will that affect the range of the electric car? Will the volume of its battery need to be increased? The data produced by a driverless car will result in carbon dioxide emissions from the infrastructure used to transmit, store, and process the data needed to better understand our consumer behaviors, to propose adapted car insurance plans (known as ‘pay as you drive’), and to design targeted advertising. Accordingly, every kilometer travelled by a driverless car could indirectly increase average car emissions by over 20%.
The driverless car will be like a lounge on wheels, an entertainment area where, our hands off the wheel, we will consume … even more digital services on social media, Google, or Netflix. So for the key players of the digital economy, the automobile will become a new front in the strategy to capture our attention, and therefore expand the digital universe.
CHAPTER EIGHT When robots out-pollute humans
According to pessimistic scenarios, by 2040 AI could monopolize half of the world’s energy production (citation Keynote by Emmanuel Assie, founder and CEO of Webaxys, Data Centre World, 2019).
Will we be able to support, technically speaking, the exponential increase of data produced, shared, stored, and processed? Given how much energy and resources digital infrastructure needs, will power grids be able to handle the immaterial tsunami caused by 5G and the internet of everything?
CHAPTER NINE Twenty thousand tentacles under the sea
Preparations are underway for a unique event: the ‘landing’ (installation) of Dunant, Google’s second intercontinental internet cable. Laying an undersea cable may well cost hundreds of millions of dollars, but it is still 10 times less expensive than digging trenches on land. A 12-fiber-pair cable with a capacity of nearly 300 terabits per second, Dunant is one of the most powerful cables ever commissioned. In a few months, it will cover a distance of 6,600 kilometers to connect the American city of Virginia Beach, south of Washington, to a Google data center built in the Belgian city of Saint-Ghislain. It’s a first in 20 years, in fact.
The internet is a gigantic amphibious network. Close to 99% of the world’s data traffic travels not though the air, but via the cables deployed underground and at the bottom of the sea. Every passing day, we use hundreds of cables spread over thousands of kilometers. The undersea cables are made of fine metal encased in polyethylene (plastic), and these enclose the fiber-optic pairs — that is, glass-fiber strands — through which coded information in the form of light pulses transit at a speed of around 200,000 kilometers per second.
Dunant can handle five billion telephone calls, or three times the information contained in the US Library of Congress, per second.
SEAME-WE-3 (standing for South-East Asia, Middle East, and Western Europe), span 39,000 kilometers between Northern Europe and Australia. ‘People think we live in a “wireless world”, when in fact we have never been more connected by wires than we are today!’
The backbone of the internet overall is a robust substructure, but apparently it has some local weaknesses, with up to 150 cases of cable damage reported annually. At the end of 2006, a magnitude-7 earthquake shook Taiwan, damaging and severing most of the fiber-optic cables threading the nearby Luzon strait; it took 49 days and 11 ships to restore the connection between Taipei, Hong Kong, and the rest of south-east Asia. Then, in 2017, a storm got the better of the SEA-ME-WE 4 linking Marseille in the south of France to Annaba, Algeria, knocking out 80% of Algerian internet traffic for two days. A year later, a dozen countries in West Africa saw their connection slow down for 10 days after the ACE (Africa Coast to Europe) undersea cable was damaged by a fishing trawler. According to research, the anchors of fishing boats, and cargo ships, are the number-one threat to internet infrastructure, ahead of offshore windfarms and deep-water drilling activities.
cohabitation with fishermen is not always tranquil. Take the English Channel. Every day, the world’s busiest section of sea is used by 800 vessels … and the SEA-ME-WE 3. ‘The cable is sunk in the sands, but sometimes tidal currents bring it to the surface … While fishing boats can steer clear of the cable, trawlers leave their fishing gear [nets] in place 24 hours a day, so they absolutely must be warned, otherwise it creates cohabitation issues’, said a spokesperson of a French fishing association. And we can’t have a sardine vessel cutting the remaining ties between the United Kingdom and Europe! The result is that ‘fishermen are fed up, and they’re digging in their heels’, says one of their representatives angrily. ‘They used to be more or less alone on the English Channel, and now there’s a very bureaucratic take on things, as if the sea has been divided along property lines.’ And watch out for sharks, whose ‘bites tend to pierce through the cable insultation’, points out a report.
Even the increase in the number of hurricanes — a consequence of climate change — could worsen shifts in the seafloor, and compromise certain sections of the web.
‘pirates’ gained notoriety for bringing to the surface an 11-kilometer section of the T-V-H (Thailand-Vietnam-Hong Kong) cable system off the coast of Vietnam, with a view to selling the salvaged metal as scrap! Consequently, there are ‘ocean emergency brigades’ constantly patching up cables, and dispatching submersibles that can identify the damaged section, before replacing it and restoring internet traffic.
‘If cable ships weren’t spending their time repairing them, the world’s internet would be down in barely a few months’, warned an undersea cable specialist. The worst cable? Perhaps the one belonging to Orange — 30 meters deep and keeping close company with the Belgian city of Ostend. ‘We’re on our 91st repair!’, huffed a director at the French telco.
Australia and New Zealand took a series of unprecedented decisions from the 1990s: establishing 17 cable-protection zones where all anchoring and fishing activities are banned in order to avoid damaging the strategically important web for these island nations.
Today, there are a million kilometers of out-of-service fiber-optic cables — so-called ‘zombie cables’ — lurking on the ocean floor. They have a useful lifespan of around 25 years, after which their owners ‘don’t have the moral courtesy to recycle them.
Then there is the small matter of finding the cables!
Some lie 7,000 meters deep in the middle of the Earth’s vast waters.
Greenwashing: The Global e-Sustainability Initiative (GeSI)
If there is one organization with more clout than any other on this terrain, it is the Global e-Sustainability Initiative (GeSI) — a group of private players from the digital sector and international organizations. Put plainly, it is a lobby group defending the interests of its members. The result is that the GeSI reports are being taken as gospel, with the Brussels-based lobby boasting that it is one of today’s leading sources of global information on ‘green IT’.
Thirteen of the 17 organizations providing their expertise are from the private sector. Such an overwhelming majority should have been counterbalanced by specialist input from the non-commercial sector, as the international non-profit Collaborating Center on Sustainable Development (CSCP) appears to have done. I also learned that while a number of NGOs, including the World Wildlife Fund (WWF), were approached to participate, they would have had to pay to do so, which they refused to do.
Very quickly, however, a number of experts raised their doubts about the reliability of the research. A few of the flaws they found included that “the two reports only look at carbon dioxide emissions and e-waste is not fully accounted for”. Also, too many of the assertions ‘were unverifiable’. The experts could not support their claims, especially about the amount of electricity savings by going digital.
At one point, two representatives of the Swedish telecommunications group Ericsson unceremoniously left the project due to the apparent lack of scientific rigor. But what did they expect? ‘Everyone knew from the outset that the report’s findings would be positive’, one of my sources stated baldly. ‘Business is business! It was pure “green marketing”, which would only ever come up with glowing statistics.’
One of our renegades went as far to say that, ‘It would be very dangerous to use GeSI reports for public policy purposes.’ Only, that is precisely what happened. And why wouldn’t they be? ‘It was so very appealing to believe that digital could generate economic growth and be good for the environment’,
Lines of programming code by digital technology
| 10,000 | iphone game |
| 400,000 | Space shuttle |
| 2,000,000 | Hubble Space Telescope |
| 3,500,000 | Military drone |
| 4,500,000 | Xbox DVD player |
| 6,000,000 | Google Chrome web browser |
| 12,000,000 | Android operating system |
| 14,000,000 | Boeing 787 |
| 24,000,000 | F-35 fighter jet |
| 61,000,000 | |
| 100,000,000 | Connected car software |
| Source: 2020 David McCandless based on data from NASA, website Quora, Ohloh, Wired & press report | |