Lifespan of infrastructure, transportation, and buildings

Preface. What follows is from the International Energy Agency 2020 report “Energy technology perspectives” on how to transition to net zero emissions by 2050. This might require the replacement of just about everything, since power plants, steel blast furnaces, cement kilns, buildings, trucks, cars, buses and more that run fossil fuels now would have to be replaced or greatly modified to run on hydrogen, electricity, or other renewables since most of this infrastructure will last for decades, and much of it is quite young, especially in China. Though since oil peaked in 2018, the energy and time to do this are quite finite…

Consider dams for example. By 2050, more than half the global population will live downstream from tens of thousands of large dams near or past their intended lifespan. Most of the world’s nearly 59,000 big dams—constructed between 1930 and 1970—were designed to last 50 to 100 years.  Or less with climate change — extreme rainfall and flooding events are becoming more frequent, increasing the risk of reservoirs overflowing and accelerating the build up of sediment, which affects dam safety, reduces water storage capacity, and lowers energy production in hydroelectric dams.  16 percent of the world’s dams are in the United States, more than 85% of them already operating at or past their life expectancy (Hood 2021).

Alice Friedemann   www.energyskeptic.com  author of “Life After Fossil Fuels: A Reality Check on Alternative Energy”, 2021, Springer; “When Trucks Stop Running: Energy and the Future of Transportation”, 2015, Springer, Barriers to Making Algal Biofuels, and “Crunch! Whole Grain Artisan Chips and Crackers”. Podcasts: Collapse Chronicles, Derrick Jensen, Practical Prepping, KunstlerCast 253, KunstlerCast278, Peak Prosperity , XX2 report

***

Figure 1.12 Typical lifetimes for key energy sector assets

Notes: The red markers show expectations of average lifetimes while the blue bars show typical ranges of actual operation in years, irrespective of the need for interim retrofits, component replacement and refurbishments. “Buildings” refers to building structures, not the energy consuming equipment housed within. Examples of “urban infrastructure” assets include pavement, bridges and sewer systems.

The operating lifetime of some assets, especially those that produce materials or transform energy, can span several decades: this means that it could be a long time until they are replaced by cleaner and more efficient ones.

Figure 1.13 Age structure of existing fossil power capacity by region and technology in operation 2018 (source: Platts 2020a)

About 50% of the installed fossil-fired power generation capacity in China was built within the last ten years, and 85% within the last 20 years. The average age of coal plants is over 40 years in the United States and around 35 years in Europe, while it is below 20 years in most Asian countries, and just 13 years in China. Gas-fired power plants are generally younger: they are on average less than 20 years old in all major countries with the exception of Russia, Japan and United States, reflecting the fact that gas was only introduced as a fuel for power generation in many countries from the 1990s. Gas plants however have a shorter technical lifetime than coal plants. Of the 2 100 GW of coal-fired capacity in operation worldwide today and the 167 GW under construction, around 1 440 GW could still be operating in 2050 – 900 GW of it in China. Of the 1 800 GW of gas power plants in operation today and 110 GW under construction, only 350 GW are likely to still be operational in 2050.

Figure 1.14 Age profile of global production capacity for key industrial subsectors

Notes: CSAM = Central and South America. HVC = high-value chemicals. Average ages are calculated by region or country, depending on data availability, for 2019. Steel data are calculated based on plant-level data, while cement, ammonia, methanol and HVC calculations are based on historic data on capacity additions at the national level. Sources: Informed by capacity and production data from Steel Institute (2018), Wood Mackenzie (2018), IFA (2020), Platts (2020b), and USGS (2020).

In heavy industry sectors, China again takes centre stage (Figure 1.14). It accounts for nearly 60% of global capacity used to make iron from iron ore – the most energyintensive step in primary steel production. It also accounts for just over half the world’s kiln capacity in cement production and for around 30% of total production capacity for ammonia, methanol and high-value chemicals (HVCs) combined in the chemicals sub-sector. The majority of this capacity is at the younger end of the age range in each asset class, averaging between 10 and 15 years, compared with a typical lifetime of 30 years for chemical plants and 40 years for steel and cement plants. The range of ages of individual plants within the country varies considerably, but the output growth over the last 20 years in China’s steel (more than seven-fold) and cement (nearly fourfold) sub-sectors shows the relatively short time frame over which most of these installations have been added.

Our estimates for the steel industry’s key assets (blast furnaces and direct reduced iron [DRI] furnaces) incorporate plant-level information on the years when plants were most recently refurbished. Taking this information into account implies that European blast furnaces are among the most recently renewed plants on average (a theme discussed in Chapter 7).

The chemical sub-sector has a more even distribution of capacity both regionally and in terms of age than cement and steel industries. Several chemical facilities have been built in recent years in advanced economies such as the United States as well as in the Middle East. Most of the investment in methanol and HVC capacity has taken place in regions with access to low cost petrochemical feedstocks, particularly North America, Middle East and China. The shale revolution has made US ethane (a compound present in natural gas and a key petrochemical feedstock) comparable in price to ethane in the Middle East, leading to a re-balancing in the geographical spread of chemical production capacity. Methanol and HVC plants are on average around ten years old. Ammonia output growth has been slower than that of HVCs and methanol, with emerging economies generally adding these facilities early in their development, in step with agricultural development. Ammonia plants are on average 15 years old, and around 16 years old in China.

Figure 1.15 Building stock by year of construction and share of stock that remains in 2050

Note: Building floor area covers residential, commercial, services, education, health, hospitality, public and other non-residential sectors but excludes industrial premises. Sources: Informed by NRCan (2020), RECS (2020), CBECS (2020), and EU Commission (2020), NBS China (2020).

The energy conversion devices that lead to direct emissions in the buildings sector (e.g. natural gas combustion for space and water heating) have a short lifetime compared with power plants and industrial assets: they tend to last for around 15 years. However, the buildings in which they are housed will shape energy consumption and subsequent emissions from the sector for decades. The average age of the buildings stock is between 12 and 15 years for most emerging economies and 30 to 40 years for advanced economies. About half of today’s buildings stock is likely to be in use in 2050 (Figure 1.15). The average lifetime of a building varies from 30-50 years for commercial buildings to 70-100 years for modern residential construction and 150 years or more for historic buildings, although low-quality construction can reduce the lifetime of residential buildings to 30 years or less, especially in rapidly emerging economies (IEA, 2019g).

Around half of today’s buildings stock is likely still to be in use in 2050.

The age of a building tends to make a big difference to its heating and cooling needs. Buildings constructed before 1960 for example, can require three-times (or more) as much heat as those built in accordance with current building codes. Building energy codes increase efficiency and reduce energy needs, with the energy requirements of new buildings reducing by around 20% since 2000 globally and by more than 30% in the United States and the European Union8 (IEA, 2019h). However, the long life of buildings and a relatively small number of renovations means that overall progress is slow: around 60% of the global building stock in use today was erected when there were no code requirements regarding energy performance, and this rises to 85% or more in most emerging economies.

Figure 1.16 Age profile and geographic distribution of road transport vehicles

The global vehicle fleet is generally young, with about 70% of cars, trucks and buses being less than ten years old (Figure 1.16). The global passenger car fleet in 2019 reached about 1 billion vehicles. As cars age, many get exported from advanced economies to emerging economies where they may be driven for many more years. The lifetime of cars, trucks and buses is roughly comparable, but trucks in particular are used very intensively by their first owner over a period of three to five years, and as a result they are typically used infrequently for low-intensity operations by the time they reach a decade or more of age.

The past decade has seen a dramatic shift the location of where new cars are sold, with China surpassing the European and North American market in the early 2010s. Emerging economies have gone from accounting for less than 25% of new car sales in 2005 to making up about half of global sales today (IEA, 2019f). The result is that the car fleet in emerging economies is newer than in advanced ones. Around 85% of the cars on China’s roads are less than a decade old; in Europe, Japan and North America, cars manufactured within the past ten years make up only about 70% of the fleet. The same general pattern is seen with trucks and buses, but the shifts in new sales of each of these modes are even starker: the majority of trucks sold in the past decade are in emerging economies, as are two-thirds of the buses. With recent declines in car sales in China and India, global car sales may peak in the coming few years.

Figure 1.17 Age profile and geographic distribution of aircraft

While about 70% of the global aircraft fleet operating in 2019 was built after 2000, aircraft may continue to operate for 50 years or more (Figure 1.17). The median age of the fleet is around 15 years. Newer aircraft predominantly are providing additional capacity to service rapidly growing demand in Asian Pacific commercial passenger aviation markets. Aircraft operating in Europe are roughly of median age on average, while aircraft servicing the North American market tend toward the older end of the distribution range.

References

Hood M (2021) World’s ageing big dams pose ’emerging risk’. phys.org

Posted in Airplanes, Automobiles, Concrete, Dams, Electricity Infrastructure, Energy Infrastructure, Limits To Growth, Manufacturing & Industrial Heat, Oil & Gas, Transportation Infrastructure, Trucks | Tagged , , , , , , | 5 Comments

Far Out power #6: Stale beer, crayfish shells, and burning metal powder

Preface. Unfortunately, turning beer into biogas requires a pandemic so that it isn’t drunk at pubs instead. Scientists assure us there will be more pandemics as we mow down (rain)forests for shopping malls and come into contact with new viruses, so fair warning, buy the beer before it turns into biogas…

Alice Friedemann www.energyskeptic.com  author of “When Trucks Stop Running: Energy and the Future of Transportation”, 2015, Springer, Barriers to Making Algal Biofuels, and “Crunch! Whole Grain Artisan Chips and Crackers”. Podcasts: Collapse Chronicles, Derrick Jensen, Practical Prepping, KunstlerCast 253, KunstlerCast278, Peak Prosperity , XX2 report

* * *

2020. ‘Liquid Gold’: Stale beer turned into renewable energy in Australia. Euronews.

Millions of litres of beer have been lying stale in Australia’s pubs and clubs amid the coronavirus pandemic. But, rather than let it all go to waste, the expired beer is being converted into renewable energy to help power a wastewater treatment plant. The beer biodegrades under high temperatures in large digester tanks, using natural bacterial processes which release biogas. This biogas, in turn, generates electricity. At SA Water’s Glenelg Wastewater Treatment Plant, just west of Adelaide, the beer is combined with another type of waste, sewage sludge. Together, the blend creates a strong biogas which is used to power the whole facility. The wastewater plant has been re-purposing 150,000 litres of expired beer every week – enough to power 1,200 houses in total. 

Zejun L et al (2020) Synthesis of 3D-interconnected hierarchical porous carbon from heavy fraction of bio-oil using crayfish shell as the biological template for high-performance supercapacitors. Carbon.

The Chinese Academy of Sciences (CAS) made it possible to use crayfish shell as the biological template for high-performance supercapacitors. Shells were dried, ground and pretreated in an alkaline solution to retrieve templates, which were then mixed with the heavy fraction of bio-oil derived from agricultural waste to manufacture hierarchical porous carbons, a kind of supercapacitor material. This method possesses an environmentally friendly solution for the power storage problem of the rapidly growing market for wearable displays, electric vehicles and smartphones.

[ The best part I think are the yummy crawfish, if the researchers are tired of eating them at the laboratory, I am willing to help out ]

Burn Metal Powder

Ground very finely, iron powder burns at high temperatures, releasing energy as it oxidizes in a process that emits no carbon and produces easily collectable rust, or iron oxide, as its only emission. And other metals besides iron can be used. The two solid fuel boosters that helped the old U.S. space shuttle to reach its orbit each contained 80 tons of aluminum powder, which was 16% of the total weight of the solid fuel.

But metal powders are not renewable and are inefficient. They are an energy carrier, like hydrogen or batteries, not a primary energy source. Although energy return on invested is one way to think of whether a new kind of energy might work, and the energy needed to create metal powder is likely greater than the power you’d get from burning it, an even simpler consideration is that if an energy source isn’t primary then it will be an energy sink.

Burning iron powder to generate electricity could approach a theoretical efficiency around 40% with the other 60% lost in the steam turbine generation processes.

Since civilization would crash if trucks stopped running, the foremost problem the world faces is how to replace diesel fuel. But metal powders can’t be used in internal combustion engines, though it might be possible in a steam engine. But those are so huge and heavy, that like batteries, would keep a truck from going anywhere. And even if that problem were overcome, metal powder isn’t renewable and takes energy to create.

The idea is not to use metal powders as a primary energy source, but as a way to store, transport and trade it as a zero-carbon fuel.

After combustion, of course, you’re left with a pile of rust—iron oxide.

Bergthorson 2018 Recyclable metal fuels for clean and compact zero-carbon power. Progress in Energy and Combustion Science 68: 169-196

Blain L (2020) World first: Dutch brewery burns iron as a clean, recyclable fuel. Newatlas.com.

Hellemans A (2015) Metal Powder: the New Zero-Carbon Fuel? IEEE Spectrum.

Posted in Biofuels, Far Out | Tagged , , | Comments Off on Far Out power #6: Stale beer, crayfish shells, and burning metal powder

Not enough rare metals to scale up solar power


Preface. Sunshine may be free, but the materials to make solar contraptions sure aren’t.  Since sunshine arrives in a diluted form, vast expanses of solar photovoltaic panels will be needed to produce the world’s 24,000 Terawatt hours of electrical power that are now mainly generated by highly energy dense fossils such as oil and coal. Some people have taken as tab at how much land:

  • 586,000 square km (226,256 square miles) of the Earth’s surface with solar panels to generate all the world’s energy needs (here)
  • 496,805 square kilometers (191,817 square miles) (here)

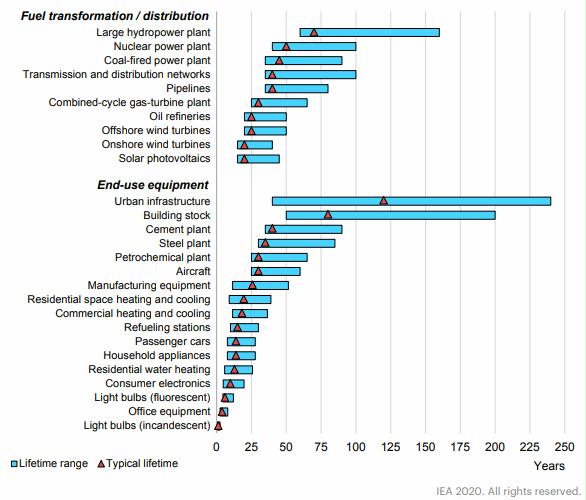
The authors diminish how huge this would be by dismissing this area as a small fraction of global land, but it’s not just the expense or area of panels.  Add on the immense amount of energy and expense for roads, transmission lines, substations, and replacing the panels every 18 to 25 years (Ferroni and Hopkirk 2016).  And for what? This site and my books “When trucks stop running” and “Life after fossil fuels” explain why electricity can’t run heavy-duty transportation or manufacturing. End of story. Solar panels can’t be made or delivered to their final site.

Leena and Höök (2015) looked at the materials required to scale solar generation up to Terawatts of power, and found that CdTe, CIGS, a-Si and ruthenium-based Grätzel solar cells will all be limited by material availability and only able to provide small shares of the present world energy consumption. This is because they depend on Indium, tellurium, germanium, ruthenium, and other materials having a potentially tight supply due to their scarcity, difficulty of being recycled, and competition with other products (i.e. pigments, coatings, plastics, alloys, electronic devices, lasers, diodes, LED lights, metallurgy). Yes, there are indeed Limits to Growth.

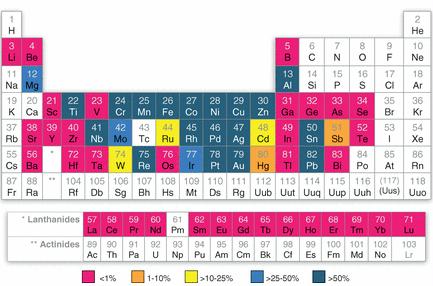
Silver was not investigated, but a recent analysis indicated that silver could form a serious bottleneck for the large scale construction of concentrated solar power (the mirrors) and silicon technologies that use silver as an electrode material [19].

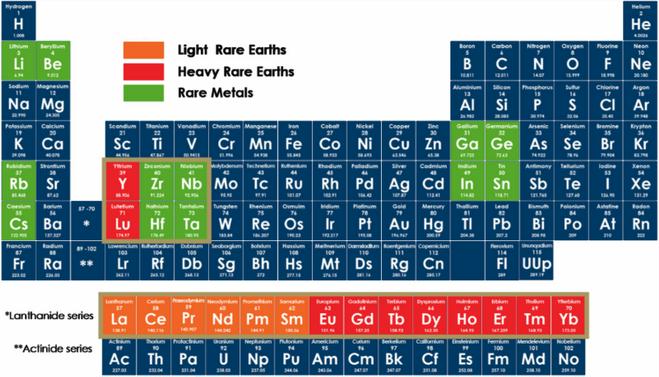
Solar panels and wind turbines not only need rare metals, they are embedded in a system that needs them too — rechargeable batteries, computers, the electric grid, complex circuits, require specific rare metals such as neodymium, electronic indium, silver, praseodymium, dysprosium, and terbium (Thompson 2018).

For solar and wind alone, neodymium and indium production need to grow by more than 12 times by 2050, neodymium by seven times, and silver  three times, yet dozens of other industries need them as well (Exter 2018).

Ten percent of global energy is used in mining.  It takes a lot of fossil fuels to  mine, blow up hillsides to get at rocks, transport ore, crush ore, mill into fine pieces and infuse with chemicals, smelt in a blast furnace, fabricate into parts, and ship to assembly factories.  Lower grade ores are even more energy intense, so the production of rare minerals will also be constrained by energy shortages in the future.  And a financial downturn could limit the production of minerals as well.

Peak conventional oil arrived in 2018, yet new mines take 10-20 years to construct. Time is running out.

And there simply aren’t enough minerals and energy on earth to make a transition to “renewables”: Simon P. Michaux (2021) The mining of Minerals and the Limits to growth video

Alice Friedemann  www.energyskeptic.com Women in ecology  author of 2021 Life After Fossil Fuels: A Reality Check on Alternative Energy best price here; 2015 When Trucks Stop Running: Energy and the Future of Transportation”, Barriers to Making Algal Biofuels, & “Crunch! Whole Grain Artisan Chips and Crackers”.  Podcasts: Crazy Town, Collapse Chronicles, Derrick Jensen, Practical Prepping, KunstlerCast 253, KunstlerCast278, Peak Prosperity

* * *

Leena, G., Höök, M. (2015) Assessing Rare Metal Availability: Challenges for Solar Energy Technologies. Sustainability 7: 11818-11837

Abstract: Solar energy is commonly seen as a future energy source with significant potential. Ruthenium, gallium, indium and several other rare elements are common and vital components of many solar energy technologies, including dye-sensitized solar cells, CIGS cells and various artificial photosynthesis approaches. This study surveys solar energy technologies and their reliance on rare metals such as indium, gallium, and ruthenium. Several of these rare materials do not occur as primary ores, and are found as byproducts associated with primary base metal ores. This will have an impact on future production trends and the availability for various applications. In addition, the geological reserves of many vital metals are scarce and severely limit the potential of certain solar energy technologies. It is the conclusion of this study that certain solar energy concepts are unrealistic in terms of achieving TeraWatt (TW) scales.

Continued oil dependence is environmentally, economically and socially unsustainable [1]. Peaking of conventional oil production has been a topic of interest for more than 50 years [2]. Anthropogenic emissions of greenhouse gases and potentially harmful climatic change are strongly connected to future hydrocarbon combustion [3], so reducing fossil fuel use has been an integral part of climate negotiations. All this has resulted in renewed interest in alternative energy systems. IPCC states that the present energy system is not sustainable and that the solar energy could become a significant contributor to the energy infrastructure [4].

Solar energy is commonly seen as a future energy source with significant potential. The amount of energy that the Earth receives from the sun in a single hour is many times greater than the combined output of fossil energy. Harvesting this abundant solar influx could, in theory, supply mankind with all the energy it demands for millions of years.

However, Ion concluded that the supply potential of an energy source is generally dependent on concentration [5]. Numerous inexhaustible energy sources exist, but their practical significance is often hampered by low energy density. This applies to solar energy as it arrives in dilute form (up to 2500 kWh/m2 annually depending on location) requiring significant area in comparison with more concentrated energy sources such as coal or nuclear.

To mitigate the low energy concentration in solar rays, numerous technical solutions have been put into practice while others are being developed. Photovoltaic solar cells of various types capable of converting the solar rays directly to electricity are already in the market, while concentrating solar power based on thermal cycles is another solution. Another possibility is artificial photosynthesis, aiming at mimicking natural photosynthesis, which can convert solar energy to carbohydrates or even hydrogen for easy storage and human consumption. New renewable energy forms (geothermal, solar energy, wind) only account for roughly 1.1% of the primary energy consumed in the world [6]. IPCC estimates that direct solar energy constitutes only 0.1% of the primary energy supply [7].

The path to a solar future is long, and significant amounts of work, research and development remain before solar energy will be a major energy supplier.

It is also necessary to investigate solar energy feasibility using a life-cycle perspective. Power plant installations consume concrete, steel, plastics and similar everyday materials that are available in relative abundance and can be easily produced.

Other materials are uncommon or even rare and can only be produced in small volumes or by complex measures. Some of these rare materials, mainly metals, are essential parts in certain solar energy technologies.

Historically, the most important obstacle for solar energy has been high costs in relation to competing energy sources. If economics are disregarded and future solar energy systems assumed to achieve a globally significant scale, the underlying reliance on rare metals might appear as one limiting factor. Ruthenium, gallium, indium and several other metals are essential components of certain solar energy technologies, such as dye-sensitized cells, thin-film cells and other innovative solar energy technologies. More general approaches have also raised the importance of rare metals for high technology such as the CRM Innonet (Critical Raw Materials Innovation Network) financed by the European Commission [8].

The infrequent occurrence of these rare materials makes it necessary to ask whether they could limit the growth of future solar energy expansion plans. Some researchers have already considered material constraints for future solar energy applications [9–12]. There are assessments of natural resource requirements for renewable energy systems, but they often dismiss potential resource constraints on inadequate grounds [13,14]. In this study, geological endowment of important minerals and the required production methods for obtaining usable products are discussed. Reserve and resource data were compiled from various geological assessments, mainly from the United States Geological Survey [15]. Based on the findings, rough estimates are calculated for possible electricity production based on respective PV technologies. The findings are finally discussed from a sustainability perspective.

Solar Energy and Rare Metals.  The resource base for solar energy can be regarded in practical terms as limitless. However, due to the dilute nature of solar energy, only a small fraction of this energy flow can be transformed into a form usable for society. A useful metaphor is the distinction between tank and tap. Although the tank may be enormous, it is the size of the tap that matters for users. It is only incoming solar radiation that can be transformed into useful energy that matters for society. Thus, electricity is the required output from most solar energy systems.

Some solar thermal technologies aim to use the heat of solar radiation for direct heating or for powering conventional steam cycles. These systems generally rely on mirrors that concentrate solar energy on a single point or a line. Fresnel lenses and parabolic troughs are simple and inexpensive approaches that can achieve temperatures of 400–600 °C. Point focusing systems are more complex, but can reach temperatures as high as around 1200 °C. Solar-powered Stirling engines [16], parabolic trough systems [17], and concentrating solar power systems [18] have all been discussed more comprehensively by others. The mirrors are plated with silver due to the high optical reflectivity of this metal. Silver is not investigated in further detail in this study, but a recent analysis indicated that silver could form a serious bottleneck for the construction of concentrated solar power on a large scale [19].

Photovoltaics (PV) or solar cells are alternative ways of harvesting solar energy by converting light directly into electricity. Today, roughly 90% of the PV market is dependent on silicon [20]. Current and foreseeable solar energy markets will probably be dominated by silicon technologies. Silicon-based PV systems, forming the first generation of solar cells, will not be discussed in any detail since silicon is a common material. However, silicon technologies commonly use silver as an electrode material and this dependence is discussed in detail by Grandell and Thorenz [19].

Thin-film photovoltaics are referred to as second generation PV technologies. These involve several approaches dependent on rare metals. Third generation photovoltaic technology has currently reached a pre-market stage. Such technologies include dye-sensitised solar cells (DSSC), organic solar cells, and other novel approaches.

Thin-Film Solar Cells consist of thin photoactive layers, typically in the range of 1–4 µm thick, leading to a light-weight structure. A semiconducting material is deposited on a common material such as glass or polymer. The need for semiconducting material is greatly reduced and could be up to 99% less compared to c-Si based technology [21]. However, cost advantages from low material use are somewhat offset by a lower electricity generation efficiency. Silicon thin-films can be produced by chemical vapor deposition. Depending on the process, one can obtain amorphous, microcrystalline or polycrystalline structures. The solar cells made from these materials tend to have lower energy conversion efficiency than bulk silicon, but the production technology is very cost effective. The semiconducting material can be deposited on cheap materials, and both flat and curved surfaces are possible. As a transparent conducting oxide, typically an indium-tin-oxide (ITO) film with a thickness of 60 nm will be sputtered on the p-side of the semiconductor [22]. Amorphous silicon suffers from optically induced conductivity changes that lead to efficiency losses, resulting from the Staebler-Wronski effect [23], but this can be alleviated by doping Ge into the structure. The efficiency of the cells is in the range of 11.6% [24].

Tellurium is classified as a critical metal [21], and is used in cadmium-telluride (CdTe) technology, which is currently the most commercially successful thin-film application in the market. The band gap of CdTe cells is 1.4 eV, which is very close to the ideal value of 1.5 eV [25]. Modules have achieved 17.5% efficiencies and the best reported cell efficiencies are as high as 20.4% [24].

CIGS cells are another successful thin-film technology based on a compound semiconductor made of copper, indium, gallium, and selenide. Copper/indium/selenide (CIS) and copper/gallium/selenide (CGS) form a solid solution with the chemical formula of Cu(InxGaz)Se2, where the value of x can vary from 1 (pure copper indium selenide) to 0 (pure copper gallium selenide). The material is a tetragonal chalcopyrite crystal structure, and a band gap can be varied between 1.04 eV (CIS) and 1.7 eV (CGS) through different material combinations [25]. Recently 15.7% module efficiency has been reported [24]. Selenide can also be substituted by sulfur.

Dye-Sensitized Solar Cells function on a different principle than first and second generation technologies. The incoming light is absorbed by a dye sensitizer that is anchored to the surface of a mesoporous oxide film, typically TiO2. The dye gets excited by a photon, and the resulted electron is injected into the conduction band of the film. The electrons diffuse to the anode and are conducted over an external load to the cathode. The construction of the solar cell and its operation principle are explained in detail by Gong [26].

The appeal of dye sensitized solar cells is that they rely on fairly abundant and inexpensive materials.

Manufacturing does not require elaborate equipment, and the simplicity of this type of solar cell can potentially lead to good price/performance ratio. However, the most efficient cells generally rely on dyes that are derived from rare metals.

The dye is essential for photovoltaic performance and needs to be carefully selected to fulfill several technical requirements related to light absorption, ability to anchor the dye on the semiconducting oxide, electron transfer properties between the dye and the semiconductor oxide and stability. Thus far, the dyes are based on metal complexes of ruthenium. These dyes are superior to all other known dyes in terms of light absorption. The highest performance achieved is 11.1%, exhibited by the black dye, an atrithiocyanato-ruthenium complex [26]. Other approaches on an organic metal-free basis are being developed [27].

The idea of a Concentrating Photovoltaic System is to generate concentrated illumination with the help of systems of lenses or mirrors. The concentration factor can vary from 2 suns (low concentration) to 100 suns (medium concentration) or up to 1000 suns (high concentration). The concentrated solar radiation is then directed to a small area of high-efficiency multijunction (MJ) solar cells.

Multijunction systems are currently the most proficient PV systems and can reach over 44% efficiency [24]. The fundamental difference between multi-junction solar cells and c-Si solar cells is that there are several junctions connected in series instead of one. This is to better cover the solar spectrum. To achieve a working MJ cell, various suitable materials are placed in layers. Each layer is optically in series, with the highest band gap material at the top. The first junction receives the entire incoming spectrum. Photons above the band gap of the first junction are absorbed in the first layer. Photons below the band gap of the first layer pass through to the lower layers to be absorbed there.

The thermodynamic Carnot cycle efficiency can be approached if all solar photons can be converted to electricity. In theory, it can be shown that 59% efficiency can be achieved with four junction devices [28] and as the number of junctions approaches infinity, the efficiency can reach as high as 68% [29]. However, it is difficult to construct such opto-electronically matched junctions, and thus commercial devices are either tandem or triple-junction cells. Typical materials used in multi-junction cells are InGaP (band gap 1.67 eV) for top layers, GaInAs or GaAs (1.18 eV) for middle layers and Ge (0.66 eV) as a bottom layer [30].

There are various emerging solar cell technologies, still far from commercial markets. Organic photovoltaics (OPV) are based on cheap, abundant, non-toxic materials and a high-speed roll-to-roll manufacturing process. However, problems related to low conversion efficiency and instability over time make it difficult to foresee the future potential of the technology. Other novel technologies still in the fundamental development phase include quantum dots or wires, quantum wells, and super lattice technologies [21].

Technologies aimed at mimicking photosynthesis are also a way of converting solar energy to satisfy human needs. These approaches are commonly grouped in a field known as artificial photosynthesis. They are not directly similar to photovoltaics, but also tend to rely on rare metals. Natural photosynthesis uses light-harvesting complexes to collect incident photons, which participate in chemical reactions to produce carbohydrates and oxygen from carbon dioxide. However, natural photosynthesis observed in plants has very low efficiencies (typically ~1%) for biomass production and this has stimulated great interest in creating an artificial counterpart with higher efficiency [31].

Artificial photosynthesis could be used to convert and store solar energy as carbohydrates or alternatively as hydrogen. In theory, this could solve many of the intermittency problems that are related to more conventional forms of solar energy. The rare metal ruthenium is a key component in many approaches and may be a limiting factor for implementation.  other platinum-group metals and nickel might constitute alternatives [32].

Occurrence of Rare Elements

Many of the rare metals used in solar cells occur in low concentration within the Earth’s crust. Most do not occur as primary ores, and are only found as by-products associated with primary base metal and precious-metal ores. This section briefly reviews the geological abundance of some rare elements used in solar energy applications.

Cadmium is primarily extracted from zinc ores, mainly from sphalerite deposits. Cadmium has chemical properties similar to zinc’s and can replace it in crystal lattices of certain ores. Sphalerite ore contains 3%–11% zinc along with 0.0001%–0.2% cadmium and less than 0.0001%–0.01% indium, copper, silver, iron, gold, germanium and thallium [12]. Carbonate-hosted sphalerite in Mississippi Valley-type (MVT) deposits have high cadmium concentrations, while sedimentary exhalative (sedex) occurrences have low concentrations [33]. Certain coals can also have relatively high cadmium content, but they are all sub-economic for the moment [15].

The estimated abundance of indium is 0.1 ppm in the earth’s crust, making it the 69th most abundant element [34]. However, indium is highly dispersed in nature and enriched deposits of economic interest are rare. A comprehensive overview of indium and its mineralogy has been conducted by Schwarz-Schampera and Herzig [35]. Indium is only recovered as a by-product from zinc-sulfide ore mineral sphalerite [15]. Indium can also be found as trace element in deposits of other base metals, but it is generally difficult to process and extract it economically.

Gallium can be found in low concentration in many ores. Burton et al. [36] investigated the presence of gallium in 280 minerals and determined the crustal abundance to be 17 ppm, while Emsley [34] gives an average concentration of 18 ppm. Andersson [9] notes that gallium is approximately as abundant as copper but seldom forms any enriched mineralisation. In contrast, copper is enriched by a factor of 200–800 in mined ores, while gallium rarely occurs in minable concentrations. Such differences will have significant repercussions for production feasibility. Gallium only seems to be concentrated in certain oxide minerals, primarily bauxite but also corundum and magnetite [36]. Bauxite ores contain from 0.003% to 0.008% gallium [37]. World resources are estimated to be 2 million tonnes in bauxite deposits and 6500 tons in zinc deposits [38]. Recent works have also identified certain coals as potentially massive sources [39], although only a small part of the gallium can be recovered in practice [15].

Germanium occurs primarily through silicate minerals in the earth’s crust due to ionic substitution with the silicon ion. Typical concentrations are a few ppm. Moskalyk gives a mean concentration of 6.7 ppm [40], while Höll et al. states an average of 1.7 ppm [41]. The highest enrichments can be found in non-silicate formations as zinc/copper-sulphides, primarily low-iron sphalerite, or in certain coals [42]. In addition, fly ash from certain coals can contain as much as 1.6%–7.5% germanium [40], and may be an important source if proper recovery methods are developed. Furthermore, high concentrations have been commonly found in iron-nickel meteorites, and this suggests that major shares of the earth’s germanium may reside in the planetary core [42]. A review of germanium and its occurrence have been provided by Höll et al. [41].

Both selenium and tellurium are found in low concentrations in copper ores and commonly recovered as side-products from copper refining [43]. Additionally, selenium occurs at concentrations between 0.5 and 12 ppm in various coals, which equals a much larger resource base than the worlds copper ores (USGS, 2015) [15]. Yodovich and Ketris reviewed selenium in coal and pointed out that coal ash has enriched selenium concentrations [44]. However, recovering selenium from coal does not appear likely due to the high volatility of the material [12]. World selenium reserves are estimated to be 120,000 tons derived from copper ores [15].

Tellurium is the 72nd most abundant element in the Earth’s crust, with 5 ppb. Some tellurium minerals are found in nature such as calaverite, sylvanite or tellurite, but are not mined [34]). USGS estimates the world tellurium reserves to be 24,000 tons based on identified copper ores [15], but also mentions the possibility of recovering tellurium from certain gold-telluride or lead-zinc ores. Over 90% of tellurium is produced from anode slimes from copper refining, which can contain as much as 8% tellurium [34].

Ruthenium and platinum are rare elements that occur together with other platinum-group metals. The largest platinum-group metal deposit is the Bushveld Complex in South Africa [15]. Nearly 90% of the world’s known platinum reserves are located in South Africa [45], while other deposits can be found in Russia, North America, and Zimbabwe, and only to a smaller degree in other countries [15]. Andersson highlighted how this dominance of a single country would make platinum group metal supply sensitive to monopolistic behavior and geopolitical issues [9].

Production and Future Outlooks

Mining and processing of ore deposits requires mining, rock blasting, transportation, crushing, milling, and different chemical procedures. The conversion form ore to a marketable commodity is usually an energy intensive process.

Moving to low grade ores inescapably requires more energy input per unit mass unless technological improvements can offset the disadvantages caused by lower ore grades.

As a consequence, production of materials derived from low concentration ores will be sensitive to future energy prices, especially when moving towards lower and lower ore grades.

The rare materials used in several solar technologies chiefly occur as byproducts of base metal ores. Platinum is an exception; PGMs are mined as well as by-products and primary products. As a result, future production of those materials is intrinsically linked to the base metal production. This relationship makes it challenging to significantly increase production of by-products without increasing the production of the main product.

Base Metal Production

About 90% of all zinc production is accomplished by the electrolytic process, while 10% rely on older pyrometallurgical treatment. For lead production, after sintering, lead is usually smelted in a blast furnace. Smelting frees the metal from the oxidized form. About half of lead originates from recycled sources [47]. Copper production is mainly (80%) done by pyrometallurgical processing of sulphide ores, with the remainder being hydrometallurgical treatment of oxide ores. Fthenakis et al. provide a comprehensive overview of copper and zinc production and their flow schemes [12]. Treatment of various residues is the main feedstock for recovering numerous other metals, such as indium or cadmium, as by-products.

More than half of the present world mine production of lead comes from China [15]. In addition, 58% of the global zinc mine production originates from China, Australia and Peru. Nearly 55% of present world copper production originates from Chile (31% alone), USA, Peru, and China. Global production of base metals is not evenly distributed, intrinsically affecting the recovery and supply of by-products.

A similar situation can be seen for bauxite mining and aluminum production. Bauxite is converted via Bayer process to alumina, an aluminum oxide, which is further electrolysed to obtain pure metal. World production of bauxite and aluminum has increased significantly after 1950

Australia and China presently account for roughly 55% of the world bauxite production, and China alone also accounts for 47% of global aluminum production [15].

World production of base metals is unevenly distributed with significant concentration in a few countries, resembling the situation for world supply of fossil fuels [48,49].

Occurrences have been identified in all over the world, but many of them are sub-economic or otherwise unattractive deposits. However, it should be specifically noted that geological abundance has little to do with the likelihood of significant future production, as actual recovery must be both technically and socioeconomically feasible. As a consequence, seemingly abundant but dilute formations may never be attractive for mining, while scarce but highly concentrated deposits can be attractive to exploit.

Recovery of By-Products

Hartman finds that significant shares of the gallium reserves will not be produced in any foreseeable time, simply because they are a by-product of bauxite mining and have to be primarily governed by future aluminum demand [50]. Gallium is extracted from bauxite in conjunction with aluminum oxide based on the Bayer process [37]. The second recovery method involves electrolytic processes with mercury, allowing gallium extraction after addition of caustic soda. Despite environmental challenges surrounding mercury, this method is employed many countries. The last recovery method is based on chelating agents and addition of diluted acids, eventually making gallium recoverable by direct electrolysis. Moskalyk has provided a more comprehensive overview of the production methods and the worldwide suppliers of gallium, which is produced by a small number of producers and world primary production is currently in the order of 400 tons, with additional gallium derived from recycling of scrap electronics containing GaAs.

Germanium production usually consists of two stages, where the first step creates a concentrate and the second is the actual recovery. Hydrometallurgical processes using precipitation are generally preferred. In comparison, thermal and pyrometallurgical processes have inherent complications with the volatility of germanium oxides and sulphides and their environmental challenges. Moskalyk compiled a review of worldwide germanium production and suppliers [40].

More than 90% of the world’s tellurium is recovered from anode slimes collected from electrolytic copper refining, and the remainder is a by-product of lead refineries and from bismuth, copper, and lead ores [15]. Anode slimes are primarily treated to recover gold, silver, platinum, palladium and rhodium, while selenium and tellurium are of secondary priority [12]. The actual percentage of tellurium recovery from anode slimes is variable and depends on concentration. Recovery is done by cementation with copper to form copper telluride. This is further processed to a sodium telluride solution with caustic soda and air. In the next step pure tellurium metal or tellurium oxide are produced for solar cell applications. Fthenakis et al. have compiled a more detailed overview of tellurium production [12]. Important tellurium producing countries are Japan, Russia, and Canada [15].

Cadmium production originates from smelting of zinc and lead-zinc ores. The cadmium sponge, a by-product from precipitating zinc sulphate solution at the zinc smelter is almost pure cadmium (more than 99% purity) and is used as the main feedstock in cadmium recovery facilities [43]. Fumes and dust from zinc sinter plants are also important feedstock for further purification. Comprehensive overview of cadmium recovery processes have been made by Safarzadeh et al. [51]. Commonly, cadmium is seen as a highly toxic metal and cadmium disposal is connected to environmental hazards. Thus, recovering cadmium from primary and secondary sources is of great importance [51]. China and South Korea are the largest producers and account for roughly half of world production, followed by Kazakhstan, Canada, Japan and Mexico [15]. Additionally, recycling of Ni-Cd batteries is also a source for cadmium.

Indium production is similar to cadmium and recovery is chiefly done as a by-product from collected dust, fumes, and other residues from zinc refining. Advantages in indium recovery processing have now increased, and extraction rates have reached 75% of the treatable residues [52]. Many details on the actual production technology are proprietary, but some general recovery methods based on standard methods and general information from producers have been compiled by Fthenakis et al. [12]. More discussions on indium production and worldwide suppliers have been conducted by Alfantazi and Moskalyk [52] and Fthenakis et al. [12]. More than 50% of the world’s primary indium production originates from China [15].

Mined platinum group metal (PGM) ores are initially crushed and grinded before being concentrated in a froth flotation process. Addition of water, air, and chemicals created a froth containing the PGM metals and is collected. Following the matte-smelting process, high purity platinum is refined through a series of hydrometallurgical processes [45]. Ruthenium is recovered as a byproduct during platinum-group metal refining. This is mainly done through insolubility in aqua regia, which leaves a solid residue that can be refined to obtain pure ruthenium, osmium, and other commonly associated metals. Solvent extraction has been described as a method [53], although very little details are available for ruthenium refining methods presently in use. Figure 4 shows the production of indium, selenium and PGMs.

Competition from Non-Solar Energy Sectors

Many of the critical metals discussed here also have important uses other than solar energy applications. Therefore, it can be argued that the assumption that all the available reserves or production of the rare materials would go to solar energy pursuits is unrealistic.

In reasonable cases, only a share of the metal flows would be available for solar energy solutions. How large this share will become is a complicated question and will be affected by several factors, such as how the metals’ intensity in solar applications and the competing markets will evolve. What are the perspectives for substitution, substituting materials or substituting technologies and approaches both in the solar sector and the competing markets?

More than 80% of the world’s cadmium is used to make rechargeable batteries, but other important uses are for pigments, coatings, and platings, stabilizers for plastics, alloys and photovoltaics. However, due to environmental and health concerns significant effort has been made to replace cadmium with other less toxic substances [15].

Gallium has been described as a backbone of the electronics industry and constitutes an important component in semiconductors, diodes and laser systems. Gallium arsenide for semiconductor applications makes up 95% of global gallium consumption [37]. Only some 2% of the produced GaAs is consumed by photovoltaic industry, whereas other uses include electric circuits, laser technology, diodes, and LED lights [22].

The photovoltaic industry is the most important end-use segment of tellurium with a 40% market share. It is followed by thermoelectric modules, which function as a small heat pump and are based on semiconducting materials. Other uses include metallurgy and the rubber industry [54]. Currently photovoltaics form a niche market for selenium, whereas 40% of selenium is consumed for the production of electrolytic manganese, which is a key material component for alkaline and litium-ion batteries. Other uses for selenium are found in the glass industry, agriculture, pigments and metallurgy [54]. About 90% of indium flows in the production of ITO (indium-tin-oxide), which is a transparent, conducting foil used in flat display panels and thin-film coatings. Other end-uses include solders, cryogenics, and special alloys. The electrical industry, including photovoltaics, is responsible for only 3% of the global indium consumption [55].

Ruthenium is used for creating wear-resistant electrical contacts, thick film chip resistors, and for various catalyst applications. The electrical industry is the most important ruthenium consuming sector, with a market share of over 60% [57]. Currently almost no ruthenium is used in the photovoltaics and solar energy industries.

In summary, many of the materials used here will be subjected to competition regarding usage. In some places it is possible to switch to substitutes, but likely several sectors will continue to rely on the same rare metals that several solar energy technologies are built around. The kind of financial repercussions this will bring should be investigated more closely and taken into account in any holistic study of economic long-term feasibility.

Recycling of Scarce and Rare Metals

Valero and Valero point out that there is no substitute for metals if they are irretrievably dispersed by human use [58].  Therefore, recycling is an important factor for making the best possible use of produced metals and should be encouraged. To some extent, recycled material can also help with balancing production from mining by alleviating mismatches in supply and demand.

However, recycling does not increase recoverable volumes. It is only a way to reuse some of the already mined materials again and prevent them from being locked up in scrap heaps or waste disposals. It is important to remember that recycling is only something that makes the use of materials more sustainable while it is incapable of removing intrinsic limits caused by recoverable volumes.

Some of the metals discussed here are already extensively recycled or reused—gallium in particular, as the world primary gallium production capacity in 2011 was estimated to be between 260 and 320 tons, while the recycling capacity was 198 tons [15].

This analysis uses the amount of known global metals reserves or resources as bases and calculates the maximum PV electricity production, which can be achieved with the given amount of metal. One can thus argue that this approach intrinsically includes recycling with the very optimistic assumption of a 100% recycling rate.

Material Consumption of Solar Technologies

Harvest solar energy is often seen as abundant, rich, and lasting supply of energy without any practical constraints. That is not entirely true, as the conversion technologies are dependent on raw material inputs necessary for construction. Solar energy technologies harvest renewable energy, but there are no such things as renewable power plants. Material availability or production bottlenecks may lead to significant constraints for the necessary building components for solar energy technologies.

This section explores whether scarcity of certain key materials may provide an upper limit for some selected solar energy technologies. Similar studies were performed by Andersson and others [9,59]. No good material consumption estimates could be found for artificial photosynthesis approaches, but it is expected to be at a similar magnitude as the other solar energy technologies.

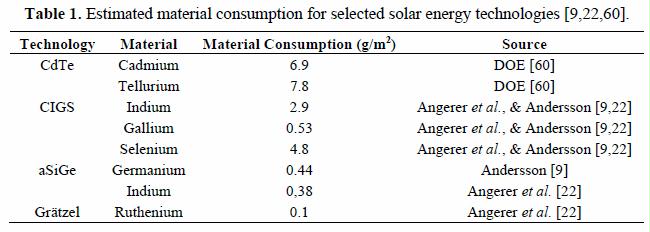
Material requirement per square meter for solar energy is a key property, as the incoming energy must be harvested over large areas. Table 1 gives some estimated material consumptions for relevant technologies. These consumption figures are based on a 100% material utilization [9,22], which is optimistic because it entirely ignores process losses. However, this optimistic assumption may compensate for some of the potential reductions in material requirements since year 2000.

Leena 2015 available reserves and solar limits

Solar insolation can be as high as over 2000 kWh/m2 per annum at excellent sites like the desert areas of Sahara or in Australia, where clouds are virtually nonexistent. For comparison the global average insolation value is 1700 kWh/m2. The average value for Central Europe and Northern Europe is in the range of 1000 kWh/m2.

The last two columns in Table 2 give the annual electricity production of the respective solar technology, assuming that 50% or 100% of the respective world material reserves are devoted to solar cell fabrication. For comparison, the present global primary energy demand is over 13,371 million tons of oil equivalents (MTOE) [6].

A more comprehensive study would naturally use more realistic assumptions about solar hours related to geographical location into account than in this study. However, we do not believe that such details would change the overall picture that material constraints pose a challenge for moving solar technology from its present small scale (134 GWp installed capacity by the end of 2013, resulting in ~14 Mtoe globally) to production of globally significant amounts of energy [61].

Even though the consumption of rare materials is only a few grams per square meter, the diffuse influx of solar energy requires large areas to provide significant energy amounts. This results in considerable material use that could possibly surpass production capacity and resource availability for rapid growth rates.

Available reserves and resources were mostly taken from the USGS where available [15]. Reserve (or resource) data on some metals did not allow the USGS to make estimates compatible with their standards. In such cases, reserve estimates were taken from other sources: ruthenium, germanium [34], indium [62], gallium [38], and germanium [63].

Leena 2015 Table 2 supply constraints

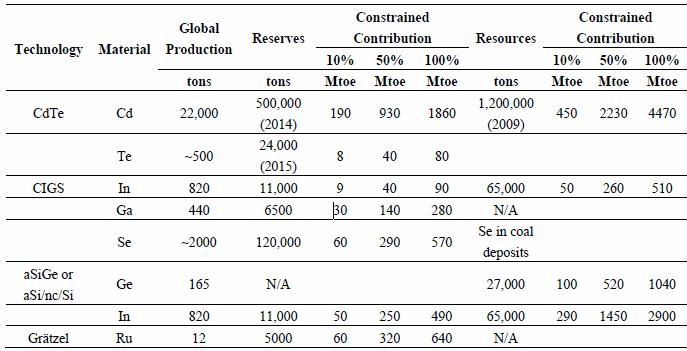
Table 2. Potential contribution to future world energy supply constrained by available reserves and resources. Three cases with 10%, 50% and 100% diversions to solar energy applications were considered. For comparison, world primary energy consumption in 2014 was slightly more than 13,000 Mtoe, final energy consumption 4700 Mtoe and electricity consumption 1600 Mtoe [6].

Table 2 shows the results of the analysis in a matrix with respect to global reserves—and when possible to global resources—and with three different resource allocations to the solar sector, namely 10%, 50% and 100%. Depending on competing end-uses for the critical metals, different resource allocations seem reasonable. Global reserves reflect those deposits, which can be mined with current technology economically. Thus, figures related to reserves show a minimum level of how much solar energy can be produced with the technologies in question. Global resources can be understood as an upper limit. The estimations are very uncertain, and for some metals, even missing, and therefore estimations based on resources should be viewed critically.

  1. Discussion

For CdTe the constraining metal is tellurium. Currently 40% of the annual tellurium markets are consumed in the photovoltaic industry. The USGS does not give any resource estimation for reasons of data accuracy, and therefore the estimation used in the analysis refers to global tellurium reserves. In this case and assuming 50% market share, electricity production from CdTe panels would be limited to 40 Mtoe annually. However the reserve figure considers only tellurium from the anode slimes of copper refining with a currently relatively low recovery rate of approximately 40%. Fthenakis argues that the recovery rate could technically be as high as the recovery rate for copper in the electrolytic refining process, 80%. Even higher rates, such as 95% for gold, would technically be possible [64]. The question is more economical in nature, i.e., whether the price of tellurium is a sufficient incentive for higher recovery rates. In addition to copper mines, other geological reserves for tellurium exist, such as by-product in lead-zinc ores, primary tellurium mines, ocean crusts and sour oil and gas [65]. However, no resource estimation exists for these additional sources and therefore they are excluded from the analysis. Also the material intensity has a potential for remarkable improvements by a factor of four as shown by Woodhouse et al.: the efficiency can be almost doubled while, at the same time, the active layer thickness can be cut to 1 µm. It is however, not yet clear to what extent this potential will become reality for commercial applications [66]. In the optimistic case, this would allow more than 300 Mtoe or 3500 TWh of annual electricity production. This is comparable with the cumulative capacity of 0.9–1.8 TWp until 2050 modelled by Fthenakis [64].

Grätzel cells are constrained by the availability of ruthenium, which is currently used mostly in the electrical industry. Even if half of the known reserves were devoted to solar cell production, only some 300 Mtoe could be annually produced. CIGS technology is constrained by both indium and gallium. Indium is consumed currently to 90% for ITO production. Even if all available indium resources were to be used in the solar industry—an unrealistic assumption—a maximum of some 500 Mtoe as annual production seems plausible. Another technology dependent on indium is based on amorphous silicon. The dependency on germanium can be avoided by a tandem structure, which also has a stabilizing effect on the efficiency of the module. Thus, the constraining metal is indium. ITO films are also used beside solar energy in various other application areas such as flat panel displays, plasma displays or touch panels. Therefore, the upper limit for electricity produced by amorphous silicon seems to be in the range of some hundreds of Mtoe annually.

Silicon is the second most abundant element in the Earth’s crust, making up approximately one fourth of it when measured by mass. However, Grandell and Thorenz foresaw a problem with scaling up silicon technologies due to material constraints from silver, commonly used as an electrode material, and estimated the upper limit to be some 13,000 TWh annual electricity production or 1000 Mtoe [19]. This estimate is based on a very low silver content (0.82 g/m2), which already reflects a technical approach to reduce silver consumption, such as the “wrap through technology” or substitution of silver with copper, both of which are currently in development stage. Indium currently used in ITO could possibly be replaced by FTO (fluorine doped tin oxide) and AZO (aluminium doped zinc oxid).

The above mentioned figures can be compared with world primary energy consumption (13,000 Mtoe), world final energy consumption (4700 Mtoe) or world electricity production (1600 Mtoe). All figures refer to the year 2014 [6]. The world energy sector is expected to experience a shift away from fuels towards electricity due to climate concerns and energy security questions. Currently one third of the global final energy consumption is due to the traffic sector, mainly consisting of oil consumption. In the future this will be to a large degree electricity consumption. Additionally, the rising economies in the developing world are another factor stressing the need for more electricity production. If we assume that 50% of the currently known global resources of Te and 10% of the resources of Ru and In are devoted to the solar industry, we could generate 500 Mtoe, or in the most optimistic case, 800 Mtoe of solar electricity annually. Additionally c-Si technology provides more potential for PV electricity generation, but the technology is constrained by silver dependence and it remains to be seen to which degree new approaches with decreased silver content will enter the market.

If a future global energy system based on solar energy is sought, it is vital to consider material challenges or alternatively focus on other technological pathways than those explored here. A practical path for future research is use of alternative and more abundant materials if solar energy is to become a sustainable backbone of the global energy system. Todorov et al. showed that thin-films based on the abundant copper-zinc-tinchalcogenide kesterites (Cu2ZnSnS4 and Cu2ZnSnSe4) could reach over 9.6% conversion efficiency [67]. The selenium usage in these cells could in theory be entirely replaced by sulphur, creating a thin-film cell only relying on abundant materials. For certain other technologies, such as dye-sensitized cells, it would be fairly easy to replace scarce or rare materials with more abundant ones. Organic dyes that do not required noble metal complexes have been discussed by Hara et al. [68].

  1. Conclusions

When summarizing several promising solar energy technologies, it was found that they rely on several critical metals as important components. Many technologies are likely going to face constraints in material supply if scaled to the TW level (Table 2). Material questions are an important factor for the development of several future solar energy technologies. Without a holistic treatment of required material questions, solar energy production outlooks should be regarded with sound skepticism. Increasing demand for scarce materials may become a factor of importance in the future. Many of the unusual materials are key ingredients to various technologies, including several of the more promising solar energy applications.

There are prospects for reducing material requirements by significant amounts for CIGS and CdTe by utilizing even thinner films and advanced light trapping technologies [9,66]. Large scale development of the studied solar technologies would likely require either substantial reductions in material intensity, technical advancements in electricity generation efficiency or increased world mineral reserves as well as significant increases in mine production.

These results points to obstacles for certain solar technologies when it comes to reaching a TW scale. Indium, tellurium, germanium and ruthenium are in potentially tight supply. Research and development paths that aim to circumvent the dependence on rare materials are generally encouraged from a longer perspective. Additionally, the constraints imposed by nature on critical metals may direct solar energy research to usage of other materials in the long run. Solar energy technologies that do not require rare elements are the only feasible technology for large-scale implementation. CdTe, CIGS, a-Si and ruthenium-based Grätzel cells will all be limited by material availability and only able to provide small shares of the present world energy consumption (Table 2). It is important to use CIGS, CdTe and the other technologies discussed in this study as bridges to alternative and less limited solar energy applications.

References

Exter PV, et al. 2018. Metal demand for renewable electricity generation in the Netherlands. Universiteit Leiden.

Ferroni F, Hopkirk RJ (2016) Energy Return on Energy Invested (ERoEI) for photovoltaic solar systems in regions of moderate insolation. Energy Policy 94: 336–344

Thompson A. 2018. We Might Not Have Enough Materials for All the Solar Panels and Wind Turbines We Need. Popular Mechanics.

  1. International Energy Agency (IEA). World Energy Outlook 2014; Organisation for Economic Co-operation and Development OECD/IEA: Paris, France, 2014.
  2. Miller, R.G.; Sorrell, S.R. The future of oil supply. Philos. Trans. R. Soc. A 2014, doi:10.1098/rsta.2013.0179.
  3. Höök, M.; Tang, X. Depletion of fossil fuels and anthropogenic climate change—A review. Energy Policy 2013, 52, 797–809.
  4. Edenhofer, O.; Pichs-Madruga, R.; Sokona, Y.; Farahani, E.; Kadner, S.; Seyboth, K.; Adler, A.; Baum, I.; Brunner, S.; Eickemeier, P.; et al. (Eds.) Climate Change 2014: Mitigation of Climate Change. Contribution of Working Group III to the Fifth Assessment Report of the Intergovernmental Panel on Climate Change; Cambridge University Press: Cambridge, UK; New York, NY, USA, 2014.
  5. Ion, D.C. World energy supplies. Proc. Geol. Assoc. 1979, 90, 193–202.
  6. International Energy Agency (IEA). Key World Energy Statistics 2014. Available online: http://www.iea.org/publications/freepublications/publication/key-world-energy-statistics-2014.html (accessed on 20 March 2015).
  7. Edenhofer, O.; et al. (Eds.) IPCC Special Report on Renewable Energy Sources and Climate Change Mitigation; Prepared by Working Group III of the Intergovernmental Panel on Climate Change; Cambridge University Press: Cambridge, UK; New York, NY, USA, 2012; p. 1075.
  8. CRM Innonet. Available online: http://www.criticalrawmaterials.eu/ (accessed on 13 May 2015).
  9. Andersson, B.A. Materials availability for large-scale thin-film photovoltaics. Prog. Photovolt. Res. Appl. 2000, 8, 61–76.
  10. Feltrin, A.; Freundlich, A. Material considerations for terawatt level deployment of photovoltaics. Renew. Energy 2008, 33, 180–185.
  11. Fthenakis, V. Sustainability of photovoltaics: The case for thin-film solar cells. Renew. Sustain. Energy Rev. 2009, 13, 2746–2750.
  12. Fthenakis, V.; Wang, W.; Kim, H.C. Life cycle inventory analysis of the production of metals used in photovoltaics. Renew. Sustain. Energy Rev. 2009, 13, 493–517.
  13. Davidsson, S.; Höök, M.; Wall, G. A review of life cycle assessments on wind energy systems. Int. J. Life Cycle Assess. 2012, 17, 729–742.
  14. Davidsson, S.; Wachtmeister, H.; Grandell, L.; Höök, M. Growth curves and sustained commissioning modelling of renewable energy: Investigating resource constraints for wind energy. Energy Policy 2014, 73, 767–776.
  15. U.S. Geological Survey (USGS). Mineral Commodity Summaries. Available online: http://minerals.usgs.gov/minerals/pubs/mcs/ (accessed on 30 March 2015).
  16. Kongtragool, B.; Wongwises, S. A review of solar-powered Stirling engines and low temperature Differential Stirling engines. Renew. Sustain. Energy Rev. 2003, 7, 131–154.
  17. Price, H.; Lüpfert, E.; Kearney, D. Advances in Parabolic Trough Solar Power Technology. J. Sol. Energy Eng. 2002, 124, 109–125.
  18. Treib, F.; Nitsch, J.; Kronshage, S.; Schillings, C.; Brischke, L.A.; Knies, G.; Czisch, G. Combined solar power and desalination plants for the Mediterranean region—Sustainable energy supply using large-scale solar thermal power plants. Desalination 2003, 153, 39–46.
  19. Grandell, L.; Thorenz, A. Silver supply risk analysis for the solar sector. Renew. Energy 2014, 69, 157–165.
  20. 20. Fraunhofer ISE. Photovoltaics Report (2014) Updated:24 October 2014. http://www.ise.fraunhofer.de/en/downloads-englisch/pdf-files-englisch/photovoltaics-report-slides.pdf
  1. International Renewable Energy Agency (IRENA). Renewable Energy Technologies: Cost Analysis Series. Volume 1: Power Sector. Solar Photovoltaics. https://www.irena.org/DocumentDownloads/Publications/RE_Technologies_Cost_AnalysisSOLAR_PV.pdf
  2. Angerer, G.; et al. Rohstoffe für Zukunftstechnologien. Einfluss des branchenspezifischen Rohstoffbedarfs in rohstoffintensiven Zukunftstechnologien auf die zukünftige Rohstoffnachfrage; Fraunhofer IRB Verlag: Stuttgart, Germany, 2009.
  3. Staebler, D.L.; Wronski, C.R. Optically induced conductivity changes in discharge-produced hydrogenated amorphous silicon. J. Appl. Phys. 1980, 51, 3262–3268.
  4. Green, M.A.; Emery, K.; Hishikawa, Y.; Warta, W.; Dunlop, E.D. Solar cell efficiency tables (version 44). Prog. Photovolt Res. Appl. 2014, 22, 701–710.
  5. Kemell, M.; Ritala, M.; Leskelä, M. Thin Film Deposition Methods for CuInSe2 Solar Cells. Crit. Rev. Solid State Mater. Sci. 2007, 30, 1–31.
  6. Gong, J.; Liang, J.; Sumathy, K. Review on dye sensitized solar cells (DSSCs): Fundamental concepts and novel materials. Renew. Sustain. Energy Rev. 2012, 16, 5848–5860.
  7. Hwang, S.; Lee, H.W.; Park, C.; Lee, H.; Kim, C.; Park, C.; Lee, M.H.; Lee, W.; Park, J.; Kim, K.; et al. A highly efficient organic sensitizer for dye-sensitized solar cells. Chem. Commun. 2007, 46, 4887–4889.
  8. King, R.R.; Bhusari, D.; Larrabee, D.; Liu, X.Q.; Rehder, E.; Edmondson, K.; Cotal, H.; Jones, R.K.; Ermer, J.H.; Fetzer, C.M.; et al. Solar cell generations over 40% efficiency. Prog. Photovolt. Res. Appl. 2012, 20, 801–815.
  9. Birkmire, R.W. Compound polycrystalline solar cells: Recent progress and Y2 K perspective. Sol. Energy Mater. Sol. Cells 2001, 65, 17–28.
  10. Guter, W.; et al. Current-matched triple-junction solar cell reaching 41.1% conversion efficiency under concentrated sunlight. Appl. Phys. Lett. 2009, doi:10.1063/1.3148341. 31. Concepcion, J.V.; House, R.L.; Papanikolas, J.M.; Meyer, T.J. Chemical approaches to artificial photosynthesis. Proc. Natl. Acad. Sci. USA 2012, 109, 15560–15564.
  11. Osterloh, F. Inorganic Materials as Catalysts for Photochemical Splitting of Water. Chem. Mater. 2008, 20, 35–54. 33. Schwartz, M.O. Cadmium in Zinc Deposits: Economic Geology of a Polluting Element. Int. Geol. Rev. 2000, 42, 445–469.
  12. Emsley, J. Nature’s Building Blocks: An A-Z Guide to the Elements, 2nd ed.; Oxford University Press 2011.
  13. Schwarz-Schampera, U.; Herzig, P.M. Indium: Geology, Mineralogy, and Economics; Springer: Heidelberg, Germany, 2002; p. 257.
  14. Burton, J.D.; Culkin, F.; Riley, J.P. The abundances of gallium and germanium in terrestrial materials. Geochim. Cosmochim. Acta 1959, 16, 151–180.
  15. Moskalyk, R.R. Gallium: The backbone of the electronics industry. Miner. Eng. 2003, 16, 921–929.
  16. Greber, J.F. Gallium and Gallium Compounds. In Ullmann’s Encyclopaedia of Industrial Chemistry, 6th ed.; John Wiley & Sons: Hoboken, NY, USA, 2002; p. 30080. 39. Dai, S.; Ren, D.; Li, S. Discovery of the superlarge gallium ore deposit in Jungar, Inner Mongolia, North China. Chin. Sci. Bull. 2006, 51, 2243–2252.
  17. Moskalyk, R.R. Review of germanium processing worldwide. Miner. Eng. 2004, 17, 393–402.
  18. Höll, R.; Kling, M.; Schroll, E. Metallogenesis of germanium—A review. Ore Geol. Rev. 2007, 30, 145–180.
  19. Bernstein, L.R. Germanium geochemistry and mineralogy. Geochim. Cosmochim. Acta 1985, 49, 2409–2422.
  20. Fthenakis, V. Life cycle impact analysis of cadmium in CdTe PV production. Renew. Sustain. Energy Rev. 2004, 8, 303–334.
  21. Yudovich, Y.E.; Ketris, M.P. Selenium in coal: A review. Int. J. Coal Geol. 2006, 67, 112–126.
  22. British Geological Survey. Mineral Profile, Platinum. Available online: http://www.bgs.ac.uk/ mineralsUK/statistics/mineralProfiles.html (accessed on 30 March 2015).
  23. Rosa, R.N.; Rosa, D.R.N. Exergy cost of mineral resources. Int. J. Exergy 2008, 5, 532–555.
  24. International Lead and Zinc Study Group. Statistics. Available online: http://www.ilzsg.org/static/ statistics.aspx?from=5 (accessed on 15 April 2015).
  25. Höök, M.; Hirsch, R.; Aleklett, K. Giant oil field decline rates and their influence on world oil production. Energy Policy 2009, 37, 2262–2272.
  26. Höök, M.; Zittel, W.; Schindler, J.; Aleklett, K. Global coal production outlooks based on a logistic model. Fuel 2010, 89, 3546–3558.
  27. Hartman, H.L. SME Mining Engineering Handbook, 1st ed.; Society for Mining, Metallurgy & Exploration Inc.: Ann Arbor, MI, USA, 1992; p. 2394.
  28. Safarzadeh, M.S.; Bafghi, M.S.; Moradkhani, D.; Ilkchi, M.O. A review on hydrometallurgical extraction and recovery of cadmium from various resources. Miner. Eng. 2007, 20, 211–220.
  29. Alfantazi, A.M.; Moskalyk, R.R. Processing of indium: A review. Miner. Eng. 2003, 16, 687–694.
  30. Khan, M.A.; Morris, D.F.C. Application of solvent extraction to the refining of precious metals II. purification of ruthenium. Sep. Sci. Technol. 1967, 2, 635–644.
  31. Selenium Tellurium Development Association. Available online: www.stda.org (accessed on 30 March 2015).
  32. Polinares. Fact Sheet: Indium. Polinares Working Paper Nr. 39. Available online: http://www.polinares.eu/ docs/d2-1/polinares_wp2_annex2_factsheet5_v1_10.pdf
  33. USGS. Minerals Yearbook 2012. Germanium [Advance release]. Available online: http://minerals. usgs.gov/minerals/pubs/commodity/germanium/myb1-2012-germa.pdf (accessed on 15 March 2015). 57. Matthey, J. Platinum 2012; Johnson Matthey Public Limited Company: Hertfordshire, UK, 2012; p. 64.
  34. Valero, A.L.; Valero, A. A prediction of the exergy loss of the world’s mineral reserves in the 21st century. Energy 2011, 36, 1848–1854.
  35. Andersson, B.A.; Jacobsson, S. Monitoring and assessing technology choice: The case of solar cells. Energy Policy 2000, 28, 1037–1049.
  36. U.S. Department of Energy. Critical Materials Strategy. Available online: http://energy.gov/sites/ prod/files/DOE_CMS2011_FINAL_Full.pdf (accessed on 15 April 2015). 61. International Energy Agency (IEA). PVPS Report: Snapshot of Global PV 1992–2013. Preliminary Trends Information from the IEA PVPS Programme. http://www.iea-pvps.org/fileadmin/dam/public/report/statistics/PVPS_report_-_A_Snapshot_of_ Global_PV_-_1992-2013_-_final_3.pdf
  37. Mikolajczak, C. Availability of Indium and Gallium. http://www.commodityi ntelligence.com/images/2010/jan/11%20jan/availability_of_indium_and_galliumwhite_papermik olajczak_sept09.pdf
  38. Elsner, H.; Melcher, F.; Schwarz-Schampera, U.; Buchholz, P. Elektronikmetalle—Zukuenftig steigender Bedarf bei unzureichender Versorgungslage?; Commodity Top News Nr. 33; BGR: Berlin, Germany, 2010.
  39. Fthenakis, V. Sustainability metrics for extending thin-film photovoltaics to terawatt levels. MRS Bull. 2012, 37, 1–6.
  40. Houari, Y.; Speirs, J.; Candelise, C.; Gross, R. A system dynamics model of tellurium availability for CdTe PV. Prog. Photovolt. Res. Appl. 2014, 22, 129–146.
  41. Woodhouse, M.; et al.; Eggert, R. Perspectives on the pathways for cadmium telluride photovoltaic module manufacturers to address expected increases in the price for tellurium. Sol. Energy Mater. Sol. Cells 2013, 115, 199–212.
  42. Todorov, T.K.; Reuter, K.B.; Mitzi, D.B. High-Efficiency Solar Cell with Earth-Abundant Liquid-Processed Absorber. Adv. Mater. 2010, 22, E156–E159.
  43. Hara, K.; Sato, T.; Katoh, R.; Furube, A.; Yoshihara, T.; Murai, M.; Kurashige, M.; Shinpo, A.; Ito, S.; Suga, S.; et al. Novel Conjugated Organic Dyes for Efficient Dye-Sensitized Solar Cells. Adv. Funct. Mater. 2005, 15, 246–252.
Posted in Alternative Energy, Mining, Peak Critical Elements, Peak Rare Earth Elements, Photovoltaic Solar, Recycle, Recycling | Tagged , , , , , , , | 5 Comments

Why rare and valuable metals are not recycled

metal recycling ratesGlobal estimates of end-of-life recycling rates for 60 metals and metalloids. Source: Reck, B. K. et al. 2012. Challenges in Metal Recycling. Science 337: 690-695

Preface. This is a post about why rare and critical metals aren’t recycled at all or at best, just a small percent. Basically it is still cheaper to mine them from scratch than to try to separate them out from electronic devices, and often impossible since they are an alloy or embedded with other metals that chemicals, heat, pressure and other techniques can’t separate out.

Mining and smelting ores is incredibly energy intensive.  As ore quality declines, it will require more and more energy to crush the rock to get the metals out.  But oil quality is declining too (tar sands, fracked oil, and Venezuelan heavy oil require so much energy to process the energy return is very low.  And worse yet, oil is declining and will get more scarce and expensive (world peak oil production peaked in 2018).  Electric mining trucks? Ha. Most sites are too far from the grid, and what electricity they do have comes from diesel powered generators.

Recycling harms health. Especially lead. One in three of the world’s 2.4 billion children under age 20 has a blood level exceeding what would trigger public health alarms in the U.S. The potent neurotoxin can reduce a child’s intelligence test score and cause other health problems; lead poisoning is blamed for nearly $1 trillion of lost lifetime earnings. Most lead enters the environment through poorly regulated smelters that recycle car batteries. Lead poisoning has worsened considerably during the past 2 decades because car sales in those countries have tripled, the report says. Scientists consider no amount of lead exposure safe, but the U.S. Centers for Disease Control and Prevention has set the threshold for action at 5 micrograms per deciliter—the level met or exceeded in 800 million children worldwide (Science 2020).

Alice Friedemann  www.energyskeptic.com  Author of Life After Fossil Fuels: A Reality Check on Alternative Energy; When Trucks Stop Running: Energy and the Future of Transportation”, Barriers to Making Algal Biofuels, & “Crunch! Whole Grain Artisan Chips and Crackers”.  Women in ecology  Podcasts: WGBH, Financial Sense, Jore, Planet: Critical, Crazy Town, Collapse Chronicles, Derrick Jensen, Practical Prepping, Kunstler 253 &278, Peak Prosperity,  Index of best energyskeptic posts

* * *

The more intricate a product and the more minerals used, the better it will perform, but the more difficult it is to recycle the metals essential to making it work so well to begin with

With infinite amounts of energy, money, and time metals could be recycled.  But in the real world it doesn’t happen due to the high cost, complex processes, and large amount of energy it takes to separate material, as well as poor recycling technologies, product design, and social behavior.

Less than 1% of 34 rare and critical metals are recycled.  These metals are essential for microchips, solar PV, consumer electronics — pretty much all high-tech products have them. 

But it is simply thermodynamically impossible to separate and recover many of them since they’re used in such tiny amounts for extremely precise purposes, and mixed with other rare metals (Bloodworth 2014, Reck 2012).

Metals such as tantalum, gallium, germanium, and rare-earth elements are oxidized and lost in the smelter slag (Hageluken 2012).

The most commonly recycled metals are also the cheapest and most abundant on the planet, such as steel, aluminum, copper, zinc, lead, and nickel, with rates often over 50%.  This high recovery rate is due to their presence in relatively pure form in large amounts in products. But even these are reused 2 or 3 times before being lost to landfills.

The methods to recover rare metals are far more complex.  These metals are used in myriad applications, from cell phones to satellites. Up to 60 different elements go into the manufacture of microprocessors and circuit boards (Gunn 2013), usually in tiny quantities and often in combinations not found in nature.

The need to recycle is obvious — only by doing so can the life of these resources be extended to future generations, since ores continue to be of lower and lower grades that need more energy to extract while at the same time the oil, coal, and natural gas energy needed to extract minerals is diminishing.

Even the valuable precious metals only have a recycling rate of 60%, and just a 50% recovery of platinum, palladium, and rhodium from auto catalytic converters because so many old cars are exported to developing countries that don’t have recovery technology.  For the same reason, when it comes to the platinum group metals in electronics, the rate is even lower, just 5 to 10%.

Many of these metals are highly toxic to plants and animals, yet they’re recycled at very low rates, one of the reasons a fifth of China’s arable land is polluted with toxic heavy metals (Chin 2014). One of the worst, cadmium, is mainly recycled from nickel-cadmium batteries, but at very low rates.  Mercury recovery is at best 10-20% recovered from fluorescent light bulbs.  Ecotoxicity from metal-containing nanomaterials is also a problem.

The US Geological survey estimates the average recycling rate for most metals is 50% (Papp 2007). This means that after just 4 recycles, we’ve lost 95% of the original amount.

This is a shame, because most metals used in electronic devices use rare earth metals for which there is no substitution with the same efficiency.  And a shortage of some looms, the reserves-to-production ratio for gallium, germanium, and indium (indispensable for touch screens and other displays) is estimated to be less than 20 years of supply (Frondel et al. 2006).  Less than 1% of rare elements are cycled from e-waste. It’s too expensive to recycle them, so they end up in furnaces burned up with the plastic boards containing them.  The few places rare earth metals are recovered don’t want to share their proprietary methods with other potential recyclers.

Worse yet, planned obsolescence is alive and well.  Objects are still designed to break down and impossible to repair, forcing customers to buy a new one.

Thermodynamics is the ultimate limitation at the final processing stage and can’t be separated out.

Material is lost along the way

  1. Initial collection: a fraction of overall electronic equipment is turned into recycling centers, the percent depends on social and government factors.
  2. Recycling centers: much of the electronic waste is sent to countries that have inadequate recycling facilities
  3. Preprocessing & Sorting – some components are too much effort to take apart, so they’re discarded. Nor is there enough material to justify the cost of machine recycling technology.
  4. Recycling technology: Usually just shredding, crushing, magnetic sorting is done.  It’s too expensive to recover even more with lasers, near-infrared, or x-ray sorting.
  5. Product design: often makes it hard to separate products out, such as laminated permanent magnets in computers.
  6. Smelter – the easier, larger, most common metals make it to the smelter, i.e. iron, aluminum, etc.  Not all material that was collected and could be smelted reaches the smelters, especially if smelters are distant.

Downcycling (Bardi 2014).

One of the big problems with waste recycling is known as “downcycling”, because the recycled material isn’t as good as the original product. Consider steel.  Although we recycle 68% of iron and steel, the problem is that the original steel was custom-made for a particular application to be hard or strong or corrosion resistant.  This is done by adding other elements and creating an alloy with the needed properties (i.e. chromium, cobalt, silicon, manganese, vanadium, and other elements).  Trying to control the concentration of these other metals during recycling is so complex and expensive that it usually isn’t done.  As a result, recycled steel is lower-quality since it can’t be counted on to be as hard, strong, or corrosion-resistant and can’t be re-used in many industries.

Every time paper is recycled its fibers get shorter which makes an inferior product. Downcycling prevents perpetual recycling.

Similarly, when different kinds of plastics are mixed the resulting plastic has poor mechanical properties with limited uses.

Beverage cans have magnesium mixed in with the aluminum, requiring several more stages of separation to be transformed back into pure aluminum.

In all cases, recycling grows more difficult as the recycled fraction increases or higher performance is needed from the recycled material.

In the end, that takes more money and energy, which is why economically justifiable recycling is far less than 100%.  Rare metals like indium and gallium are not recycled at all.

Biellow, David. 9 Aug 2012. Recycling Reality: Humans Set to Trash Most Elements on the Periodic Table. Scientific American

Almost all lead is recycled, among the only elements on the periodic table to earn that distinction. With good reason, mind you: the soft metal is a potent neurotoxin known to impact children’s brain development, among other nasty health effects. Today, nearly all lead is used in batteries (though it was once put into gasoline, leading to widespread contamination, and, in places like Afghanistan, still is.) Most of this dangerous element is now endlessly cycled from battery to battery, thanks to stringent regulations (though enough of it ends up being improperly recycled to constitute one of the world’s worst pollution problems.)

In principle, all metals are infinitely recyclable and could exist in a closed loop system, note the authors of a survey of the metals recycling field published in Science on August 10. There’s a benefit too, because recycling is typically more energy-efficient than mining and refining raw ore for virgin materials. Estimates vary but mining and refining can require as much as 20 times the amount of energy as recycling a given material. Think about it: a vast amount of energy, technology, human labor and time are expended to get various elements out of the ground and then that element is often discarded after a single use.

Lead is not alone in being recycled, of course. Aluminum, copper, nickel, steel and zinc all boast recycling rates above 50% (though not much above 50%). The same principles can be usefully applied to other materials, like plastics. After all, these ubiquitous polymers are made from another scarce resource oil and many are, in principle, recycleable. Yet, the overall recycling rate for plastics, grouped as a whole, is only 8% (as of 2010, per EPA numbers.) Take the case of polypropylene (or #5 plastic if you’re checking the bottom of your food containers). The bulk of this polymer that gets recycled comes from car batteries. It is, in essence, tagging along with the lead. In other cases water bottles, yogurt cups, you name it it simply disappears into the nation’s landfills.

Meanwhile, the majority of elements on the periodic table and we use almost every element on the periodic table for something or other are also nearly completely unrecycled.

As an example, industrial ecologists Barbara Reck and T.E. Graedel of Yale University compare the fates of nickel versus neodymium. Nickel is ubiquitous, particularly as an alloy for steel. Of the 650,000 metric tons of the silvery-white metal that reached the end of its useful life in one product in 2005, roughly two-thirds were recycled. And that recycled nickel then supplied about one-third of the demand for new nickel-containing products. That means the overall efficiency of human use of nickel approaches 52%. Not bad, but there’s room for improvement, given that almost half of all nickel is only used once before it is discarded.

Nearly 16,000 metric tons of neodymium a so-called rare earth metal were employed in 2007, mostly for permanent magnets in everything from hybrid cars to wind turbines. Roughly 1,000 metric tons of the element reached the end of its useful life in one product or another and “little to none of that material is currently being recycled,” the survey authors note. This despite the fact that a “rare earth crisis” stems from China’s near monopoly of the neodymium trade.

Mining for neodymium is not benign (which is why the world lets China monopolize its production). And it’s not just neodymium. Mining waste or tailings, leach ponds, slurries and the like are among the world’s largest chronic waste problems. North America alone produces 10 times as much mining waste as it does the municipal solid waste (as it’s known) from all the neighborhoods in the U.S. Much of that is just rock, sand and dust the mountaintop in mountaintop removal mining. And mined products also cause waste further down the product line, such as the ash leftover after the coal is burned (the U.S.’s largest single form of waste).

This issue of profligate use gets worse: we are currently making this problem even harder to solve. How? One word: gadgets. In most gadgets you can think of, tiny amounts of rare elements are used to enhance functionality. As the industrial ecologists write in Science: “The more intricate the product and the more diverse the materials set it uses, the better it is likely to perform, but the more difficult it is to recycle so as to preserve the resources that were essential to making it work in the first place.” It’s as true of iPhones as it is of photovoltaic panels and none of them have shown much success in being recycled. “End of life losses will also increase sharply soon,” unless something changes, the industrial ecologists warn.

Then there are the alloys, where thermodynamics dictate that the alloying element is almost always going to be lost due to the difficulty of separation. That means the chromium used in stainless steel will usually lose its luster, for example. Worse, this form of contamination can mean that the recycled alloy can’t be re-used manganese-aluminum alloys are unsuitable once recycled for 95 percent of the uses for aluminum. As a result, “current designs are actually less recycleable than was the case a few decades ago,” the authors note. Perhaps the use of such metal combinations should be minimized?

In the end, our approach to recycling is bizarre, given our resources. “Few approaches could be more unsustainable,” Reck and Graedel write. In the end, we’ll learn to reuse all the elements of the periodic table, or we’ll lose elements to use.

REFERENCES

Bardi, Ugo. 2014. Extracted: How the Quest for Mineral Wealth Is Plundering the Planet. Chelsea Green Publishing.

Bloodworth, A. 2014. Track flows to manage technology-metal supply. Recycling cannot meet the demand for rare metals used in digital and green technologies. Nature 505: 19-20.

Chin J, et al. 2014. China details vast extent of soil pollution. About a fifth of nation’s arable land is contaminated with heavy metals. Wall Street Journal.

Frondel, M., et al. 2006. Trends der angebots- und nachfragesituation bei mineralischen rohstoffen. Federal ministry of economics and energy.

Gunn, A. G. 2013. In Proc. 12th Bienn. Soc. Geol. Appl. Miner. Depos. Meet (SGA, 2013)

Hageluken, C et al. 2012. Precious Materials Handbook, Ch 1. Hanua-Wolfgang.

Papp, J. F. 2007. 2005 minerals yearbook: recycling—metals. U.S. Geological Survey.

Pihl, E., et al. 2012. Material constraints for concentrating solar thermal power. Energy 44: 944-954

Reck, B. K. et al. 2012. Challenges in Metal Recycling. Science 337: 690-695

Science. 2020. News at a glance. One in three children poisoned by lead.

Wadia, C. et al. 2009. Materials Availability Expands the Opportunity for Large-Scale Photovoltaics Deployment. Environ. Sci. Technol 43: 2072-2077


Posted in Peak Critical Elements, Peak Platinum Group Elements, Peak Precious Elements, Peak Rare Earth Elements, Recycle, Recycling, Ugo Bardi | Tagged , , , , , , , , | 5 Comments

What are rare earth metals and how are they used?

Preface.  After oil, the main feature of new products will be drastic simplification. The re-use of existing stuff. Lack of precision machine tools as they rust away. Back to basics: wood, iron, and clay.

Yet every high-tech object depends on critical, rare earth, platinum group, and precious metals that are often controlled by just China or one or two other nations.  At least there are dozens of countries to import oil from. But China is building mines all over the world and that makes supply chains quite vulnerable, especially as China uses its own metals to make products and not export these elements.  They’re gaining such control that it’s like Saudi Arabia buying up all the other oil fields in the world. And they not only control the mined minerals, they control the entire supply chain all the way up to finished products.

Mining is one of the most nasty, polluting, activity on earth. It uses 10% of fossil energy, so it can’t survive oil decline.  And because the remaining ores are so dispersed and have low concentrations of metals, it takes more and more energy to get them at a time when energy is declining.

Clearly rebuildable devices like wind and solar, which depend on hundreds of other devices like computers, electronics, satellites, and so which all are built with rare earth elements is not sustainable, clean, or green. A pyrrhic victory for China, turning their landscapes into Mordor for flash-in-the-pan temporary electronic goods while the oil age lasts.

Alice Friedemann www.energyskeptic.com  author of “Life After Fossil Fuels: A Reality Check on Alternative Energy”, April 2021, Springer, “When Trucks Stop Running: Energy and the Future of Transportation”, 2015, Springer, Barriers to Making Algal Biofuels, and “Crunch! Whole Grain Artisan Chips and Crackers”. Podcasts: Collapse Chronicles, Derrick Jensen, Practical Prepping, KunstlerCast 253, KunstlerCast278, Peak Prosperity , XX2 report

***

Light rare earths:  (La) Lanthanum (Ce) Cerium (Pr) Praseodymium (Nd) Neodymium (Sm) Samarium

Heavy rare earths: (Eu) Europium (Gd) Gadolinium (Tb) Terbium (Dy) Dysprosium (Ho) Holmium (Er) Erbium (Tm) Thulium (Yb) Ytterbium (Lu) Lutetium (Y) Yttrium

Their properties:

  • Silvery-white/gray in color
  • High luster but tarnish readily in air
  • Most REE compounds are strongly paramagnetic
  • Catalytic, chemical, electrical, metallurgical, nuclear, magnetic and optical properties
  • High electrical conductivity
  • Many REE fluoresce strongly under UV light
  • High melting and boiling points
  • Reacts with dilute acid to release H2 rapidly at room temperature
  • Reacts with H2O to liberate H2 slowly when cold and quickly upon heating

Rare Earth & Platinum-group metals are used in many products:

  1. Magnets (Neodymium, Praseodymium, Terbium, Dysprosium, Samarium): Motors, disc drives, MRI, power generation, microphones and speakers, magnetic refrigeration
  2. Metallurgical alloys (Lanthanum, Cerium, Praseodymium, Neodymium, Yttrium): NimH batteries, fuel cells, steel, lighter flints, super alloys, aluminum/magnesium
  3. Phosphors (Europium, Yttrium, Terbium, Neodymium, Erbium, Gadolinium, Cerium, Praseodymium): display phosphors CRT, LPD, LCD; fluorescent lighting, medical imaging, lasers, fiber optics
  4. Glass and Polishing (Cerium, Lanthanum, Praseodymium, Neodymium, Gadolinium, Erbium, Holmium, Baryte): polishing compounds, decolorizers, UV resistant glass, X-ray imaging
  5. Catalysts (Lanthanum, Cerium, Praseodymium, Neodymium, ruthenium, rhodium, palladium, osmium, iridium, platinum): petroleum refining, catalytic converter, diesel additives, chemical processing, industrial pollution scrubbing

Applications with Rare Earth elements or Critical elements:

  • Aerospace: Beryllium
  • Aluminum production (fluorspar), alloys (Magnesium, Scandium)
  • Automobiles (Cerium, dysprosium, Europium, lanthanum, neodymium, Praseodymium, terbium, Yttrium)
  • Catalytic converters (Cerium)
  • Cathode-ray tubes (Gadolinium, Terbium, Yttrium)
  • Ceramics (Fluorspar)
  • Computer chips (Indium)
  • Defense (Neodymium, Praseodymium, Dysprosium, Terbium, Europium, Yttrium, Lanthanum, Lutetium, Scandium, Samarium)
  • Drilling oil and gas (Baryte)
  • Electric bicycles: 0.1 kg neodymium, praseodymium per bicycle
  • Electric vehicles 1.7 kg of Neodymium & Praseodymium (Nd) per car (Bohlsen 2017), Neodymium (Niobium) electric motors (Samarium)
  • Electronics and electricity (Tungsten)
  • Fertilizers
  • Fire retardants (Antimony)
  • Fiber optics (Germanium, Erbium Europium, Terbium, Yttrium)
  • Flourescent light bulbs (europium, terbium, yttrium)
  • Fuel cells (SOFC use lanthaneum, cerium, prasedymium)
  • Healthcare (Baryte, Erbium)
  • Hybrid engines (Dysprosium)
  • Integrated circuits (silicon metal)
  • iPods (dysprosium, neodymium, praseodymium, samarium, terbium)
  • Lasers (Europium, Holmium, Ytterbium)
  • LCD screens (Indium)
  • Lenses (Lanthanum)
  • Light-emitting diodes (LEDs) (Gallium)
  • Lighting (Lanthanum, Samarium, Europium, Scandium)
  • Luminescent compounds (Promethium)
  • Magnets for turbine systems, car parts, scientific instruments, smart phones, electric vehicles, stereo loudspeakers TVs (mainly neodymium, praseodymium)
  • Metallurgy and alloys (Baryte, Cerium)
  • Nuclear power (Europium, Gadolinium, Cerium, Yttrium, Samarium, Erbium, Beryllium, Niodymium)
  • Oil refinery (Cerium)
  • Optics (fluorspar)
  • Phones, computers, hybrid vehicles, magnets (Cobalt)
  • Photovoltaic cells (Germanium, silicon metal)
  • Pigments
  • Satellites (Niobium)
  • Semi-conductors (gallium, Holmium)
  • Solar panels: copper, indium, gallium, selenide (CIGS) solar cells
  • Steel production (coking coal, fluorspar, vanadium, Ytterbium)
  • Superconductors (high-temperature) Bismuth, Thulium, Yttrium
  • Superconductive compounds (Lanthanum)
  • Telecommunications and electronics (Beryllium)
  • Thermoelectric auto generators (Bismuth)
  • Water Treatment
  • Wind turbines up to 150 kg neodymium, praseodymium per MW (Bohlsen), (dysprosium, neodymium, praseodymium, terbium)

Cerium                 Catalytic converters, oil refining, glass-lens production, glass polishing, flints for lighters, water treatment, self-cleaning ovens

Dysprosium        Lasers, nuclear-reactor control rods, high-power magnets

Erbium                  Fiber optics, nuclear reactor control rods

Europium            TV & computer displays, lasers, optical electronics

Gadolinium         Cancer therapy, MRI contrast agent

Holmium              High-power magnets, lasers

Lanthanum         Oil refining cracking catalyst, fuel cells, hybrid-car batteries, camera lenses, carbon arc lamps for T and film industries, camera lenses

Lutetium              Chemical processing LED lightbulbs

Neodymium       Computer hard drives, cell phones, high-power permanent magnets for electric motors, wind turbines, capacitors, lasers, ear bud headphones, microphones

Praseodymium Permanent magnets, coloring pigment in photographic filters, Aircraft engines, carbon arc lights, glass in airport signal lenses, goggles for welders & glassmakers, fluoride glass in fiber optic cables to amplify signals

Samarium            High-power magnets, ethanol, PCB cleansers

Scandium            Aerospace components, aluminum alloys, mercury vapor lamps to make them brighter, aluminum baseball bats, lacrosse sticks, bicycle frames, fuel cells

Terbium               Solid-state electronics, sonar systems

Thulium                X-ray machines, superconductors

Ytterbium            Portable x-ray machines, lasers

Yttrium                 Lasers, TV and computer displays, microwave filters, strengthen glass, magnesium, ceramic, and aluminum alloys

How are they used (2010)

27%        Magnets

18%        Catalysts

16%        Metal alloys

12%        Polishing powder

  8%        Other

  6%        Glass

  5%        Ceramics

  5%        Phosphors

Posted in Alternative Energy, Mining, Peak Rare Earth Elements | Tagged , , , , | Comments Off on What are rare earth metals and how are they used?

Toasters are Toast

Preface. Thomas Thwaites’ book, “The Toaster Project” illustrates why it will be so hard, if not impossible, to bounce back from collapse in the future to anything like what we take for granted today.  Thwaites set about trying to make a simple toaster from scratch. How hard could that be? Well, toasters, it turns out, are not so simple. The most basic toaster Thwaites could find had 404 parts, consisting of steel, mica, plastic, copper, and nickel.

You’d think that plastic would be the easiest, but that is the most recent material in a toaster, since it is derived from petroleum, while humans have been smelting and forging copper and iron for thousands of years.

Alice Friedemann  www.energyskeptic.com  Author of Life After Fossil Fuels: A Reality Check on Alternative Energy; When Trucks Stop Running: Energy and the Future of Transportation”, Barriers to Making Algal Biofuels, & “Crunch! Whole Grain Artisan Chips and Crackers”.  Women in ecology  Podcasts: WGBH, Jore, Planet: Critical, Crazy Town, Collapse Chronicles, Derrick Jensen, Practical Prepping, Kunstler 253 &278, Peak Prosperity,  Index of best energyskeptic posts
***

Iron

What made industrialization possible was fossil fuels, coal to begin with, and later oil and natural gas.   In the future, there may well be lots of fossil fuels left, but most will be miles under the deep ocean, the Arctic, and other places hard to get at or to even now.

To find out how to make iron, Thwaites had to use one of the first metallurgy books ever written from the 16th century.

Modern books don’t tell you how to make iron at home, because you need a multimillion dollar factory.  Figuring out how to use coke (coal roasted to remove impurities), instead of charcoal (since nearly all the trees were gone), to make iron is what started the Industrial Revolution.

It took a long time to figure out how to make iron and steel because there are still several kinds of impurities remaining in the coke, and each impurity requires different processes to remove them.  For example, to remove the oxygen (which causes iron to rust), you need to tempt it away with carbon monoxide at 1200 degrees Celsius (2370 F) which involves a very tricky precise calibration of not too much or too little air and other calibrations.  Check out the contents of Metallurgy for the Non-Metallurgist, Metal Forming: Mechanics and Metallurgy, or Physical Metallurgy Principles in “Look Inside!” Table of contents or Surprise Me! for an inkling of how complex metallurgy is.

It’s not something you can do at home, as Thwaites discovered trying to make iron with coal rather than charcoal.  He resorted to using a microwave oven.

Plastic

Plastics are all derived from natural gas or oil, appliances typically use polypropylene.  They are much harder to make than iron.

Crude oil is composed of hundreds of different hydrocarbon molecules (carbon and hydrogen) ranging from just a few atoms to longer molecules with 30 atoms.  Oil refineries split these molecules into dozens of different products, including propylene, a carbon chain so small it’s a gas, that you need to turn into a solid.

Oil refineries cost billions of dollars, and check out the flow diagram of a typical refinery.  So you can’t refine raw oil at home to get the propylene out. Nor was Thwaite able to talk an oil company into doing this for him.

Even if you managed to do this, plastic is much harder than iron to make.  As Adrian Higson points out to Thwaite (page 115):

Metals are refined physically through heating and cooling.  “We’ve been making iron since the Iron age, but we’ve only been making plastic for about 100 years (most only for 60 years). Plastic needs physical , molecular, and chemical transformations with “strict control of temperature, pressure, mixtures of chemicals, and catalysts” which are difficult to make. Polyethylene is one of the simplest plastics to make, but requires a “minimum of 6 chemical transformations”.

Nor is it easy to melt down and reuse existing plastic, that’s why so little of it is recycled.  This is what Thwaite resorts to, and the result is a sorry mess.

In the end, the project was a failure.  Thwaite says “It worked for a few seconds, but then the element melted itself.  It was quite scary, since there was no insulation on the wires.”

Nor did he make anything from scratch.  Thwaites ended up having to use a microwave to make iron, and melted down existing plastic, after failing to make it from potatoes or raw oil.  He obtained copper by melting coins, and didn’t attempt to make nickel (doesn’t exist within Great Britain, the boundaries of his project).  Only his hunt for mica was successful.

Posted in Manufacturing & Industrial Heat, Peak Resources | Tagged , | 7 Comments

Even Pencils will be hard to make

Preface. Most of us are unaware of how complex our society is, how things are made, how food is grown, how stuff is delivered, and the people, energy, transportation, and kinds and sources of materials in every day objects.  This essay, written over 50 years ago, gives you an idea of how complex the antecedents of simple objects in your life are, how difficult many will be to make locally.   I’ve shrunk and paraphrased much of the essay.

This is also a good way to appreciate the concept of Energy Returned on Energy Invested.  Every single step of gathering the ingredients for a pencil and making it required energy.  Though this is mainly a concern for building devices that will supply energy, like solar panels or nuclear power plants.  If their construction uses more fossil energy than they can deliver, the energy return is negative.  But for pencils it doesn’t matter, unless the materials for it grow too expensive.

After this, I recommend reading my post on the Toaster Project, microchips, and motherboards.

Alice Friedemann www.energyskeptic.com  author of “Life After Fossil Fuels: A Reality Check on Alternative Energy”, April 2021, Springer, “When Trucks Stop Running: Energy and the Future of Transportation”, 2015, Springer, Barriers to Making Algal Biofuels, and “Crunch! Whole Grain Artisan Chips and Crackers”. Podcasts: Collapse Chronicles, Derrick Jensen, Practical Prepping, KunstlerCast 253, KunstlerCast278, Peak Prosperity , XX2 report

***

Read, Leonard E. 1958. I, Pencil My Family Tree.

“…not a single person on the face of this earth knows how to make me.”

This sounds fantastic, especially when there are about 1.5 billion of my kind made in the U.S.A. every year.  Pick me up and what do you see? Not much — some wood, lacquer, printed labeling, graphite lead, a bit of metal, and an eraser.

My family tree begins with … a cedar tree from Northern California or Oregon. Now contemplate the antecedents — all the people, numberless skills, and fabrication:

  • all the saws and trucks and rope and countless other gear to harvest and cart cedar logs to the railroad siding
  • the mining of ore, the making of steel and its refinement into saws, axes, motors
  • the growing of hemp and bringing it through all the stages to heavy and strong rope
  • the logging camps with their beds and mess halls
  • the cookery and the raising of all the foods to feed the men
  • the untold thousands of persons who had a hand in every cup of coffee the loggers drank!

The logs are shipped to a mill in San Leandro, California. Can you imagine how many people were needed to make flat cars and rails and railroad engines, to construct and install the communication systems required? These are just a few of the antecedents.

Consider the mill work in San Leandro. The cedar logs are cut into small, pencil-length slats less than a quarter inch thick. These are kiln dried and then tinted.  The slats are waxed and kiln dried again. How many skills went into the making of the tint and the kilns, into supplying the heat, the light and power, the belts, motors, and all the other things a mill requires? Plus the sweepers and the men who poured the concrete for the dam of a Pacific Gas & Electric Company hydroplant which supplies the mill’s power!

Don’t overlook the ancestors present and distant who have a hand in transporting sixty carloads of slats across the nation.

Once in the pencil factory—worth millions of dollars in machinery and building—each slat is given eight grooves by a complex machine, after which another machine lays leads in every other slat, applies glue, and places another slat on top—a lead sandwich, so to speak. Seven brothers and I are mechanically carved from this “wood-clinched” sandwich.

My “lead” itself—it contains no lead at all—is complex. The graphite is mined in Ceylon. Consider these miners and those who make their many tools and the makers of the paper sacks in which the graphite is shipped and those who make the string that ties the sacks and those who put them aboard ships and those who make the ships. Even the lighthouse keepers along the way assisted in my birth—and the harbor pilots.

The graphite is mixed with clay from Mississippi in which ammonium hydroxide is used in the refining process. Then wetting agents are added such as sulfonated tallow—animal fats chemically reacted with sulfuric acid. After passing through numerous machines, the mixture finally appears as endless extrusions—as from a sausage grinder-cut to size, dried, and baked for several hours at 1,850 degrees Fahrenheit. To increase their strength and smoothness the leads are then treated with a hot mixture which includes candelilla wax from Mexico, paraffin wax, and hydrogenated natural fats.

My cedar receives six coats of lacquer. Do you know all the ingredients of lacquer? Who would think that the growers of castor beans and the refiners of castor oil are a part of it? They are. Why, even the processes by which the lacquer is made a beautiful yellow involve the skills of more persons than one can enumerate!

Observe the labeling. That’s a film formed by applying heat to carbon black mixed with resins. How do you make resins and what is carbon black?

My bit of metal—the ferrule—is brass. Think of all the persons who mine zinc and copper and those who have the skills to make shiny sheet brass from these products of nature. Those black rings on my ferrule are black nickel. What is black nickel and how is it applied? The complete story of why the center of my ferrule has no black nickel on it would take pages to explain.

Then there’s my crowning glory, inelegantly referred to in the trade as “the plug,” the part man uses to erase the errors he makes with me. An ingredient called “factice” is what does the erasing. It is a rubber-like product made by reacting rape-seed oil from the Dutch East Indies with sulfur chloride. Rubber, contrary to the common notion, is only for binding purposes. Then, too, there are numerous vulcanizing and accelerating agents. The pumice comes from Italy; and the pigment which gives “the plug” its color is cadmium sulfide.

Does anyone wish to challenge my earlier assertion that no single person on the face of this earth knows how to make me?

Actually, millions of human beings have had a hand in my creation, no one of whom even knows more than a very few of the others. Now, you may say that I go too far in relating the picker of a coffee berry in far off Brazil and food growers elsewhere to my creation; that this is an extreme position. I shall stand by my claim. There isn’t a single person in all these millions, including the president of the pencil company, who contributes more than a tiny, infinitesimal bit of know-how. From the standpoint of know-how the only difference between the miner of graphite in Ceylon and the logger in Oregon is in the type of know-how. Neither the miner nor the logger can be dispensed with, any more than can the chemist at the factory or the worker in the oil field—paraffin being a by-product of petroleum.

I, Pencil, am a complex combination of miracles: a tree, zinc, copper, graphite, and so on.

Posted in EROEI Energy Returned on Energy Invested, Localization, Supply Chains | Tagged , , , , | 2 Comments

The Fragility of Microchips

Preface. This is an introduction to how microchips are made to give you an idea of how difficult and amazing they are.  This is a very high-level overview gathered mostly from the textbooks of Quirk (2001) and Van Zant (2004). Given the improvements since then, multiply whatever I say many fold as chips have only gotten more complex since them. 

Alice Friedemann  www.energyskeptic.com  Author of Life After Fossil Fuels: A Reality Check on Alternative Energy; When Trucks Stop Running: Energy and the Future of Transportation”, Barriers to Making Algal Biofuels, & “Crunch! Whole Grain Artisan Chips and Crackers”.  Women in ecology  Podcasts: WGBH, Planet: Critical, Crazy Town, Collapse Chronicles, Derrick Jensen, Practical Prepping, Kunstler 253 &278, Peak Prosperity,  Index of best energyskeptic posts

***

Microprocessors are essential, they’re in just about everything

Billions of chips are created every year for a myriad of applications: in autos, airplanes, ATMs, air conditioners, calculators, cameras, cell phones, clocks, DVDs, machine tools, medical equipment, microwave ovens, office and industrial equipment, routers, security systems, thermostats, TVs, VCRs, washing machines – nearly all electrical devices.

Microchip fabrication 

Creating a chip begins by cutting a thin 12 inch slice, called a wafer, from a 99.9999999% pure silicon crystal, one of the purest materials on earth.  Wafers require such a high degree of perfection that even a missing atom can cause unwanted current leakage and other problems in manufacturing later on. This is the platform that about 5000 computer chips will be built on. Each chip will contain millions of transistors, capacitors, diodes, and resistors built by punching and filling in holes in more layers than a Queen’s wedding cake.

Cleanliness

Particles 500 times smaller than a human hair can cause defects in microchips. The more particles that get on a wafer, the greater the chance there is of a killer defect. Some particles are worse than others — a single grain of salt could ruin all the chips on a wafer.  Sodium can travel through layers even faster than stray bits of metal.  Particles that outright kill a chip are caught during the testing phase at the factory.  Sometimes only 20% make to the end.  The traveling particles are insidious, and can cause a chip to malfunction, perform poorly, or die later on (hopefully before your warranty expires).  Consumer reports recommends not even trying to repair a personal computer after four years, and in the two to four year range it’s a tossup whether to repair or buy a new one.

Typical city air has 5 million particles per cubic foot.  There are processes that require a maximum of 1 particle per square cubic foot.

People are among the worst offenders, as far as particle generation goes.  If you walk at a good clip, you emit 7.5 million particles per minute.  Even sitting still, you are still emitting particles.  A smoker is a particle-emitting dragon long after the cigarette, and a sneezing worker is even worse, a veritable Krakatoa.

City water is not pure enough to be used — it’s full of bacteria, minerals, particulates, and other junk. To make city water clean enough requires many filters, UV-light, and other water treatments.  Intel has two plants in drought-stricken Arizona that use 11 million gallons of water a day and even more than that with a new expansion underway. This requires a huge investment in water processing and delivery systems.

Microchip fabrication is primarily a chemical process, requiring ultra-clean 99.9999% chemicals and 99.9999999% gases. About one in five steps use water or chemicals to clean the wafers or prepare their surface for the next layer.

Firemen practically need a chemical engineering degree to inspect and fight fires in a chip fabrication plant. During a fire, they risk being exposed to volatile, flammable, or combustible solvents, and chemicals like arsine, used in chemical warfare.

The chips also require humidity to be just right.  If the humidity is too high, the wafers accumulate moisture, and the layers won’t stick.  Too dry and static electricity will suck particles out of the air and practically glue them to the surface, they’re so hard to remove.

So it shouldn’t surprise you that it costs over billions of dollars to build a clean room. The inside is composed of non-shedding materials, especially stainless steel. Floors have sticky mats to pull dirt off of operators’ shoes.  Pens, notebooks, tools, and mops – everything is built of material that sheds as few particles as possible, but even so, equipment particles cause a third of the contamination.

The slightest vibration can make the expensive machines malfunction, so the plant is built with huge concrete slabs on top of special shock absorbers.  To make the foundation requires 890,000 cubic yards of dirt to be removed and dumped, then filled in with 445,000 cubic yards of concrete with 100,000 tons of embedded steel — more than required by the world’s tallest building, the burj Khalifa in Dubai.

It takes over 100 trucks to bring in the pieces of the huge cranes required for the project, which can life 55-ton chillers.

In order to move large amounts of liquids and gases, the plant needs to be very tall. Intel’s factories top level is 70 feet  high to make room for giant fans to circulate air in the clean room below. Beneath the clean room there are thousands of transformers, pumps, cabinets, utility pipes, and chillers.

How chips are made

Wafers move from workstation to workstation and have different operations performed on them at each one.  Wafer fabrication for a chip might involve 450 processes with operations that overall take several thousand individual steps. The machines that make this all happen include high-temperature diffusion furnaces, wet cleaning stations, dry plasma etchers, ion implanters, rapid thermal processors, vacuum pumps, fast flow controllers, residual gas analyzers, plasma glow dischargers, vertical furnaces, optical pyrometers, and more.

If you were shrunk to chip size and tied to a wafer, you’d go through the car wash from hell.  You’ll be moved along by robotic wafer handlers from one machine to the next, where you’d be layered with different materials, centrifuged, electro-polished, dyed, scraped, heated to 1,800 degrees Fahrenheit, ultrasonically agitated, sputtered, doped, hard baked, dipped in toxic chemical baths, irradiated, blasted with ultrasonic energy, spray-cleaned, dry-cleaned, scrubbed, micro-waved, x-rayed, shot with metal, etched, and probed.

At various points, the chip “Survivor” TV show comes on. Chips are examined at an atomic level for defects, and their electrical functioning tested. They’re usually thrown out if anything is wrong, since most mistakes can’t be fixed.

There are many problems that can cause a chip to fail besides contamination. The wafer must be perfectly flat in structure and while it goes through the workstations.  If the wafer were 10,000 feet high, you’d see bumps or holes no higher than 2 inches – more than that and the layering is thrown off.   If the wrong step was performed after 3,841 correctly performed steps, the chip was under or overheated, the layer didn’t fully stick, was improperly aligned before the next layer was added, or a chemical misapplied, the chip is thrown out.  It’s amazing any chips make it out the door.

After your makeover, you’d emerge in a designer outfit composed of up to 25 layers embedded with millions of transistors, diodes, and resistors.  You’ll find yourself “best in show” at tattoo competitions and irresistible to Terminator fans.

Discussion

Chips are the pinnacle of human achievement, the most complex objects on earth, requiring fabrication plants costing ten billion dollars or more. They require chemicals, water, and air that are up to 99.99999999% pure.  It takes thousands of steps and up to four months to process a wafer, all of them lost in an electricity outage.

Their precision is phenomenal. Before fossil fuels objects could be crafted to within a tenth of an inch. Today chips are created at an atomic level of precision.

They are also subject to a single point of failure. More than 90% of the world’s manufacturing capacity for the most advanced chips is in Taiwan, so any time Taiwan has a drought, earthquake, invaded by China, or can’t get the components needed for chips, the whole world is affected. And some of the machines that make chips are from just one factory. In Germany a fire impacted the only manufacturer making extreme ultraviolet lithography machines used to etch circuits onto silicon wafers for Apple, IBM, and Samsung and other companies (Koc 2022).

Microchips are constructed out of finite critical, precious, platinum group elements, and rare earth elements — 90% of them produced in China.  And all of them mined with declining fossil fuels.

Chips have gotten so complex that their miniaturization has been causing hardware problems for over a decade. With switches just a few atoms wide, hardware failures that aren’t easy to identify are occurring more often. I don’t understand why chips work at all after reading this metaphor: Imagine a computer chip with 1,000 processors and 28 billion transistors is blown up to the scale of a building covering the United States. Finding the failure would be like finding the leaky faucet in just one of the apartments which only happens when the bedroom light is on and front door open.  

There are trillions of tiny switches with billions of transistors in a microprocessor, so even a tiny imperfection can disrupt the billions of calculations taking place every second. About 4% of Google’s millions of computers crashed unexpectedly from errors that couldn’t be detected. A 2020 report by chip maker Advanced Micro Devices discovered the most advanced computer memory chips were 5.5 times less reliable than the previous generation. Other researchers say the switches are wearing out sooner and shortening the lifespan of processors. 

Even really simple objects like pencils and toasters are more complex than you may know. 

Microchips are incredibly important to civilization — like energy, there isn’t a single business endeavor, infrastructure, or electronic device that isn’t dependent on them. 

New cars can have more than 100 semiconductors in their touch screens, computerized engine controls and transmissions, built-in cellular and Wi-Fi connections, collision avoidance systems, cameras and other sensors (Ewing and Clark 2021).

But because of their complexity, precision, dependency on rare minerals, supply chains, single points of failure, natural disasters, and extremely pure materials, they they will be one of the first industries to fail when the electric grid becomes unreliable and oil shortages become common, forcing society to simplify and localize, cascade to the myriad products that need them and making them obsolete as well.

Nearly all knowledge is being stored in electronically on media and devices that will be lost after energy decline, lost to the future generations forever, since fossil fuels and the mostly fossil-fueled electric grid make them possible. Books and microfiche have a finite lifespan as well, about 500 years if stored in optimal environments. I hope there are material scientists, librarians, and others working on more permanent media.  And you can help as well by considering what knowledge you would like preserve, and how we could do so in “Peak Oil and the Preservation of Knowledge“.

The fragility of chips in the news:

Ting-Fang C et al (2021) Taiwan hit by triple blow of drought, blackouts and COVID surge

Zhong R et al (2021) Drought in Taiwan Pits Chip Makers Against Farmers. The island is going to great lengths to keep water flowing to its all-important semiconductor industry, including shutting off irrigation to legions of rice growers. New York Times:  The drought is the worst in over half a century. Chip makers use lots of water to clean their factories and wafers, the thin slices of silicon that form the basis of the chips. Much of the water used by residents is deposited by the summer typhoons. But the storms also send soil cascading from Taiwan’s mountainous terrain into its reservoirs. This has gradually reduced the amount of water that reservoirs can hold.


References Much of above came from the textbooks written by Quirk & Van Zant

Clark D (2022) The huge endeavor to produce a tiny microchip. New York Times.

Ewing J, Clark D (2021) Lack of Tiny Parts Disrupts Auto Factories Worldwide. New York Times.

Koc C et al (2022) ASML keeps part of Berlin manufacturing site shut after fire. Bloomberg.

Markoff J (2022) Tiny Chips, Big Headaches. New York Times.

Quirk M, J. Serda J (2001) Semiconductor manufacturing technology. Prentice Hall.

Van Zant, P (2004) Microchip Fabrication, fifth edition. McGraw-Hill.


Posted in 2) Overshoot, An Index of Best Energyskeptic Posts, Infrastructure & Fast Crash, Interdependencies, Localization, Manufacturing & Industrial Heat, Microchips and computers, Supply Chains | Tagged , , , , , | 8 Comments

Autos need finite rare earth, critical, & precious metals

This image has an empty alt attribute; its file name is rare-earth-metals-in-cars-2011.jpg

An electric car uses five times as many minerals as a conventional car (IEA 2020):

This image has an empty alt attribute; its file name is IEA-2020-EV-5x-more-minerals-conventional-car.jpg

IEA, Minerals used in selected power generation technologies, IEA, Paris https://www.iea.org/data-and-statistics/charts/minerals-used-in-selected-power-generation-technologies

There are 17 rare earth elements (REE) that China controls up to 97% of (Klare 2012, Shumsky 2011). These are essential for transitioning to so-called green energy — not just cars but solar panels, windmills, solar photovoltaic, computers, electronics, the smart grid and more.

While we can import oil from dozens of nations, REE make us dependent on China, and China is also constructing mines all over the world — it’s as if Saudi Arabia bought up all the remaining oil fields.

Mining is the second most toxic, environmentally damaging industry on earth.  So whatever the cost may be, no matter how high, let the Chinese destroy their land.  It’s a cheaper price to pay rather than destroy our own nation’s precious topsoil, which in the long run is the most valuable possession we have.

Already 20% of China’s arable land is polluted with toxic heavy metals from mining and industry.  Plus since conventional oil peaked in 2018, why would we bother to do this, since all of these contraptions are utterly dependent on oil, coal, and gasoline to be constructed for every step of their life cycle?  By the time even a small fraction of our vehicle fleet could be electrified, since it lasts ten to forty years (diesel trucks), and new vehicles are unaffordable for 90% of Americans, the oil age will long be gone and we will have wasted precious time and energy on mining when we could have been insulating homes, conserving energy, and converting industrial agriculture to organic..

 In 2011, nine of the REE were used in cars.  Some EV car motors use REE elements neodymium, terbium, or dysprosium in their magnet motor. Each electric Prius motor requires 1 kilogram (2.2 lb) of neodymium, and each battery uses 10 to 15 kg (22-33 lb) of lanthanum (Gorman 2009). Other EVs use induction motors with copper coils.

Cars using internal combustion engines also use precious and rare earth metals in their catalytic converter: palladium, rhodium, cerium, and/or platinum and the gasoline they burn oil was refined using rare earths, such as lanthanum and cerium, and critical elements like cobalt.

In addition, these applications use rare earth elements, i.e. metal alloys or production process, so cars may also have these as well: Aluminum and steel, ceramics, computer chips, electronics, LCD screen, light-emitting diodes.

If an electric car uses electricity & electric grid or GPS, then these REE and critical elements were indirectly used: Wind turbines (up to 150 kg neodymium & praseodymium per MW), Solar panels (indium, gallium), Photovoltaic cells (Germanium, silicon metal), Steel production (fluorspar, vanadium, Ytterbium), Nuclear power (Europium, Gadolinium, Cerium, Yttrium, Samarium, Erbium, Beryllium, Niodymium), Satellites (Niobium), Semi-conductors (gallium, Holmium), Semi-conductors (gallium, Holmium), Fiber optics (Germanium, Erbium Europium, Terbium, Yttrium), Electronics and electricity (Tungsten) and more.

Already, and increasingly, China controls REE from mining to final production of high-tech goods, and is likely to export REE less and less as they use them for their own high-value products.  Until some point of oil decline that is…

And there simply aren’t enough minerals on earth:

2023 What is the Cost of Electric Vehicle Batteries?

Alice Friedemann  www.energyskeptic.com  Author of Life After Fossil Fuels: A Reality Check on Alternative Energy; When Trucks Stop Running: Energy and the Future of Transportation”, Barriers to Making Algal Biofuels, & “Crunch! Whole Grain Artisan Chips and Crackers”.  Women in ecology  Podcasts: WGBH, Financial Sense, Jore, Planet: Critical, Crazy Town, Collapse Chronicles, Derrick Jensen, Practical Prepping, Kunstler 253 &278, Peak Prosperity,  Index of best energyskeptic posts

***

References

Gorman S. 2009. As hybrid cars gobble rare metals, shortage looms. Reuters.

IEA. 2020. Clean energy progress after the Covid-19 crisis will need reliable supplies of critical minerals. International Energy Agency.

Klare, M. 2012. The Race for what’s left. Picador

Shumsky, T. 2011. Testing Their Metals. Companies are searching for ways to reduce their need for increasingly scarce minerals. Wall Street Journal.

Posted in Automobiles, Peak Rare Earth Elements | Tagged , , , , , , , , , | 1 Comment

How are microchips made?

Preface. Computer chip fabrication plants need to run continuously for weeks to accomplish the thousands of steps needed to make microchips. A half-hour power outage at Samsung’s Pyeongtaek chip plant caused losses of over $43 million dollars (Reuters 2019).

Chip production requires massive amounts of water, but reservoirs in Taiwan are critically low and authorities have already cut supplies to agriculture to support industrial and residential use. Taiwan’s tech manufacturers fear their output is under threat from the island’s worst drought in decades, risking more turmoil for global supply chains already strained by shortages of semiconductors and other key components (Ting-Fang and Li 2021).

An electric grid depending on intermittent power like wind and solar will be up and down too much to make chips, which takes hundreds of steps over several days. If a grid can come up and down that is — blackstarting is not easy and outages can damage transformers.

As oil declines, at some point the energy to mine the materials and to make the precision machines that make the chips, chemicals, etching and other machines will end. But until then, appreciate what you have a lot more!  

Alex commented below about a post at here.  Felix Moreno predicts that because oil peaked in 2019. peak memory and peak data will arrive in 2021, or optimistically as late as 2024.  If true there’ll be problems storing data and at some point society will lose the ability to hold onto archived files,  starting with individuals but that will affect governments and companies.  And much more…

Alice Friedemann   www.energyskeptic.com  author of “When Trucks Stop Running: Energy and the Future of Transportation”, 2015, Springer, Barriers to Making Algal Biofuels, and “Crunch! Whole Grain Artisan Chips and Crackers”. Podcasts: Collapse Chronicles, Derrick Jensen, Practical Prepping, KunstlerCast 253, KunstlerCast278, Peak Prosperity , XX2 report

***

The crowning achievement of our civilization is the ability to make microchips.  It is by far the most complex object ever made by mankind.  Probably second in complexity to the microchip is the $10 billion dollar clean room they’re made within.  And third, the motherboard inside computers.  Everything else pales in comparison.  Nearly any electronic device you can think of depends on a microchip to function. Even toasters.  Somewhere along the line, even complex objects that don’t have one, like batteries, were made with equipment that used chips.

Enormously expensive

Moore’s Law says that over the history of computing hardware, the number of transistors in a dense integrated circuit doubles approximately every two years.  Some say that Moore’s 2nd Law is the escalating cost of a semiconductor fab plant, which doubles every 3 years. For example,  Intel’s Fab 32 cost an estimated $3 billion in 2007, revised to $3.5 billion in 2011. A 2009-2010 upgrade to an Intel fab, Fab 11X, cost $2.5 billion (on top of a 2007 $2 billion upgrade). The first stage of GlobalFoundriesNew York 1.3 million square foot fab will cost >$4.6 billion dollarsTSMC’s Fab 15 in Taiwan is estimated at >$9.3 billion, and they are preparing to start a fab in 2015 projected at >$26 billion

Only 5 companies can afford to make the best microprocessors: a supply chain threat

The costs and risks involved in building new fabs have already driven many makers of logic chips (processor or controller chips) towards a “fabless” chip model, where they outsource much of their production to chip “foundries” in the Far East (Nuttall).

High capital costs require fabs to keep their production lines running at full capacity to pay back the money sunk into them. “The most expensive thing on the planet is a half-empty fab,” says Brian Krzanich, general manager of Intel’s manufacturing and supply chain. Consequently, only the highest-volume processor manufacturers–such as Samsung and Intel are still sole owners and operators of state-of-the-art plants. As the elements on a chip become smaller, designing processors is getting tougher costing a lot more — R&D costs are rapidly increasing. In 2009, around $30 billion, or 17 percent of revenue, went to R&D across the industry–a 40 percent increase over 1999 (Mims).

Back when 130 nm chips were made, there were 20 companies, but now there are only 5 companies making the cutting edge 20/22 nm.  Below you can see the declining number of companies as the size got smaller and cost significantly more to make (Benini):

  • 20/22 nm: Globalfoundries, Intel, Samsung, ST Microelectronics, TSMC
  • 28/32 nm: 20/22 and Panasonic, UMC
  • 40/45 nm: 20/22, 28/32, and Fujitsu, IBM, Renesas (NEC), SMIC, Toshiba
  • 55/65 nm: 20/22, 28/32, 40/45 and Freescale, Infineon, Sony, Texas Instruments
  • 90 nm: 20/22, 28/32, 40/45, 55/65 and Dongbu Hitek, Grace Semiconductor, Seiko Epson
  • 130 nm: 20/22, 28/32, 40/45, 55/65, 90 nm and Altis Semiconductor

Only 3 companies still make internal hard disk drives

Seagate Technology, Toshiba, and Western Digital.  Once there were 200 companies.

One company, ASML, makes most of the lithography equipment for the semiconductor industry 

ASML is a lithography equipment manufacturer for the semiconductor industry, without which chip manufacturers cannot make computer chips for the computer and telecom industries.  ASML is nearly a monopoly company in the semiconductor lithography market with 74% of the market share. Traditional lithography has reached the limits and smaller chips can only be made using extreme ultraviolet lithography [EUV]. ASML enjoys a monopolistic position in EUV as it is the only company that is developing EUV equipment to produce these smaller computer chips. The capital required is so huge that ASML’s main customers such as Intel (INTC) are participating in a customer co-investment program (SeekingAlpha).

Benini says that Moore’s Law is about to hit a brick wall because of:

  1. Market volume wall: only the largest volume products will be manufactured with the most advanced technology (above)
  2. Thermal wall: transistor count still increases exponentially but we can no longer power the entire chip (voltages, cooling do not scale)
  3. Memory wall: larger data sets and limited bandwidth at high power cost for accessing external memory

Financial fragility

In a (civil) war, fabrication plants are a likely target.  Given how expensive they are, could a company survive the destruction of one or two of their plants given that their revenues now are often less than the cost of building a new fab plant (i.e. TSMC $14 billion, Globalfoundry $3.5 billion)?

Overview of how Chips are made

The main steps are oxidation layering, photoresist coating, patterning, etching, layering, doping (diffusion and ion implantation), depositing interconnection metals, testing, and packaging.  Each step can have dozens to hundreds of steps, with every process requiring astonishingly pure air, water, and chemicals.  Even the tiniest particle can contaminate the wafer and the microchip will have to be thrown out.

The fabrication building semiconductors are made in is also amazing. It’s made of materials that shed as few particles as possible, and the flooring and machinery must be built to prevent even the slightest vibrations from a truck going by or the chips will be damaged. Temperatures and humidity must stay within very narrow limits.

There are hundreds of thousands of kinds of equipment, chemicals, metals, minerals, and complex heating, cooling, building systems.  All of them are potential victims of supply chain failures.

As the world becomes less complex on the down-slope of the fossil fuel energy curve, it will get harder to keep the air, water, chemicals, and silicone as pure as they are now.  The more impurities or particles there are, the more chips will fail at the end-of-the-line. I personally experienced these frustrations when I worked at a neuroanatomy lab in Puerto Rico that moved from Urbana, Illinois. Suddenly we couldn’t get histology to work. The water and air weren’t pure enough, and this was worsened by not being able to come and go all hours of the day and night since the area was so unsafe.

At this point there are enough facilities and suppliers in about 9 countries that can back each other up after earthquakes (Taiwan & Japan), tsunamis (Japan), floods (Thailand), and other natural disasters, lessening supply chain worries.

But this is changing. According to Quartz, only four companies, Intel, Samsung, Taiwan Semiconductor Manufacturing (TSMC), and GlobalFoundries, are able to make advanced microchips.   In the relentless pursuit of Moore’s law, only a few companies remain with the money and knowledge to stay up-to-date.  Smaller suppliers of the big 4 that couldn’t afford to do the research to reach the next level of complexity in EUV lithography, 3D-IC chip packages and 450mm wafers are going out of business as well.

The biggest threat to chip production in the future are world-wide financial crashes, electric grid outages, and oil shortages resulting in disruption of supply chains, which will eventually affect facilities in more and more of the countries that are still making chips.

Another world-wide threat to the production of microprocessors is (nuclear) war, and cyber war and cyber attacks. While looking for a list of devices with chips, I came across an article about how Russians detected spy chips hidden inside electric irons and electric kettles that could put malware and viruses on computers within 600 feet.

Everything depends on semiconductors.  Financial and business transactions, logistics, shopping, corporations and small businesses, shipping, trucks, trains, autos, and so on. No microchips, no Civilization As We Know It.

As you can tell from my booklist, for me the greatest tragedy will be the loss of most of the knowledge gained during this short Age of Enlightenment, and then it’s back to superstition and fear of the Unknown.  More and more of what we know is only being stored electronically.  Librarians have written me to say their university or library is trying to put everything online.  Whatever is electronic will all be lost when we’re no longer able to make semiconductors.  We’ll also lose what’s on paper or microfilm since those don’t last more than a few centuries. I discuss this at greater length in Peak Resources and the Preservation of Knowledge.  Carl Sagan best expresses the sadness I feel in “The Demon-Haunted World: Science as a Candle in the Dark” and anthropological works like Chagnon’s “Noble Savages”.

The physics and calculus

You really need to see the diagrams, calculus, problems, and discussions of the physics involved to truly appreciate the complexity.  The list of processes below doesn’t begin to capture how amazing, brilliant, and unappreciated this enterprise is! Try scrolling a bit through one or more of these textbooks to get an inkling of what I mean:

Handbook of Semiconductor Manufacturing Technology, Second Edition

Advanced Processes for 193-nm Immersion Lithography

Handbook for Cleaning for Semiconductor Manufacturing

Fundamentals of Semiconductor Manufacturing and Process Control

Semiconductor Manufacturing Technology

Videos:  From sand to chip – How a CPU is made

A Detailed Look at the process of making Microchips from an 800 page textbook

Hwaiyu Gent. Semiconductor Manufacturing Handbook. Wafer Processing Technologies. Nanotechnology and MEMs. Fab yield, operations, and facilities. 2005.

Here are just a few devices that depend on microchips: medical equipment of all kinds, manufacturing equipment, Vehicles, Cameras & Video Equipment, Cellular Phones, Copy Machines, Printers, Hearing Aids, Sewing Machines, stereos, radios, televisions, VCRs, air conditioner, thermostat, microwave, washing machine, security system,  routers, ATMs, clock radios, coffee makers, ovens, etc.

Now and then I note the chemicals or minerals used in the process to give you an idea of the complexity.

A Brief description of some of Intel’s Fab facilities (Andrews)

  • 400,000 square feet of cleanrooms a quarter-mile on a side.
  • 40 miles of pipes for ultrapure water
  • 3 miles of internal monorail transportation
  • clean rooms  constructed with custom pre-cleaned construction materials.
  • Cement consumption is so high that Intel builds cement plants on their construction site
  • Chip fab energy consumption is 55-65 megawatts in one case. I
  • The largest land-based crane in the world was used to pick up and place massive roof trusses that weigh approximately 300 tons each.
  • The crane is so large it had to be delivered on trucks to the site in pieces by 250 trucks
  • 24,000 tons of steel rebar
  • 21,000 tons of structural steel. And to make room for the fab,
  • 875,000 cubic yards of dirt had excavated to make room for the fab plant
  • 10.5 million man hours will be required to complete the project.
  • Basic equipment can cost over $40,000,000 for a lithography machine, and over $50,000,000 for steppers
  • Software.  In 1995 a chip that went into a stand-alone product and required 100,000 lines of code, in 2002: a typical chip for a networked programmable product required a million lines of code (Fiddler)

How Silicon Wafers are made

Silicon wafers are the platform for microprocessors used in transistors, power and RF devices, dynamic random access memories (dram), and microprocessors. There are many ways to make them.  The more complex microprocessors require much more processing and materials often layering is done with diamonds, Si-Ge, and other materials, like a complex submarine sandwich that might include gallium arsenide, indium phosphide and antimonide, Si-Ge.

Arc furnace:  reduce quartz in quartzite by carbon into metallurgical grade silicon purified with halogenation and fractional distillation processes. HCl SiHCl SiCl4 H2 AlCl3 BCl3 FeCl3

Reactor: Decompose Trichloro silane into silicon and HCL. molybdenum

Quartz crucible. Within a chamber having a controlled atmosphere to grow the silicon crystals using very careful temperature control

Annealing. Wafers placed in an atmosphere of argon or hydrogen to remove oxygen, etc.

Slice:   multiwire saws slice and then grinders, lapping, and polishing machines produce wafers

Interconnects/wiring systems     

These provide power, grounding for various systems on the chip.  Copper, TaN, TiN, TiSiN, TiW

Make interconnect (with copper): A mold is coated with liner and seed layers, then copper is electrochemically poured in, with excess removed in a polishing step, and finally the surface is capped with a dielectric material to protect the copper often with a plasma-enhanced chemical vapor deposition.

Apply Silicide:  Because as devices shrink to the submicron level, circuit performance has encountered problems that can slow it down, and this is solved by applying silicides, which ideally have low resistivity, easily form thin films, withstand chemicals and high temperatures, adhere well to other layers, is smooth, and much more. titanium, cobalt, nickel, platinum, tungsten, molybdenum, tantalum and other metals.  There are many possible compositions of silicides, each with their strengths and weaknesses. TiSi2  CoSi2  NiSi  Pd2Si PtSi Wsi2 MoSi2

Deposit a film of metal on a silicon substrate and bind by annealing.

  1. sputter clean silicon wafer with Ar ions
  2. the metal is sputter deposited
  3. anneal in a 100% N2 ambient
  4. wet etch
  5. Another annealing cycle from 700 to 850 degrees C (depending on metal).  Now they’re ready for contact dielectric deposition and 1st level metal-interconnect processing

Plasma process control

An intricate and central feature of making semiconductor devices. Plasma chambers etch or deposit thin films of material. Etching needs a high-density plasma that generates ions which remove atoms of material.  Deposition is similar except coating is the objective.

Optical Emmission Spectroscopy(OES): uses an optical sensor(CCD image sensor and optical filter)  to detect the oxide-etch endpoint and measure the spectral emission from the plasma

Dry etch process: 2 types: chemical and physical, which combine to form 4 plasma processes: sputtering or physical, chemical, ion-energy-driven, and ion-enhanced-inhibitor etching. Chemical etch is done in high-pressure conditions.

Vacuum technology: Essential in many processes that need a controlled environment to deposit thin films so that the atmospheric gas molecules don’t interfere.

Vacuum technology Measurement Equipment required:  Force Displacement Gauges (liquid level barometer, U-Tube manometer, McLeod Gauge, Bourdon-tube gauge, diaphragm gauge), Capacitance Manometers, Thermal Transfer Gauges (thermocouple gauge Pirani gauge, convection-enhanced Pirani gauge), Ionization Gauges (hot cathode ionization, cold cathode ionization, Partial Pressure analyzers, Residual gas analyzers.  Platinum

Vacuum creating equipment required: Primary vacuum pumps (oil sealed rotary vane mechanical, dry (diaphragm, scroll, screw, sorption pumps). Secondary vacuum pumps (momentum transfer, Oi0-pVapor diffusion, Turbomolecular, Gas Capture, Cryogenic Vacuum, Sputter Ion)       liquid nitrogen, titanium, helium, neon, argon, krypton, xenon, radon

Vacuum creating components:  Flanges with demountable seals to connect to vacuum vessel, valves to control the flow of gas in and out, feed-throughs allow for mechanical motion, radiation, or fluids in and out of vacuum vessels to manipulate objects inside the vacuum

Vacuum Leak Detectors: Untrasonic leak detection, Helium Mass Spectrometer leak Detector (HMSLD)

Photomasks

The intermediate steps between design and wafer, the stencils used to print images onto the semiconductor material.

Data Prep: Design data is conditioned to generate instructions for the pattern generator to use to print the mask features, then converted to a file format acceptable to the pattern generation tool. Enormous computer resources are needed for this complex step.  As chips shrink, exponentially larger pattern files are required to cope.  The generated files are so large that transferring them from the design center to the photomask vendor taxes networks.

Pattern Generation: The design data are printed on resist-coated photoblank with electron beam (ebeam) systems in a high vacuum that take 10 to 18 hours, or with laser-beamed systems using deep ultraviolet lasers in 5 to 9 hours.  Atlas laser systems split the laser into 32 separate beams that are raster scanned across the mask with a 24-facet rotating cylindrical mirror.

Postexposure Bake: After patterning, this step removes standing waves formed from reflections of the substrate surface since these can degrade the resist image leading to poor uniformity

Develop process: The exposed resist is removed by solvents, and surfactants improve the wetting of the resist, then developers are added with puddle processes left on top for a while and then rinsed off, or sprayed on. tetramethylammonium hydroxide

Etch process:  After the exposed resist is removed, the underlying chrome is etched with wet processes using powerful acids or dry etch methods that use gases such as chlorine in a plasma induced by radio frequency energy

Resist removal and cleaning:            After the pattern is etched into the chrome of the photomask, unexposed resist is removed with strong acids

Inspections: Quality assurance to make sure mask features were printed at the proper size, defect inspections

Final Cleaning and pellicle mounting: Strong acids to clean, then a pellicle (rectangular anodized metal frame with optically transparent film on it)  over the printable field to protect it from contamination at the wafer fabrication plant.

Final shipment:  The photomask is read to be shipped to the wafer lab

Some statistics: File sizes for design data ranged from 1.5 to 76 GM. Data preparation times averaged 6.5 hours of CPU time with a max of 360 hours.

Wafer processing with Microlithography

Fabrication processes of an integrated circuit fall into 3 categories: film deposition, patterning, and semiconductor doping. Conductors and insulators are used to connect and isolate transistors. Doping allows the conductivity of the silicon to vary with voltage. fundamental to all of these processes is lithography which forms 3D relief images on the substrate where the pattern can be transferred to.  The patterns are written with a photoresist lithography and etch transfer step usually up to 30 times to build the millions of transistors and many wires. Each pattern printed is aligned to the previous pattern and slowly the conductors, insulators, and doped regions are built up to form the final device.

Lithography:  “This accounts for about 30% of the cost of manufacturing, and it’s often the technical limitation on reducing the size of the chip even further.   Optical lithography is a photographic process which exposes the photoresist (a light sensitive polymer) and developed to form 3D images on the substrate.

Lithography process: substrate preparation, photoresist spin coat, prebake  exposure, postexposure bake, development, postbake, resist strip

Substrate Preparation improves adhesion of photoresist material to substrate by cleaning, baking at 600 C or using chemicals to get rid of water, and adding an adhesion promotor.

Photoresist Coating. Spin coating: the photoresist is made liquid, poured on, then spun on a turntable at high speed.  This has to be very carefully controlled to get the right thickness and uniformity which varies depending on the substrate material.

Postapply Bake: Dry the photoresist after the spin coat process by removing excess solvent using a hot, high-mass metal plate in a vacuum

Alignment & Exposure: Scanning projection printing uses a slit of light from the mask onto the wafer after it’s been aligned properly (very complicated)

Postexposure bake: To remove standing wave ridges

Development: Once exposed, the photoresist must be developed with tetramethyl ammonium hydroxide poured on a rotating wafer or sprayed on

Ion Implantation        

Dozens of ion implantation steps are usually required that very precisely plant the right amount of dopants (ions) at just the right spot.  p-tpye dopant boron (B+, FB2_,), n-type phosphorus, arsenic, other dpoants are indium, antimony, germanium etc

Beamline architectures: 3 types of tools all have implanter beamlines that start with an ion source and extraction optics that inject an appropriately shaped beam of ions into subsequent elements of the beamline. Implanter beamlines also need a mass analysis devise to provide momentum dispersion and transverse focusing of the ion beams.  There are high-current beamlines, high-energy beamlines, and medium current beamlines.

Multi-wafer & single wafer. High-current and energy architectures use a multi-wafer batch processing chamber where many wafers can be implanted at once using a spinning disk at 1000 rpm of the wafers across a fixed-spot beam.  Single wafer processing just ipmlants a single wafer.

Thermal Annealing: Postimplant thermal annealing repairs the crystalline structure of the wafer from the damage created during implantation and electrical activation of the new dopant ions. This is done usually with isothermal lamp or hot-walled furnaces

Wet Etching: The etch process transfers a pattern from a mask layer to the underlying layer by using a chemical etchant, and the rest is intact because it’s protected by the mask layer below. Wet chemical etching reacts with the substrate to produce soluble products that can be washed off. Dry etching uses plasma gas to etch both chemically and physically.

  • HF-based etching chemistry   Hydrofluoric acid (HF)-based etching are the most commonly used wet etchants.
  • Metal Etching Used on aluminum (al), copper, gold, nickel, platinum, chromium, and titanium.     cyanide solutions, phosphoric acid, ammonia
  • Wet etching for compound semiconductor:   Oxidize substrate surface and remove soluble reaction products.

Wet Etching Equipment: Immersion processors (wet benches).  Wafers are immersed, then rinsed, often with physical agitation from ultrasonic agitation, nitrogen bubbling through the solution, or mechanically.  Rinse tanks : 1) quick-dump with top spray, 2) cascade overflow with hot water, 3) Spin rinse dry.  Drying equipment: 1) hot nitrogen, vacuum, slow pull, or isopropyl alcohol vapor drying

Environmental and health issues:    Some of the most hazardous chemicals are used in the wet etching process, such as hydrogen peroxides. Strong acids and oxidizers are often mixed and heated generating fumes that can spread highly corrosive droplets. Cynaide solutions for gold can turn into the deadly gas HCN.

Plasma Etching. Plasma is the only way to etch micron-sized features and faithfully transfer submicron patterns and has replaced wet etching in making semiconductors.  The 4 basic ways plasma etching is used are: 1) sputtering ions strike the substrate and eject materials at low pressure, 2) chemical etching where neutrals in the plasma react with substrate materials to form volatile products, 3) ion-enhanced etching where ions strike the substrate surface, enhance chemical reactivity, and improve desorption of volatile products, 4) sidewall inhibitor etching

Plasma etching systems: This equipment varies depending on what frequencies, pressures, external power sources, load size, and vicinity of the substrate to the plasma source is desired.

Silicon etching: done with F-, Cl-, and Br-based chemistries using ion-driven anisotropy or inhibitor-assisted anisotropy.

Dielectric materials and metal etching: Other materials besides silicon need to be etched when making IC devices.

MEMS device plasma etching: Microelectromechanical systems device makers don’t use transistors as the basic building blocks like IC devices, nor are the relatively uniform.  MEMS can be tens to hundreds of micrometers deep.

Multiplex etching: Time Division Multiplex etching alternates plasma deposition with etching steps.


Chapter 38 the fabrication plant.

I am going to skip ahead to give you an idea of what the building is like where all these processes are going on.

The temperature must stay between 68.4 and 71.4 degrees Fahrenheit, and the relative humidity between 44.1% and 45.9% or the equipment doesn’t function properly.  It becomes misaligned, impacts repeatability of the developed process, and reduces output. This is a huge building to keep within such a narrow range, and some areas require even narrower ranges of between 69.9 and 70.1, which increases costs up to 50%.

Table 38.5 Generic cleanroom ISO class 3 criteria specifications.

  1. Air change rate. 600 times per hour
  2. Airflow. Unidirectional
  3. Air filtration. Terminal (UPLA) filters 99.99995% efficience at .012 um
  4. Air handlers. Rooftop makeup AHUs, recirculating indoor units
  5. Air pressure. Pressure differential + .005” w.g. versus reference corridor
  6. Temperature. 70 degrees Fahrenheit +/- 2%, no more than 3% variation in 4 hours
  7. Humidity. 45% relative humidity +/ 1/2%, no more than 3% variation in 4 hours
  8. Exhausts. Scrubbed acid, abated solvents, general, and heat exhausts
  9. Vibration and noise. NC-50, < 300 uin/s peak to peak, 0-15 Hz
  10. Magnetic flux. .5 G maximum
  11. Electrostatic charge. 1 mJ x 10-7 m2 maximum
  12. Energy. 1,200,000 BTU per square foot per year (operating 23 hours a day, 365 days)
  13. Form, function. 60,000 ft2 floor. Bay and chase, subbasement, mec. Floor, office
  14. Particulate. Particles per cubic food, .3 u in size <1   .12 u in size < 35
  15. Process piping. DI water-virgin PVDF, ultrapure gases, ultrapure chemicals-seamless 316L electropolished tubing stainless steel

Mechanical only construction:

  • makeup AHUs with ductwork
  • recirculating AHUs
  • cooling: refrigerant coir. Air cooled with piping
  • Heating: steam. Zone reheat-electric
  • Humidification: steam with piping
  • Exhaust systems with ductwork
  • Process piping
  • Fan-filter units with grid
  • Cooling: chillers with cooling towers
  • Heating: hot water. Zone reheat-hot water
  • Humidification: adiabatic

Section titles of the clean room design and construction chapter:

  • Airflow Layouts and Patterns: unidirectional airflow, turbulent airflow, air changes. Recirculating air units. Controls. Electrical. Structural. Air-balancing dampers. Return-air path. Differentuial-pressurization limitations.
  • Ceiling systems, wall systems, floor systems. Structure. Fire sprinkler penetrations. HEPA ceiling coverage. Unidirectional flow ceiling height. Unidirectional flow ceiling grid alignment.
  • Cleanroom Lighting.  Lighting type, levels, yellow lighting
  • Cleanroom walls, windows, doors and flooring. Interior movable walls construction. Rearrangement flexibility. Finish. Doors. Caulking practice. Clean flooring. Antistatic flooring. Floor finish. Floor installation. Vibration-sensitive tool mounting.
  • Exhaust systems, makeup air systems, recirculation air systems
  • Air Pressure differential.
  • Process Contamination Control. Air filtration, prevention, isolation, sweep
  • Vibration and noise control.  Concrete “waffle” slabs under the cleanroom floor
  • Magnetic and electromagnetic flux.
  • Electrostatic charge of air and surfaces.
  • Life Safety.

There are thousands of companies involved in clean room technologies
http://www.cemag.us/companies

Uncle!

At this point I am only 20% of the way through this 800-page book.  I can’t take it anymore!  I’ve checked it out twice and must return it, and if I check it out again, and again, and again to finish this post, I’ll wonder whatever happened to my life, it will almost be over…

So below is an outline of some of the chapters I didn’t cover on manufacturing, and then you’ll just have to get the book to see the other dozens of missing chapters.

Chapter 12. Etching of GaAs and Related Materials

  • Front Etch of GaAs
  • Backside Etch of GaAs
  • Etching of InP Materials
  • Etching of GaN Materials
  • ENDPOINT DETECTION IN PLASMA ETCHING
  • Pressure change, Bias change, Mass spectrometry, laser interferometry and reflectance, optical emission spectroscopy

Chapter 13: Physical Vapor Deposition

  • VACUUM EVAPORATION
  • Evaporator equipment: resistive heater or electron beam
  • LAYERS DEPOSITED USING EVAPORATOIN AND THEIR PROPERTIES
  • Metals, alloys, multilayer, chemical compounds, reactive evaporation
  • SPUTTERING
  • Stage 1: creation of ions through collision of inert gas atoms (Ar) with electrons and acceleration of ions toward a target, Stage 2: removing of target atoms by impact of ions with target, Stage 3: transport of free target atoms to the substrate, Stage 4: Condensation of target atoms on the substrate
  • Mechanism
  • Film Microstructure and Mechanical Properties
  • SPUTTER EQUIPMENT: DC-sputtering, HF/RF sputtering
  • Vacuum system, cooling water, Cathodes and Targets
  • Self-bias Effect
  • Bias Sputtering
  • Reactive Sputtering
  • Magnetron Sputtering
  • LAYERS DEPOSITED USING SPUTTERING
  • Metals: Au, Pt, Pd, Ni, Ti, Al, Cr, Mo
  • Alloys: NiCr, CrSi, TiW
  • Multilayers: Cr-Al, Ti-Au, Ti-Pd-Au, Ti-TiN-Au, Ti-TiWN-Au, NiCr-Ni-Au, SnO2, Cr-Al
  • Chemical compounds: Al2O3, SnO2, SiO2, ZnO, Ga2O3, HfB2, NiO, V2O5, Mo2O3, In2O3, glass (pyrex)
  • Step Coverage

Chapter 14: Chemical Vapor Deposition (CVD)

In this step, reactive gases pass over the silicon wafer and are adsorbed onto the surface where the reaction forms a film. By-products leave as gases and pumped away. Reactions are activated heating or radio frequency energy through plasma.

Components/Equipment:

  • Chamber
  • Pumps
  • Wafer Handling
  • Gas Delivery System
  • Radio Frequency system

PRECOATING AND CLEANING with fluorine containing molecules such as NF3, CF4, and C2F6, which react with the cvd film deposited on the chamber walls and forms volatile compounds that are then pumped away.

TROUBLESHOOTING particle problems: Gas-phase nucleation, Flaking, Abrasion, Condensation.

Deposition rate and Uniformity.

Chapter 15: Epitaxy

  • Epitaxy refers to the growth of a crystal on top of a host crystal in an orderly way.  The three most common modes are 1) layer-by-layer growth 2) Nucleation Growth 3) layer-by-layer followed by nucleation growth
  • Growth techniques and equipment
  • Molecular Beam Epitaxy
  • Silicon Epitaxy for Advanced CMOS technology: overview of Silicon Epitaxy
  • Epitaxy Parametric
  • Thickness. Resistivity. Surface defects. Bulk Metals. Flatness and Nanotopography.

Chapter 16: ECD Fundamentals

  • Basic Process Flow for Copper Damascene Processing,
  • Fundamental ECD technology (how plating works).
  • Basic electrochemistry.

Chapter 17: Chemical Mechanical Polishing.

  • Most common CMP processes: Oxide/Poly Si CMP, Metal CMP,
  • Removal Rate control.
  • Within Wafer Uniformity Control
  • Process consumables
  • Pad conditioning
  • Endpoint systems
  • In Situ metrology
  • Post-CMP Wafer Cleaning
  • Dry in-Wet out CMP tools, Dry in-Dry out tool, CMP wafer cleaners, Internal CMP cleaning systems
  • Common CMP platforms & tools: single head rotational systems, multihead rotational CMP systems, Multiplaten CMP systems, Orbital CMP systems, Linear Drive CMP tools
  • CMP Process Waste Management: oxide CMP process waste, Metal CMP process waste

Chapter 18: Wet Cleaning

  • Contaminants.
  • Theory of Particle Adhesion.
  • Wet Processing techniques: 1) liquid chemical cleaning, 2) scrubbing, 3) Pressurized Jet Cleaning, 4) Sonic Cleaning
  • Wet Cleaning Equipment: immersion, placing the wafers in a tank filled with a chemical, spray, using a nozzle to spray the wafers with a chemical, and dispense, directing a stream of appropriate chemical to the wafer
  • Front End-of-Line processes: Wafer cleans. Post-dry Etch or Ash residue removal. Metal removal. Post-CMP clean. Backside Cleans.
  • Back End-of-Line cleaning. Post-CMP. Post-etch residue removal. Backside and bevel cleans.
  • Wet Cleaning Equipment technology.
  • Batch Tank.  Batch Spray. Single Wafer.

Table 41.1 Chemical substances common in Semiconductor manufacturing

Toxic: Ammonia, arsine, boron trifluoride, carbon tetrafluoride, chlorine, hydrochloric acid, hydrofluoric acid, methyl alcohol, nitric acid, methylene chloride, phosphine, phosphorus pentafluoride, 1,1,1-trichloroethane

Corrosive: Acetic acid, ammonia, chlorine, fluorine, hydrochloric acid, hydrofluoric acid, nitric acid, ozone, sulfur dioxide, sulfuric acid

Irritants: Acetic acid, acetone, ammonia, chlorine, formaldehyde, isoproponal, methyl alcohol, NMP, Ozone,, PGME, PGMEA, Tolulene, Xylene

Odorous: acetic acid, ammonia, butyl acetate, chlorine, formaldehyde, hydrofluoric acid, hydrogen sulfide, isopropanol, NMP, PGME, PGMEA, phosphine, xylene

References

Andrews, Esther. Jan 22, 2012. What’s Behind the Products you Love?  intel.com

Benini, Luca. Resource Allocation & Scheduling in Moore’s Law Twilight Zone. Università di Bologna & STMicroelectronics

Fiddler, Jerry (chairman of Wind River Systems). 2002 “Keynoter says chip value is in its intellectual property,” EE Times

Mims, C. April 20, 2010. The High Cost of Upholding Moore’s Law. Technology Review.

Nuttall, Chris. July 20, 2009. “Moore’s Law reaches its economic limits”, Financial Times.

Reuters (2019) Samsung electronics chip output at South Korea plant partly halted due to short blackout. https://www.reuters.com/article/us-samsung-elec-plant/samsung-electronics-chip-output-at-south-korea-plant-partly-halted-due-to-short-blackout-idUSKBN1Z01K3

SeekingAlpha (2014) ASML And Smaller Computer Chips: Will Moore’s Law Break?

Ting-Fang C, Li L (2021) Taiwan’s chip industry under threat as drought turns critical. TSMC and UMC activate water-supply plans as reservoirs face depletion in 60 days. Nikkei Asia.

Posted in Chemicals, Microchips and computers | Tagged , | 16 Comments