Shale gas is only good for plastics, not transportation fuels

Preface. The oil industry is making more plastic because electric cars have cut gasoline use, but because shale “fracked” gas is so light plastic is about the only use. It is not a transportation fuel that can save us from the coming peak oil energy crisis. 

But the plastics boom may be abruptly stopped in its tracks. The fracking industry may not last as long as many believe (Miller 2019) for geological reasons. Fracking may also fail the pandemic financial crash since most companies are in debt. 

Alice Friedemann www.energyskeptic.com  author of “When Trucks Stop Running: Energy and the Future of Transportation”, 2015, Springer, Barriers to Making Algal Biofuels, and “Crunch! Whole Grain Artisan Chips and Crackers”. Podcasts: Collapse Chronicles, Derrick Jensen, Practical Prepping, KunstlerCast 253, KunstlerCast278, Peak Prosperity , XX2 report

***

Gardiner, B. 2020. A Surge of New Plastic Is About to Hit the Planet as major oil companies ramp up their production. wired.com

Petrochemicals, the category that includes plastic, now account for 14 percent of oil use and are expected to drive half of oil demand growth between now and 2050, the International Energy Agency (IEA) says. The World Economic Forum predicts plastic production will double in the next 20 years.

And because the American fracking boom is unearthing, along with natural gas, large amounts of the plastic feedstock ethane, the United States is a big growth area for plastic production. With natural gas prices low, many fracking operations are losing money, so producers have been eager to find a use for the ethane they get as a byproduct of drilling.

“They’re looking for a way to monetize it,“ Feit said. “You can think of plastic as a kind of subsidy for fracking.”

Shell is building a $6 billion ethane cracking plant—a facility that turns ethane into ethylene, a building block for many kinds of plastic—in Monaca, Pennsylvania, 25 miles northwest of Pittsburgh. It is expected to produce up to 1.6 million tons of plastic annually after it opens in the early 2020s. Pennsylvania granted the Shell plant a tax break valued at $1.6 billion—one of the biggest in state history—and officials in Ohio and West Virginia are wooing firms eager to build more ethane crackers, storage facilities, and pipelines.

Since 2010, companies have invested more than $200 billion in 333 plastic and other chemical projects in the US, including expansions of existing facilities, new plants, and associated infrastructure such as pipelines.

If you aren’t going to use plastics, what are you going to use instead?” Alternatives like steel, glass, and aluminum have negative impacts of their own, including carbon footprints that can be greater than plastic’s. It makes cars lighter and therefore more efficient, insulates homes, reduces waste by extending food’s life, and keeps medical supplies sanitary, among many other uses.

Alter, L. 2019. Oil industry is spending billions on increasing plastics production. Treehugger.com

The increase in the production of petrochemicals, spurred by the abundance of shale gas as feedstock and the demand for ethane – a key component in plastics – has prompted energy companies to continue investing billions of dollars in the petrochemical sector. “The global petrochemical sector continues to expand exponentially as developing nations’ demand for petrochemical/chemical products continues to increase,” says Petroleum Economist.

Consultants note that oil producers are pivoting to plastics, away from gas or diesel, and that demand for petrochemical feedstocks will increase by 50%. Petrochemical manufacturers are building 11 new ethylene plants on the Gulf Coast, with capacity for polyethylene growing by 30 percent. The director of the trade association says, “You are going to see over $200 billion in investment in the Gulf Coast specifically related to petrochemical manufacturing.”

Harbors are being dredged, methanol complexes are being built, giant warehouses for pellet storage are under construction. “The Port of Greater Baton Rouge had its fortunes boosted recently with the announcement that ExxonMobil will spend $469 million to add a polypropylene manufacturing unit to its vast greater Baton Rouge petrochemical complex.”

Another $9.4 billion manufacturing complex on the Mississippi River will produce MDI or methylene diphenyl diisocyanate, which goes into our favorite products: polyurethane, spray-foam insulation, furniture, and textiles.

References

Miller, A. 2019. David Hughes’ Shale Reality check 2019. Postcarbon.org

Posted in Natural Gas | Tagged | 2 Comments

1688 Tons of material to build just 1 windmill


Torchinsky J (2021) Watching A Truck Hauling Wind Turbine Blades Kinda Hurts Your Brain. Jalopnik.com

Preface.  There must be many high wind locations that wind turbine blades can’t be transported to, limiting how many could be built even with a trillion dollar budget. Clearly wind turbines aren’t renewable when you consider the vast amounts of material and energy required that have to be replaced all over again every 20 years (and just 15 if offshore).  As you watch these two videos of wind turbine construction, think about the huge amount of energy and material (videos here and another great wind turbine construction video). 

As you’ll see in post 67 Reasons why wind power can not replace fossil fuels (2024-7-26), a 2 MW wind turbine weighs 1688 tons: 1300 tons concrete, 295 tons steel, 48 tons iron, 24 tons fiberglass, 4 tons copper, .4 tons neodymium, .065 tons dysprosium and more (Guezuraga 2012; USGS 2011).

For comparison, I found two statistics for what an average house weighs: from 72 to 104 tons.  So each 2 MW wind turbine weighs as much as 23 homes.  And that’s renewable?  Their lifespan is only 20 years (Daviddson et al 2014). And Offshore wind turbines last just 15 years.

And 2 MW is puny.  Imagine what these must weigh:

  • The offshore 12 MW Haliade-X offshore wind turbine will stand 260 meters (850 feet) tall with 107-meter-long (350 foot) blades.
  • the onshore Enercon E-126/7.5 MW wind turbine has a hub height of 135m (443 feet), a 127m (417 ft) diameter rotor, and provides a swept area of 12,668m² (3 square acres).

Alice Friedemann  www.energyskeptic.com  Author of Life After Fossil Fuels: A Reality Check on Alternative Energy; When Trucks Stop Running: Energy and the Future of Transportation”, Barriers to Making Algal Biofuels, & “Crunch! Whole Grain Artisan Chips and Crackers”.  Women in ecology  Podcasts: WGBH, Planet: Critical, Crazy Town, Collapse Chronicles, Derrick Jensen, Practical Prepping, Kunstler 253 &278, Peak Prosperity,  Index of best energyskeptic posts

***

MidAmerican Energy Company – From the Ground Up: Building our energy future, one turbine at a time

The pictures from the video capture how low the EROI of wind power must be when you can see the embodied fossil fuels used to build a wind turbine.

MidAmerican Energy announced they were about to build the tallest wind turbine in the US, a 2.3 MW 554 foot tall (with 173 foot blade extended) about the same as the Washington Monument. It will be 337 feet ground to hub, use 395 cubic yards of concrete, 63,400 pounds of reinforcing steel, and generate power when winds are 7 mph or higher, producing the most wind at 29 mph.  Important figures such as cost, capacity, maintenance, and so on not (Remer).

MidAmerican Energy is owned by Warren Buffet, who has this to say about why he builds wind farms: “I will do anything that is basically covered by the law to reduce Berkshire’s tax rate,” Buffet told an audience in Omaha, Nebraska recently. “For example, on wind energy, we get a tax credit if we build a lot of wind farms. That’s the only reason to build them. They don’t make sense without the tax credit.” (Pfotenhauer).

Yet it doesn’t begin to capture all of the energy inputs to wind turbines. Notably, transmission is left out of the picture, and the natural gas plants to balance intermittent energy, the mining of the ores for iron and steel, or crushing of rocks to make cement/concrete, the fossil fuels in the tons of epoxy, and so on to make the 900 short tons of material (it is probably more like 1300 tons given other peer-reviewed publications on materials used in 2 MW turbines, not all of the materials used were included in this short video).

Most wind power will be forever stranded, because it’s too far from cities to run transmission lines to. If you look at the state level wind maps in the Wind Energy Resource Atlas of the United States List of Maps (RREDC) it appears as if cities have been placed as far from commercial wind power as possible. But no diabolical force is to blame. The distance is due to cities arising near good, flat farmland, yet the best wind is on the ridges of highlands. To get around this, wind turbines taller than the St. Louis arch at peak blade tip have been proposed for the Southeast and other areas without commercial wind (February 18, 2015. Mapping the Frontier of New Wind Power Potential. National Renewable Energy Lab.).

You’d need 32,850 wind turbines to replace the Cubic Mile of Oil consumed globally every year, and a grand total of 1,642,000 turbines to replace oil over the next 50 years, which may be conservative given that the wind isn’t blowing all the time so that triple or more would be needed on a national grid with massive energy storage batteries.

A wind turbine lifespan is only 20 years, so rinse and repeat!

Each windmill in this video:

  • Takes 3 weeks to build from excavation to operation
  • requires 40 to 100 geo-piers installed for stability, weight unknown
  • Excavate 10 feet deep 100 feet wide
  • Set 96,000 pounds of reinforcing steel rebar = 48 tons
  • 53 concrete trucks pour foundations. If each truck can haul 8 cubic yards at 2538 lbs/yard * 53 = 1,076,112 pounds = 538 tons. In the second video, wind turbine farm from scratch, 30 to 240 cubic meters of concrete are poured (Delbert 2020). A cubic meter weighs 2,400 kg, so 72,000 kg / 152,738 lbs / 36 short tons to 576,000 kg / 1,269,863 pounds /  634 short tons
  • Move 1,500 cubic yards of soil @ 2,200 lbs per cubic yard = 3.3 million pounds = 1,650 tons
  • 3 blades : each 173 feet long and 27,000 pounds for 81,000 pounds = 40.5 tons
  • 8 truckloads to deliver turbine components
  • Nacelle: weight 181,000 lbs = 90.5 tons with the generator, gearbox, and rotor shaft
  • Hub: weight unknown
  • Base tower height 53 feet 11 inches, weight 97,459 lbs = 48.7 tons
  • Mid tower height 84 feet 6 inches, weight 115,587 lbs = 57.8 tons
  • Top tower height 119 feet, weight 104,167 lbs = 52 tons
  • Final tower height to blade tip when fully extended 442 feet

References

Davidsson, S., Grandell, L., Wachtmeister, H., Höök, M. October 2014. Growth curves and sustained commissioning modelling of renewable energy: Investigating resource constraints for wind energy. Energy Policy, Volume 73, Pages 767–776 http://dx.doi.org/10.1016/j.enpol.2014.05.003
 
 
Guezuraga, B. 2012. Life cycle assessment of two different 2 MW class wind turbines. Renewable Energy 37:37-44.

Pfotenhauer, N. May 12, 2014. Big Wind’s Bogus Subsidies. U.S. News & World Report

Remer, J. November 17, 2015. MidAmerican Energy’s New Iowa Wind Farm to Feature Tallest Onshore Turbine Ever in the US PowerEngineering.

Rosenbloom, E. 2006. A Problem With Wind Power. aweo.org

USGS. 2011. Wind Energy in the United States and Materials Required for the Land-Based Wind Turbine Industry From 2010 Through 2030. U.S. Geological Survey.

12 truck 26 40-100 geopiers installed for stability

33 excavate 10 feet deep50 96000 pounds of reinforcing steel 53 up to 53 concrete trucks to pour foundations 101 1500 cubic yards of soil backfilled and leveled 107 3 blades each 173 feet long 112 and 27000 lbs each 122 8 truckloads to deliver turbine components 135 more turbine components 137 jacking up the turbine 148 nacelle the size of a school bus 159 Hub 216 base tower height 53 feet 11 inches 229 base tower weight 97459 pounds 235 160 bolts around the bottom 246 mid tower height 84.5 feet 251 midtower weight 115,587 pounds 320 three blades 400 top tower height 119 feet 427 nacelle weighs 181000 pounds 453 rotor diameter 354 feet 520 nacelle contains generator gearbox rotor shaft 522 nacell part 2r

Posted in Wind | Tagged , | 6 Comments

Invasive weeds threaten crops

Preface.  Invasive weeds will make growing food harder when fossils are gone, since pesticides, herbicides, insecticides, and fungicides are made with petroleum as a feedstock.

Alice Friedemann   www.energyskeptic.com  author of “Life After Fossil Fuels: A Reality Check on Alternative Energy”, 2021, Springer; “When Trucks Stop Running: Energy and the Future of Transportation”, 2015, Springer, Barriers to Making Algal Biofuels, and “Crunch! Whole Grain Artisan Chips and Crackers”. Podcasts: Collapse Chronicles, Derrick Jensen, Practical Prepping, KunstlerCast 253, KunstlerCast278, Peak Prosperity , XX2 report

***

HU (2021) Invasive weed may help treat some human diseases, researchers find. Hiroshima University.

A. virginicus is harmful, invasive weed that seriously threatens agricultural production and economics worldwide. No solution to tackle this plant has been found. Native to the southeastern United States, a weedy grass has spread northward to Canada and also made its way to Australia and Japan. Andropogon virginicus grows densely packed and up to seven feet tall, disrupting growth patterns of other plants and competing for resources. When burned, it grows back stronger. There is no way to effectively remove the weed once it has invaded.

Katz, B. 2019. Monster Invasive Tumbleweed Is Outgrowing Its Parent Species. Scientists once thought the hybrid Salsola ryanii would not be able to survive the hot, dry conditions of the West. They were wrong. Smithsonian.

Tumbleweed are invasive plants that can wreak havoc upon native ecosystems, agriculture and property. They compete with crops, can disturb oil and gas pads, spread forest fires, and even cause traffic accidents.

A new tumbleweed species, Salsola ryanii, can grow 6 feet high, is resistant to glyphosate, and is a hybrid of two other invasive tumbleweeds, which may help it become even more invasive in the future since it grows more vigorously than either of its parents.  Each tumbleweed produces over 100,000 seeds a year.

More invasive plants:

Doherty T (2020) State forestry commission offering assistance to eradicate invasive weed. wdam.com. As if kudzu wasn’t bad enough, now southeast Mississippi has been invaded by an assassin weed. Imperata cylindrica, more commonly known as cogongrass or Japanese blood grass, chokes out native species for control of soil nutrients. Its roots excrete chemicals that deter growth of competing vegetation. The unwelcome gate-crasher can be spread vegetatively or by the wind. It is not suitable as forage for livestock or for erosion control. “Cogongrass negatively affects pine productivity and survival, wildlife habitat, recreation, native plants, fire behavior and site management costs,” MFC state forester Russell Bozeman said in a release. “Its ability to rapidly spread and displace desirable vegetation makes it particularly dangerous to native ecosystems.”

Apr 23, 2002 Caspian Environment Struggles As Nations Jockey Over Energy Riches.  ABC news.

Scott Dogget. Dec 28, 2004 In a chokehold: California’s native landscape is losing ground as aggressive imports run wild.   Los Angeles Times.

Aug 26, 2005  Non-native Seaweed Threatens Hawaiian Species. National Academy of Sciences.

Carrie Madren. July 15, 2011. A Wild, Weedy Scourge: Fast Spreading Cogongrass Threatens Forests in the U.S. South.  The federal government is spending millions to combat a nasty plant that is spreading like wildfire.  Scientific American.

Aquatic and Invasive plants website, University of Florida

Posted in 2) Overshoot, BioInvasion | Tagged , , | 2 Comments

Peak Phosphorus

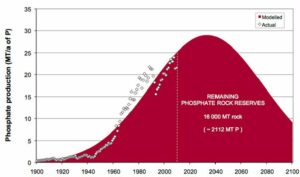
Sources: Peak phosphorus curve indicating a peak in production by 2033, derived from US Geological Survey and industry data. Cordell, D.; Drangert, J.-O.; White, S. The story of phosphorus: Global food security and food for thought. Glob. Environ. Change 2009, 19, 292-305

Preface: Phosphate is essential for plants and animals, in us it the backbone of DNA and RNA, holding in meaningful order the letters of genetic information that would otherwise collapse into alphabet soup. Next to calcium, phosphorus is the most abundant mineral in the body to build strong bones and teeth.

The phosphorus-oxygen bond is central to why biology works. The body stores and burns energy by perpetually making and breaking the phosphate bonds found in the cell’s little cash machines, its adenosine triphosphate (ATP) molecules. This phosphate recycling operation is so relentless, you turn over your body weight in ATP every day.

Phosphorus is also essential for growing crops.  You can have all the sun, water, nitrogen, and so on that a plant needs, without without phosphorus, a plant (or animal) can’t use them.  Therefore, it is no exaggeration to say that phosphorus is the most important limiting nutrient.

Phosphate colludes with lipid molecules to encase every cell in an ever vigilant membrane that dictates what gets in and what must be kept out. Proteins send messages to one another by exchanging phosphate parcels.

Behind phosphate’s spectacular, jack-of-all-trades utility is a negative charge that prevents unwanted leakage. You can put energy in and only take it out when needed, and won’t leach into the environment.

Phosphates are born through the erosion of rocks, the breakdown of living organisms, or waste products like urine or guano.

No other element can substitute for phosphorus, nor can it be synthesized. Very little of it is recycled.

Alice Friedemann  www.energyskeptic.com  Author of Life After Fossil Fuels: A Reality Check on Alternative Energy; When Trucks Stop Running: Energy and the Future of Transportation”, Barriers to Making Algal Biofuels, & “Crunch! Whole Grain Artisan Chips and Crackers”.  Women in ecology  Podcasts: WGBH, Jore, Planet: Critical, Crazy Town, Collapse Chronicles, Derrick Jensen, Practical Prepping, Kunstler 253 &278, Peak Prosperity,  Index of best energyskeptic posts

***

2022-9-15 Approaching peak phosphorus. Nature Plants 8: 979
https://www.nature.com/articles/s41477-022-01247-2

Geophysicist Marion King Hubbert formulated the concept of peak oil in 1956, reminding us that the planet’s resources are not infinite. Decades later, and attracting much less attention, a similar idea was established for phosphorus, and it was predicted that its peak could be reached globally as soon as 2033 (Cordell et al 2009).

Regardless of when peak production may occur, other factors may limit productiondue to supply chain shortages, wars, politics, and economics (i.e. depression). For example, Morocco, with 70% of reserves, is only the second largest producer due to the high cost of mining and tensions in the Western Sahara.

Less than 20% of the phosphorus applied in agriculture contributes to the food that we consume (Dawson et al 2011), with 80% running off from cultivated land, entering aqueous ecosystems and contributing to eutrophication.

Some of it ends up in our sewage system. Germany is one of the few nations trying to recover phosphorus from human urine, but only a small fraction can be recovered at a reasonable cost.

Researchers are trying to genetically engineer plants that use phosphorus more efficiently. But that takes time, more needs to be learned about which genes to alter. And even when advances are made, it takes time to transfer this knowledge to farmers and governments.

Carrington, D. 2019. Phosphate fertiliser ‘crisis’ threatens world food supply Use of essential rock phosphate has soared, but scientists fear it could run out within a few decades. The guardian.

Phosphorus is essential to agriculture, increasing yields up to 50%, with 80% of phosphorus used in fertilizers to grow crops, and much of the rest in animal feed.  At current rates of use, a lot of countries are set to run out of their domestic supply in the next generation, including the US, China and India. Morocco and the Moroccan-occupied territory of Western Sahara host by far the largest reserve, with China, Algeria and Syria the next biggest, together representing more than 80% of global rock phosphate.

Phosphate use has quadrupled in the last 50 years as the global population has grown and the date when it is estimated to run out gets closer with each new analysis of demand, with some scientists projecting that moment could come as soon as a few decades’ time.

A new study, published in the journal Frontiers of Agricultural Science and Engineering, states: “The continued supply of phosphate fertilisers that underpin global food production is an imminent crisis.”  It notes that an estimate of the remaining years of rock phosphate supply fell from 300 to 259 in just the last three years, as demand rose. “If the estimated remaining number of years supply continues to decline at this rate, it could be argued that all supplies will be exhausted by 2040,” the scientists wrote.

***

How much phosphorus is left and what other risks are there?

Recent estimates of peak phosphorus are 2027 (Mohr) and 2033 (Craswell), but you can find dozens of estimates, The most optimistic estimates lead to phosphorus running out within 200 years (Cordell).

Morocco has 85% of the remaining reserves (mainly in the Western Sahara). Morocco is potentially unstable, as are these five nations with another five percent of reserves: China, Algeria, Syria, Jordan, and South Africa.

Also vulnerable are the nations that need to import nearly all of their phosphorus, such as Europe, Brazil, and India. The United States has about 25 years of phosphate reserves left.

Dary, Patrick, Phosphorus: is a paradigm shift required (Bardi 2014).

We can’t live without phosphorus: agriculture depends on it to enrich their soils. Phosphorus is second only to nitrogen as the most limiting element for plant growth.  Crop yields on 40% of the world’s arable land is limited by phosphorus availability (30). Nitrogen can be extracted from the air, but phosphorus can’t, it only exists in Earth’s crust, mainly phosphate rock converted to a soluble form for fertilizer, after which much of it is lost, 20% absorbed by plants the first years, some of it disappears in runoff, or locked in the soil in chemical forms plants can’t access.  Much of it is exported within food crops.

Production in the U.S. has been declining 4 to 5% a year since about 1980.

And like all minerals, if phosphorus ever gets very expensive, rising prices will cause a reduction in demand, and that eventually stops rising production.  Industry won’t extract resources so expensive they’re impossible to sell.  Consequently, there’s a limit to the low-grade resources the industry can exploit. Economists assume that technology will always come to the rescue, lower costs of extraction and restoring both demand and industry profits. But this is a leap of faith: technology has monetary and energy costs so there are limits to what it can do. So the phosphate rock production won’t end due to a lack of rock.  But since it depends on the energy derived from oil to extract, transform, and transport, when oil declines, it will too.

References

Bardi, Ugo. 2014. Extracted: How the Quest for Mineral Wealth Is Plundering the Planet. Chelsea Green Publishing.

Cho, Renee. 2013. Phosphorus: Essential to Life—Are We Running Out?

Cordell D et al (2009) The story of phosphorus: Global food security and food for thought. Global Environmental Change 19: 292-305.

Cordell, D. et al. 2013. Phosphorus vulnerability: A qualitative framework for assessing the vulnerability of national and regional food systems to the multi-dimensional stressors of phosphorus scarcity. Global Environmental Change,  DOI: 10.1016/j.gloenvcha.2013.11.005

Craswell, E.T. et al. 2010. Peak phosphorus—Implications for soil productivity and global food security. Paper read at the 19th World Congress of Soil Science, Soil Solutions for a Changing World, August 1-6, Brisbane, Australia.

Dawson CJ, Hilton J (2011) Fertiliser availability in a resource-limited world: Production and recycling of nitrogen and phosphorus. Food Policy.

Deffeyes, K.S. 2005. Beyond Oil, the view from Hubbert’s Peak. Hill & Wang.

Huva, A. 2013.  Much Ado about Phosphorus. ReadTheScience.com

Blodget, H. 4 Dec 2012. Henry Blodget. A Genius Investor Thinks Billions Of People Are Going To Starve To Death — Here’s Why. Business Insider.

Elser, J. 20 2010.  Peak Phosphorus. It’s an essential, if underappreciated component of our daily lives, and a key link in the global food chain. And it’s running out. Foreign Policy.

Faludi, J. 25 Dec 2007.  Your Stuff: If It Isn’t Grown, It Must Be Mined. WorldChanging

Mohr, S, et al. 2013. Projections of Future Phosphorus Production. Philica.

Vaccari, D. A. June 2009. Phosphorus: A Looming Crisis. This underappreciated resource–a key part of fertilizers–is still decades from running out. But we must act now to conserve it, or future agriculture will collapse. Scientific American.

Walan, P. et al. 2014. Phosphate rock production and depletion: Regional disaggregated modeling and global implications. Resources, Conservation and Recycling, 93: 178-187.

Watson, A. J. December 23, 2016. Oceans on the edge of anoxia. Environmental crises can tip the ocean into O2 depletion. Science.

Woods, H. 3 Apr 2008. World’s phosphorus situation scares some scientists. The Coloradan.

Posted in Peak Phosphorus | Tagged , | 1 Comment

The rich live longer than the poor. At least 14% of wealth is hidden in tax havens

Preface. No surprises here. With peak oil close at hand, I can’t see universal healthcare and other safety nets enacted, just more and more taken away.  It is so shameful the U.S. doesn’t take care of its people, it is the richest nation that ever existed on earth or ever will.  Check out all the countries that do provide health care to their citizens at wiki here,  including many  poor nations you wouldn’t expect such as Algeria, Botswana, Burkina Faso, Egypt, Ghana, Rwanda, South Africa, Tunisia, Argentina, Brazil, and too many more to list.

Plus with evangelicals voting corrupt Republican autocrats into office, definitely not.  They’re half of those who vote for him, and 82% would vote for him in 2020 and 99% of them are against impeachment.  Here’s why: “58 percent of white evangelicals believe that Jesus definitely or probably will return to Earth by 2050.”  This is why they don’t care if Trump is evil, destroys the environment, denies health care, and helps the rich get richer.  It doesn’t matter if the end times are near (Morris 2019, Krasny 2019).

So eat, drink, and be merry as the apocalypse or more likely Peak Everything approaches!

Alice Friedemann www.energyskeptic.com  author of “When Trucks Stop Running: Energy and the Future of Transportation”, 2015, Springer, Barriers to Making Algal Biofuels, and “Crunch! Whole Grain Artisan Chips and Crackers”. Podcasts: Derrick Jensen, Practical Prepping, KunstlerCast 253, KunstlerCast278, Peak Prosperity , XX2 report

***

Fadulu, L. 2019. Study Shows Income Gap Between Rich and Poor Keeps Growing, With Deadly Effects. New York Times.

Greater levels of income and wealth leads to greater longevity. The expanding gap between rich and poor is not only widening the gulf in incomes and wealth in America. It is helping the rich lead longer lives, while cutting short the lives of those who are struggling, according to a study released this week by the Government Accountability Office.  About 75% of rich Americans who were in their 50s and 60s in 1992 were still alive in 2014, but just 50% of poor Americans made it to 2014.

It’s not only that rich people are living longer but some people’s life expectancy is actually shrinking compared to their parents, for some groups of people.

Powers, L. April 6, 2016. Panama Papers only a glimpse into ‘astonishing’ wealth stashed offshore. CBC News, Canada

Some estimates suggest from 8 to 14% of global wealth is kept in tax havens

The provocative revelations coming out of the so-called Panama Papers are just a glimpse into the murky global network that’s keeping “absolutely astonishing” amounts of money out of public coffers.

The 11.5 million files taken from Panama-based law firm Mossack Fonseca show how the financial elite exploit a secretive system to manoeuvre wealth anonymously and ensure the taxman doesn’t take his cut.

The firm is “the world’s fourth biggest provider of offshore services,” according to the Guardian, with about $42 million in yearly revenue. The documents contain information about more than 214,000 shell companies, trusts and foundations — usually used to hold or transfer financial assets while obfuscating the identity of their real owner — that were registered with the firm.

“That gives a sense of the tremendous scope of this in terms of the flows of money into these largely mysterious companies, and this is only one firm,” says Nicholas Shaxson, an investigative journalist and author of Treasure Islands: Tax Havens and the Men who Stole the World.

It’s difficult to delineate what constitutes a tax haven but it’s generally agreed that, depending on the criteria, there are between 70 and 92 of them worldwide. And there’s an estimated two million shell companies registered with offshore firms in these states.

“For a long time, people thought of tax havens as an exotic sideshow of the world economy. Now it’s clear they are absolutely central to it. We’re talking about absolutely astonishing, mind-boggling amounts of money,” Shaxson says.

Estimates of how much wealth is currently stashed offshore vary considerably, a reflection of the opacity of an industry that some economists contend has grown exponentially in recent decades.

Gabriel Zucman, author of The Hidden Wealth of Nations and a professor at the University of California at Berkeley, puts the figure at least $7.6 trillion.

But the Tax Justice Network, an international research and advocacy organization, says the number is far greater. The group estimates that as of 2010, there was between $21 and $32 trillion kept in offshore holdings. That would represent between eight and 13 per cent of total global wealth.

Resource drain

Perhaps most troubling, according to one economist, is that somewhere in the ballpark of $1 trillion is illegally funneled out of developing nations each year into mysterious shell companies.

It’s a system that bolsters kleptocracy and corruption, says Matt Salomon, chief economist with Global Financial Integrity.

“It’s a real resource drain in countries where the money is needed most. At the same time, wealthier nations are standing by as this is happening, insisting that they support development in these places,” he says.

“It’s possible that the $1-trillion figure only represents a drop in the bucket since the data is so murky.”

Many of the dealings facilitated by offshore firms are entirely legal and are encouraged by major financial institutions the world over. Canada’s biggest lender, RBC, was named in the Panama Papers, having used Mossack Fonseca to set up at least 370 shell companies for clients.

There’s a searing public anger over a system that so blatantly favours the wealthy and operates with near impunity, says Shaxson. It’s putting pressure on governments to finally crack down on tax dodgers that cost countries billions each year.

Canada alone loses between $6 and $7.8 billion annually to offshore tax havens, according to a report in the Toronto Star. In response, the federal government dedicated $440 million over four years in the 2016 budget to probe tax evasion and what the Canada Revenue Agency called “aggressive tax avoidance.”

Even before the Panama Papers prompted public outrage though, more than 100 countries since 2014 had committed to increasing transparency around the financial holdings of foreign customers.

The U.S. is among the countries resisting these changes. States like Delaware, Nevada and South Dakota allow for levels of anonymity and secrecy that “rival any of the countries we usually think of as tax havens,” says James Henry, former chief economist at the consulting firm McKinsey.

‘The level of anger is higher than ever’

“It’s insufficient to just say ‘offshore tax havens’ because the industry has expanded so aggressively to countries around the globe,” adds Henry, now a fellow at Columbia and Yale.

Despite big promises from governments, real reform will not come easily. Tax havens and all the perks that come with them “are the projects of some of the world’s wealthiest people,” says Shaxson.

There’s a lot of money to be made by interests with considerable political clout, Henry notes, and the very nature of the business makes it difficult for so-called crackdowns to be effective. Financial institutions rarely face any significant consequences, and past investigations have ended up completely toothless.

“Look, for decades, governments have known about this, law enforcement have known about this and the response has been pretty pathetic. I think the reasons for that are pretty clear at this point,” Henry says.

“But the level of anger is higher than ever, and it will probably only intensify as more stories come out of the leak.”

Related stories:

And there’s no need to go to Panama to hide money as this article points out: Here Is Rothschild’s Primer How To Launder Money In U.S. Real Estate And Avoid “Blacklists” 

References

Krasny, M. 2019. The religious right’s steadfast support of President Trump. KQED.org

Morris, A. 2019. False idol – why the Christian right worships Donald Trump. Rollingstone.

Posted in Distribution of Wealth | Tagged , | Comments Off on The rich live longer than the poor. At least 14% of wealth is hidden in tax havens

Toxic Loans Around the World Weigh on Global Growth

Preface.  Obviously endless growth on a finite planet is impossible.  Clearly the main “benefit” of debt is being able to rape and pillage the planet immediately.  The accumulating debt can never be paid off, because energy is required to grow GDP (they’re locked in a death embrace) and death begins when oil declines, so will GDP, and most debts won’t be repayable.  All of this debt allows us to extract resources NOW at the expense of future generations.

Here’s a recent article about debt, though not as good as it could be, since as usual, it’s energy and resource blind, but it’s probably clear to most people who read it that this can’t end well: December 2019 The Way Out for a World Economy Hooked On Debt? Yet More Debt (Bloomberg).

February 5, 2016 The Chart of Doom: When Private Credit Stops Expanding

Alice Friedemann www.energyskeptic.com  author of “When Trucks Stop Running: Energy and the Future of Transportation”, 2015, Springer, Barriers to Making Algal Biofuels, and “Crunch! Whole Grain Artisan Chips and Crackers”. Podcasts: Derrick Jensen, Practical Prepping, KunstlerCast 253, KunstlerCast278, Peak Prosperity , XX2 report

***


Eavis, P. February 3, 2016. Toxic Loans Around the World Weigh on Global Growth. New York Times.

Beneath the surface of the global financial system lurks a multi-trillion-dollar problem that could sap the strength of large economies for years to come.

The problem is the giant, stagnant pool of loans that companies and people around the world are struggling to pay back. Bad debts have been a drag on economic activity ever since the financial crisis of 2008, but in recent months, the threat posed by an overhang of bad loans appears to be rising.

China is the biggest source of worry. Some analysts estimate that China’s troubled credit could exceed $5 trillion, a staggering number that is equivalent to half the size of the country’s annual economic output.

Official figures show that Chinese banks pulled back on their lending in December. If such trends persist, China’s economy, the second-largest in the world behind the United States’, may then slow even more than it has, further harming the many countries that have for years relied on China for their growth.

But it’s not just China. Wherever governments and central banks unleashed aggressive stimulus policies in recent years, a toxic debt hangover has followed. In the United States, it took many months for mortgage defaults to fall after the most recent housing bust — and energy companies are struggling to pay off the cheap money that they borrowed to pile into the shale boom.

In Europe, analysts say bad loans total more than $1 trillion. Many large European banks are still burdened with defaulted loans, complicating policy makers’ efforts to revive the Continent’s economy. Italy, for instance, announced a plan last week to clean out bad loans from its plodding banking industry.

Elsewhere, bad loans are on the rise at Brazil’s biggest banks, as the country grapples with the effects of an enormous credit binge.

“If you have a boom and then a bust, you create economic losses,” said Alberto Gallo, head of global macro credit research at the Royal Bank of Scotland in London. “You can hope the losses one day turn into profits, but if they don’t, they are a drag on the economy.”

In good times, companies and people take on new loans, often at low interest rates, to buy goods and services. When economies slow, these debts become difficult to pay for many borrowers. And the bigger the boom, the more soured debt that is left behind for bankers and policy makers to deal with.

In theory, it makes sense for banks to swiftly recognize the losses embedded in bad loans — and then make up for those losses by raising fresh capital. The cleaned-up banks are more likely to start lending again — and thus play their part in fueling the recovery.

But in reality, this approach can be difficult to carry out. Recognizing losses on bad loans can mean pushing corporate borrowers into bankruptcy and households into foreclosure. Such disruption can send a chill through the economy, require unpopular taxpayer bailouts and have painful social consequences. And in some cases, the banks might find it extremely difficult to raise fresh capital in the markets.

Even so, the drawback of delaying the cleanup is that the banks remain wounded and reluctant to lend, damping any recovery that takes place. Japan, economists say, waited far too long after its credit boom of the 1980s to force its banks to recognize huge losses — and the economy suffered for years after as a result.

Now many banking experts are beginning to worry about China’s bad loans.

Fears that the country’s economy is slowing have weighed heavily on global markets in recent months because a weak China can drag down growth globally.

Many of these concerns focus on China’s banking industry. In recent years, banks and other financial companies in China issued a tidal wave of new loans and other credit products, many of which will not be paid back in full.

China’s financial sector will have loans and other financial assets of $30 trillion at the end of this year, up from $9 trillion seven years ago, said Charlene Chu, an analyst in Hong Kong for Autonomous Research.

“The world has never seen credit growth of this magnitude over a such short time,” she said in an email. “We believe it has directly or indirectly impacted nearly every asset price in the world, which is why the market is so jittery about the idea that credit problems in China could unravel.

Headline figures for bad loans in China most likely do not capture the size of the problem, analysts say. In her analysis, Ms. Chu estimates that at the end of 2016, as much as 22 percent of the Chinese financial system’s loans and assets will be “nonperforming,” a banking industry term used to describe when a borrower has fallen behind on payments or is stressed in ways that make full repayment unlikely. In dollar terms, that works out to $6.6 trillion of troubled loans and assets.

“This estimate really isn’t that unreasonable,” Ms. Chu said in the email. “We’ve seen similar ratios in other countries. What’s different is the scale, which reflects the massive size of China’s credit boom.” She estimates that the bad loans could lead to $4.4 trillion of actual losses.

Although there is not enough official data to come up with a precise figure for bad loans, other analysts have come up with estimates of around $5 trillion.

Given the murkiness of the Chinese financial industry, other analysts arrive at estimates for a “baseline” figure for bad loans. Christopher Balding, an associate professor at the HSBC School of Business at Peking University, said that an analysis of corporations’ interest payments to Chinese banks suggested that 8 percent of loans to companies might be troubled. But Mr. Balding said it was possible that the bad loan number for China’s overall financial system could be higher.

The looming question for the global economy, however, is how China might deal with a vast pool of bad debts.  After a previous credit boom in the 1990s, the Chinese government provided financial support to help clean up the country’s banks. But the cost of similar interventions today could be dauntingly high given the size of the latest credit boom. And more immediately, rising bad debts could crimp lending to strong companies, undermining economic growth in the process.

“My sense is that the Chinese policy makers seem like a deer in the headlights,” Mr. Balding said. “They really don’t know what to do.

In Europe, for instance, some countries have taken years to come to grips with their banks’ bad loans.

In some cases, the delay arose from a reluctance, at least in part, to force people out of their homes. Even though Ireland’s biggest banks suffered huge losses after the financial crisis, they held back from forcing many borrowers who had defaulted out of their homes. In recent years, the Irish government has pursued a widespread plan that aims to reduce the debt load of financially stressed homeowners. Such forbearance appears not to have weakened the Irish economy, which has recovered at a faster rate than those of other European countries.

Still, the perils of waiting too long are evident in Italy, which in January announced a proposal to help banks sell their bad loans. Some critics of the plan say it resembles a government bailout of the banks, while other skeptics say the banks might not use it because it appears to be too expensive.

“The big problem in the Italian system is that they acted very late,” said Silvia Merler, an affiliate fellow at Bruegel, a European research firm that focuses on economic issues. “They could have done something smarter — and they could have done it earlier.”

Posted in Debt | Tagged , | Comments Off on Toxic Loans Around the World Weigh on Global Growth

Paul Chefurka: More thoughts on Sustainability

The critical feature of sustainability isn’t how many people can be supported by the planet at any given moment in time. Rather, it is the number of humans that could live here without irreparably damaging the biosphere we depend on for survival.

A sustainable species never damages the biosphere irreparably. That’s a pretty tall order.

Humans damage the biosphere in many ways.

One is by shifting resources in space. We usurp the habitat and resources needed by other species, and sequester them for human use. Resources obtained in regions that are unimportant to humans are moved to wherever humans need them, at the expense of indigenous species in the original location.

We also shift resources in time, by stealing resources from the past and the future and using them in the present. An example of this is using fossil fuel energy to pump water out of aquifers for agriculture, thereby using historical fossil fuel resources to diminish future water resources, in favour of growing crops today.

We usurp habitat from other species simply by moving humans to that location, and in the process making it inhospitable to indigenous life (the affected indigenous life doesn’t even need to be non-human…) The sequestering of habitat and resources for human use often go hand in hand.

The unsustainability of our species at any time can be roughly gauged by the degree to which we have concentrated the the spatial and temporal distribution of resources into the here and now, and the extent to which humans have displaced wild life of all sorts.

In contrast, being a fully sustainable presence would require us to do no damage to the planet that could not be repaired by natural biophysical processes in real time.

Given such constrained behaviour, the human species could survive for a very long time indeed (perhaps tens of millions of years) alongside all other sustainable species. Of course, any damage that can’t be repaired invokes the concept of overshoot, which will shorten our species’ period of survivability by some (unknown, perhaps unknowable) amount.

It should be obvious to everyone here that our species’ current way of life is “quite unsustainable” by these criteria.

Is it possible to return our species to sustainability? To answer that question it helps to have a benchmark. When was the last time Homo sapiens might have qualified as a sustainable species using these criteria?

In my opinion, the timestamp has to be placed at least prior to the invention of agriculture, since it was agricultural technology that kicked off the population and cultural growth that got us here.

Before the development of agriculture (as distinct from the horticulture practiced by many hunter forager societies), the global human population is estimated to have been about 6 million people, with an annual growth rate around 0.02%

Such a population of 6 million hunter foragers could perhaps be considered sustainable, except for a couple of caveats.

One caveat is population growth. With a climbing net birth rate it didn’t take long for a population of 6 million to turn into 6 billion. We managed it in just over 12,000 years, at an average growth rate of a measly 0.06%. Our current growth rate is over 1%, 50 times higher than the 0.02% of “Homo sustainabilensis”.

The other caveat is per-capita consumption growth, as well as the growth in technology that is required to sustain both growing population and consumption levels.

Per-capita consumption can be loosely approximated by energy consumption, since all material goods require energy to produce. A hunter-forager consumed about 150 watts in food and fuel. A modern human uses more than twenty times that amount. This energy use amplifies the damage done to the biosphere by the growing number of humans.

So, 6 million humans all living as hunter-foragers might be considered sustainable. But only if they were to maintain a permanently static population capped at 6 million, and a static level of per-capita consumption capped at the equivalent of 150 watts of energy use.

By this estimate, compared to our nominally sustainable forebears we are already in overshoot by a factor of about 25,000. And it’s climbing with every new mouth and every increase in energy consumption.

(Sarcasm generator on)

Humanity could of course move back toward sustainability. Easy-peasy. All we’d have to do is: reduce our population by almost 7.5 billion; stop population growth completely; reduce our energy consumption and the activity that it drives – say by 90%); and eliminate all technological development that results in greater energy consumption (I’m looking at you, William Stanley Jevons.)

(Sarcasm off)

What? We can’t/won’t do that? I know that. This isn’t an exercise in goal-setting. It’s an exercise in measuring the width of the Atlantic Ocean in case we’re ever inclined to try swimming across it.

https://www.facebook.com/notes/bodhi-paul-chefurka/more-thoughts-on-sustainability/10159062669402589/
Posted in Paul Chefurka | Tagged | 4 Comments

Tuna fishery threatened

Preface.  Both the sardine and tuna fisheries are threatened. Only peak oil and decline can possibly save them from extinction.

Alice Friedemann www.energyskeptic.com  author of “When Trucks Stop Running: Energy and the Future of Transportation”, 2015, Springer, Barriers to Making Algal Biofuels, and “Crunch! Whole Grain Artisan Chips and Crackers”. Podcasts: Derrick Jensen, Practical Prepping, KunstlerCast 253, KunstlerCast278, Peak Prosperity , XX2 report

***

Leschin-hoar, C. 2019. We’re pulling tuna out of the ocean at unprecendented — and unsustainable rates. NPR.

A new study, published in Fisheries Research, reveals that the sheer amount of tuna being taken from our seas, including some species considered “vulnerable,” has increased by an astonishing 1,000% in the last 60 years — a rate that some scientists are saying is unsustainable.

Not only are we taking more tuna from the oceans than ever before, but we’re also harvesting them farther from shore. Industrial tuna fishing now covers somewhere between 55% and 90% of the global oceans, fueled in part by extensive government subsidies.

Everywhere tuna swim, they’re being pursued by industrial fisheries.

The report also draws attention to the amount of bycatch taken in the pursuit of tuna. The study estimates that just under 6 million metric tons of shark were discarded as bycatch between 1950 and 2016 in the Pacific Ocean alone. Much of that was made up of blue sharks, which take many years to mature and produce few offspring.

“There’s been an incredible push to end dolphin bycatch in tuna fisheries because they’re cute,” says Coulter. “But sharks are apex predators. They hold all these food chains together. If we’re removing these sharks [from the ecosystem], they really can’t catch up and will decline more and more.”

Milius, S. 27 Feb 2012. Sardine fishery may be in peril. Conditions in northeast Pacific echo those related to collapse last century. Science News.

The Sardine fishery was once the largest of any species in the Western hemisphere.  It’s still very important to whales, seabirds, and predatory fish.  It collapsed in the 1940s from overfishing the bigger and older fish, and an oceanic cycle called the PDO (Pacific Decadal Oscillation), and now it looks like history is about to repeat itself for the same reasons.

Posted in Fisheries | Tagged , , , | Comments Off on Tuna fishery threatened

Hydrogen fuel cell cars are a waste of time and money, and explosive

Preface. Below are several articles about hydrogen.  Today in 2019 it is still far from commercial.  A massive amount of infrastructure needs to be in place before people will consider buying hydrogen fuel cell cars, and because of explosions in South Korea, Norway, and California, building this infrastructure is going slowly.

Hydrogen fuel cells in the news:

2021 Researchers develop tool to aid in development, efficiency of hydrogen-powered cars.  Explains why we are still far from workable hydrogen fuel cells, and “fixing” the problem with nano technology when we are headed for a much simpler world where that will be out of reach is not a direction towards a solution either

Alice Friedemann   www.energyskeptic.com  author of “Life After Fossil Fuels: A Reality Check on Alternative Energy”, 2021, Springer; “When Trucks Stop Running: Energy and the Future of Transportation”, 2015, Springer, Barriers to Making Algal Biofuels, and “Crunch! Whole Grain Artisan Chips and Crackers”. Podcasts: Collapse Chronicles, Derrick Jensen, Practical Prepping, KunstlerCast 253, KunstlerCast278, Peak Prosperity , XX2 report

***

Chatsko M (2017) Will Platinum Doom Hydrogen Cars? fool.com

Several automakers are planning on a hydrogen-car revolution, but the global scarcity of platinum could prove difficult to overcome. Material scientists are worried about the world not having enough platinum since hydrogen fuel cells require significantly more catalytic material than gas or diesel vehicles, because platinum catalysts kick-start the energy-producing hydrogen reaction itself.

Reuters. 2019. Explosions and subsidies: Why hydrogen is struggling to catch on in Korea. Accidents and infrastructure are holding it back. Reuters.

SEOUL — Aiming to cash in on a major push by South Korea to promote fuel cell vehicles, Sung Won-young opened a hydrogen refueling station in the city of Ulsan last September. Just one year on, he’s thinking about closing it down. Sung’s new hydrogen station is one of five in Ulsan.

The government paid the 3 billion won ($2.5 million) cost – six times more than fast charging equipment for battery electric cars – and the two pumps, located next to Sung’s gasoline stand, see a steady flow of Hyundai Nexo SUVs daily.

EvSung hasn’t been able to turn a profit, hamstrung as the equipment can only refuel a limited number of cars each day.  Refueling takes about 5-7 minutes, but the next driver must wait another 20 minutes before sufficient pressure builds in the storage tank to supply the hydrogen or the car’s tank will not be full.

That means only about 100 fuel cell cars can be fueled a day, compared to up to 1,000 at his gasoline stand. Many drivers can also not be bothered to wait 20 minutes and leave without a full tank.

If those impediments to commercial viability were not enough, a fatal hydrogen storage tank explosion this year has spurred protests against the government and Hyundai’s ambitious campaign to promote the zero-emissions fuel. In May, a hydrogen storage tank at a government research project in the rural city of Gangneung exploded. It destroyed a complex about half the size of a soccer field, killing two and injuring six. A preliminary investigation found the blast was caused by a spark after oxygen found its way into the tank.

One month later, there was an explosion at a hydrogen refueling station in Norway. This week, a hydrogen gas leak and subsequent fire at a South Korean chemical plant caused three workers to suffer burns.

Potential station operators have gotten cold feet since the explosions.

Szymkowski. 2019.  Following hydrogen facility explosion, fuel-cell vehicle owners left stranded. The explosion happened in June, but some owners have been forced to park their cars due to lack of fuel. cnet.com

An explosion at a hydrogen fuel production facility shows the industry has a long way to go before fuel cell-powered vehicles can truly be considered a reliable alternative to the internal-combustion engine.

Green Car Reports reported Thursday that hundreds of fuel-cell vehicle owners had no choice but to park their cars due to a hydrogen fuel shortage. The explosion, which happened in Santa Clara, California, this past June, effectively choked the supply of hydrogen to fueling stations in the San Francisco Bay Area. The stations have been dry ever since.

2005. A Committee on the Present Danger Policy Paper:  OIL & SECURITY by George P. Shultz, former secretary of state, and R. James Woolsey, former CIA director

To have an impact on our vulnerabilities within the next decade or two, any competitor of oil-derived fuels will need to be compatible with the existing energy infrastructure and require only modest additions or amendments to it.

Although there are imaginative proposals for transitioning to other fuels, such as hydrogen to power automotive fuel cells, this would require major infrastructure investment and restructuring. If privately-owned fuel cell vehicles were to be capable of being readily refueled, this would require reformers (equipment capable of reforming, say, natural gas into hydrogen) to be located at filling stations, and for natural gas to be available there as a hydrogen feed-stock. So, not only would fuel cell development and technology for storing hydrogen on vehicles need to be further developed, but the automobile industry’s development and production of fuel cells also would need to be coordinated with the energy industry’s deployment of reformers and the fuel for them.

Moving toward automotive fuel cells thus requires us to face a huge question of pace and coordination of large-scale changes by both the automotive and energy industries. This poses a sort of industrial Alphonse and Gaston dilemma: who goes through the door first? (If, instead, it were decided that existing fuels such as gasoline were to be reformed into hydrogen on board vehicles instead of at filling stations, this would require on-board reformers to be developed and added to the fuel cell vehicles themselves — a very substantial undertaking.)

It is because of such complications that the National Commission on Energy Policy concluded in its December, 2004, report “Ending The Energy Stalemate” (“ETES”) that “hydrogen offers little to no potential to improve oil security and reduce climate change risks in the next twenty years.” (p. 72)

Senate 109–385. November 16, 2005. High costs of crude: the new currency of foreign policy.  U.S. Senate Hearing.    39 pages.

[ Much of the above, and in addition: ]

R. James Woolsey:

We should forget about 95 percent of our effort on hydrogen fuel cells for transportation.

Hydrogen fuel cells have real utility in niche markets for stationary uses. But the combination of trying to get the cost of these one-to-two-million-dollar vehicles that run on hydrogen down, at the same time one coordinates a complete restructuring of the energy industry so one has hydrogen at filling stations, and does a complete restructuring of the automotive industry so one has hydrogen fuel cells, is a many decades-long undertaking.

Posted in Hydrogen | Tagged , , , | 3 Comments

Wind, solar, and natural gas are driving nuclear power out of business

Preface. I’m no fan of nuclear power because we may already be at peak uranium, there’s nowhere to store nuclear waste, and a spent nuclear pool fire could harm millions of people.

But renewable wind and solar and natural gas (which is finite) are driving renewable nuclear power plants out of business.

Alice Friedemann www.energyskeptic.com  author of “When Trucks Stop Running: Energy and the Future of Transportation”, 2015, Springer, Barriers to Making Algal Biofuels, and “Crunch! Whole Grain Artisan Chips and Crackers”. Podcasts: Derrick Jensen, Practical Prepping, KunstlerCast 253, KunstlerCast278, Peak Prosperity , XX2 report

***

Dunai, M., et al. 2019. Nuclear energy too slow, too expensive to save climate: report. Reuters.

Nuclear power is losing ground to renewables in terms of both cost and capacity as its reactors are increasingly seen as less economical and slower to reverse carbon emissions, an industry report said.

“Stabilizing the climate is urgent, nuclear power is slow,” said Mycle Schneider, lead author of the report. “It meets no technical or operational need that low-carbon competitors cannot meet better, cheaper and faster.”

The report estimates that since 2009 the average construction time for reactors worldwide was just under 10 years, well above the estimate given by industry body the World Nuclear Association (WNA) of between 5 and 8.5 years.

In May, the International Energy Agency warned reut.rs/2mqcG8j that a steep decline in nuclear capacity will threaten climate goals, as advanced economies could lose 25% of their nuclear capacity by 2025 and as much as two-thirds by 2040 (Clercq 2019 IEA rings alarm bell on phasing out nuclear energy. Reuters).

Eduardo Porter. July 19, 2016. How Renewable Energy Is Blowing Climate Change Efforts Off Course. New York Times.

Germany, Europe’s champion for renewable energy, seems to be having second thoughts about its ambitious push to ramp up its use of renewable fuels for power generation.  Hoping to slow the burst of new renewable energy on its grid, the country eliminated an open-ended subsidy for solar and wind power and put a ceiling on additional renewable capacity.

Germany may also drop a timetable to end coal-fired generation, which still accounts for over 40% of its electricity, according to a report leaked from the country’s environment ministry. Instead, the government will pay billions to keep coal generators in reserve, to provide emergency power at times when the wind doesn’t blow or the sun doesn’t shine.

Renewables have hit a snag beyond Germany, too. Renewable sources are producing temporary power gluts from Australia to California, driving out other energy sources that are still necessary to maintain a stable supply of power.

In Southern Australia, where wind supplies more than a quarter of the region’s power, the spiking prices of electricity when the wind wasn’t blowing full-bore pushed the state government to ask the power company Engie to switch back on a gas-fired plant that had been shut down.

But in what may be the most worrisome development in the combat against climate change, renewables are helping to push nuclear power, the main source of zero-carbon electricity in the United States, into bankruptcy.

The United States, and indeed the world, would do well to reconsider the promise and the limitations of its infatuation with renewable energy.

“The issue is, how do we decarbonize the electricity sector, while keeping the lights on, keeping costs low and avoiding unintended consequences that could make emissions increase?” said Jan Mazurek, who runs the clean power campaign at the environmental advocacy group ClimateWorks.

Addressing those challenges will require a more subtle approach than just attaching more renewables to the grid.

An analysis by Bloomberg New Energy Finance, narrowly distributed two weeks ago, estimated that nuclear reactors that produce 56% of the country’s nuclear power would be unprofitable over the next three years. If those were to go under and be replaced with gas-fired generators, an additional 200 million tons of carbon dioxide would be spewed into the atmosphere every year.

The economics of nuclear energy are mostly to blame. It just cannot compete with cheap natural gas. Most reactors in the country are losing between $5 and $15 per megawatt-hour, according to the analysis.

Nuclear energy’s fate is not being dictated solely by markets, though. Policy makers focused on pushing renewable sources of energy above all else — heavily subsidizing solar and wind projects, and setting legal targets for power generation from renewables — are contributing actively to shut the industry down. Facing intense popular aversion, nuclear energy is being left to wither.

As Will Boisvert wrote in an analysis for Environmental Progress, an environmental organization that advocates nuclear energy, the industry’s woes “could be remedied by subsidies substantially smaller than those routinely given to renewables.” The federal production tax credit for wind farms, for instance, is worth $23 per megawatt-hour, which is more than the amount that nuclear generators would need to break even.

Nuclear generators’ troubles highlight the unintended consequences of brute force policies to push more and more renewable energy onto the grid. These policies do more than endanger the nuclear industry. They could set back the entire effort against climate change.

California, where generators are expected to get half of their electricity from renewables by 2030, offers a pretty good illustration of the problem. It’s called the “duck curve.” It shows what adding renewables to the electric grid does to the demand for other sources of power, and it does look like a duck.

As more and more solar capacity is fed onto the grid, it will displace alternatives. An extra watt from the sun costs nothing. But the sun doesn’t shine equally at all times. Around noon, when it is blazing, there will be little need for energy from nuclear reactors, or even from gas or coal. At 7 p.m., when people get home from work and turn on their appliances, the sun will no longer be so hot. Ramping up alternative sources then will be indispensable.

The problem is that nuclear reactors, and even gas- and coal-fired generators, can’t switch themselves on and off on a dime. So what happens is that around the middle of the day those generators have to pay the grid to take their power. Unsurprisingly, this erodes nukes’ profitability. It might even nudge them out of the system altogether.

How does a renewables strategy play out in the future? Getting more power from renewables at 7 p.m. will mean building excess capacity at noon. Indeed, getting all power from renewables will require building capacity equal to several times the demand during the middle of the day and keeping it turned off much of the time.

Daily fluctuations are not the end of it. Wind power and sunlight change with the seasons, too. What’s more, climate change will probably change their power and seasonality in unforeseen ways. Considering how expensive wind and sun farms can be, it might make sense to reconsider a strategy that dashes a zero-carbon energy source that could stay on all the time.

Posted in Nuclear Power Energy, Solar, Wind | Tagged , , , | 6 Comments