Preface. Saudi Arabia produces 1 in 4 barrels of oil. Their fate will affect all of us as energy declines.
Yet most Saudis are poor despite the $400 billion in income from oil. They lack decent homes, health care, sanitation, and education. Fear, passivity, isolation, and suspicion of others pervades society as everyone focuses on survival, which requires suffocating conformity.
When you walk down the streets, all you see are walls. Men all look alike in their white robes.
Laughter is discouraged. Religion dominates every aspect of life. Women are virtually slaves, controlled by men their whole life.
But this may change. Saudis are young — 70% are under 30, 60% are under 20, and on the internet they can see women have rights elsewhere, and that there are other interpretations of the Koran.
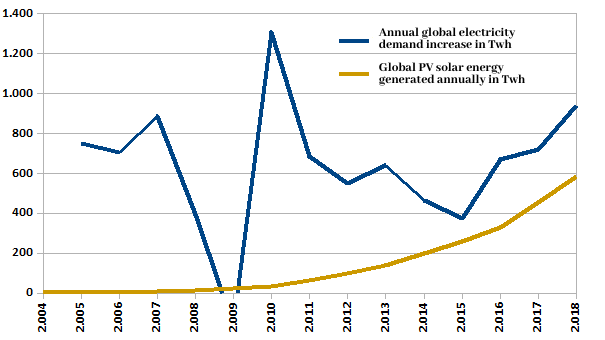
There is a great deal of resentment brewing, the Saudi royalty constantly fears an uprising, but has so far been able to quell one by redistributing a small part of their oil revenues, about $40 to $60 billion a year. But with lower oil prices for several years now, their sovereign wealth fund is dwindling. That’s why they’re offering an IPO (Ellyatt 2019).
What follows are excerpts from the first few chapters.
Alice Friedemann www.energyskeptic.com Author of Life After Fossil Fuels: A Reality Check on Alternative Energy; When Trucks Stop Running: Energy and the Future of Transportation”, Barriers to Making Algal Biofuels, & “Crunch! Whole Grain Artisan Chips and Crackers”. Women in ecology Podcasts: WGBH, Jore, Planet: Critical, Crazy Town, Collapse Chronicles, Derrick Jensen, Practical Prepping, Kunstler 253 &278, Peak Prosperity, Index of best energyskeptic posts
***
Over time I grew less interested in Saudi Arabia as an oil-rich and influential country, and more and more determined to understand the Saudi people and the lives they led—and what that portends for the future stability of a country feared by many for the terrorists it has spawned but so essential to the West for the oil it provides.
As a Western woman I had access to men, even some of the most religiously conservative ones, who met with me so long as I was appropriately shrouded in my floor-length abaya and head scarf. As a woman I also had a degree of access to traditional Saudi women that would have been impossible for any man.
This book focuses on the lives of individual Saudis and how they are shaped and suppressed by traditions and authorities, whether religious figures, tribal elders, or princely rulers. This web of traditions and rules means that women are not free but neither are men. Both sexes are trapped by societal expectations. As a result, individual initiative and enterprise are virtually nonexistent. Society is a maze in which Saudis endlessly maneuver through winding paths between high walls of religious rules, government restrictions, and cultural traditions. Men must obey Allah and women must obey men. As a result, all too few Saudis have the energy, enterprise, curiosity, or confidence even to try to leave this labyrinth. However, in recent years, information via the Internet and youthful demands are penetrating the labyrinth and threatening the very foundations of these walls.
When I first began traveling in the kingdom in the late 1970s, the West could view Saudi Arabia with a mix of curiosity and mild concern, but today its future is critical to the West. The industrial world’s insatiable appetite for energy has made us ever more dependent on the kingdom, which provides 1 of every 4 barrels of oil exported around the globe.
Meanwhile, Saudi Arabia no longer is the tame American ally of a generation ago. The once monogamous Saudi-U.S. marriage has become a polygamous Muslim one as the Saudis build bonds with multiple powers. The royal family may still depend upon the United States for its ultimate survival, but widespread anti-Americanism among conservative Saudis means even princes cannot appear to be in America’s pocket.
For nearly 80 years, a succession of Al Saud princes have traversed the balance beam, skillfully maintaining control of a deeply divided, distrustful, and increasingly dispirited populace, by cunningly exploiting those divisions, dispensing dollops of oil money, and above all, bending religion to serve Al Saud political needs. This ruling family never promised democracy—and still doesn’t. Nor does it bother with sham elections to present the appearance of legitimacy, as do so many other Arab regimes. The Al Saud believe they have an asset more powerful than the ballot box: they have Allah.
Nearly 300 years ago, when Arabia was nothing but harsh desert inhabited by wild and warring tribes, Muhammad al Saud, leader of one such tribe, discovered a magic lamp in the person of Muhammad ibn Abd al Wahhab, a fundamentalist Islamic scholar bent on imposing on Arabia his version of the pure Islam of the Prophet Muhammad a millennium earlier. So fanatical was this preacher that by the time the two men met, Abd al Wahhab was fleeing for his life, having destroyed the tomb of one of the Prophet’s companions and stoned to death a woman accused of adultery in a public display of his Islamic fervor. None of this bothered Muhammad al Saud. He saw in the preacher’s call for Islamic jihad the opportunity to use religion to trump his tribal enemies and conquer Arabia. Sure enough, the Al Saud sword, wielded in the name of religion rather than mere tribal conquest, proved triumphant. The first Saudi state was declared in 1745. Arabia has been under the sway of the Al Saud—and their religious partners—off and on ever since, with the most recent Saudi state established in 1932 by the current king’s father, Abdul Aziz bin Al Saud. Over all those years, religion has been a pillar of strength, steadying the Al Saud atop the kingdom that bears their name. To this day, the monarchy justifies its rule by claiming to personify, protect, and propagate the one true religion. The Saudi monarch styles himself as “Custodian of the Two Holy Mosques,” a unique title intended to convey his spiritual leadership of all Islam. King, after all, is a temporal and rather common title. These days, however, the old magic of divide and conquer, the majesty of appropriated religion, and even the soothing balm of money, lots of money, are not enough to blind a new generation of Saudis to the decay rotting the very foundations of their society and threatening their future and that of their children. Islam as preached is not practiced. Jobs are promised but not delivered. Corruption is rampant, entrapping almost every Saudi in a web of favors and bribes large and small, leaving even the recipients feeling soiled and resentful. Powerful and powerless alike are seeking to grab whatever they can get, turning a society governed by supposedly strict Sharia law into an increasingly lawless one, where law is whatever the king or one of his judges says it is—or people feel they can get away with.
All of this is widely known to Saudis. For the first time, the Internet allows the young generation—70% of Saudis are under 30 years of age, with more than 60% age 20 or younger—to know what is taking place at home and abroad. These young people are aware of government inefficiency and princely corruption, and of the fact that 40 percent of Saudis live in poverty and at least 60 percent cannot afford a home. They know that nearly 40 percent of Saudi youth between twenty and twenty-four are unemployed, at the very age when most men would like to marry if only they could afford the bride price. They know that 90 percent of all employees in the private sector of their economy are imported foreign workers, whom business owners, often including Al Saud princes, exploit for low wages. Saudis, undereducated and often indolent, sit idly by rather than work for what they regard as slave wages doing menial jobs. If all too many Saudi men who could work do not, even educated Saudi women who want to work often cannot. The female half of the Saudi population remains sheltered, subjugated, and frustrated.
In each of the past five years, the government has created only about 50,000 new jobs, and the 2.5 million jobs created by private industry over that period have gone overwhelmingly to foreigners.
All this they know, and now share with each other through social media. These young Internet-savvy Saudis are breaching the walls that have been so carefully constructed and maintained over decades by the regime to keep Saudis separated and distrustful of those outside their family or tribe, to ensure their near total dependence on Al Saud protection and largesse. Stability (more recently coupled with the promise of prosperity) in exchange for loyalty was for most of the last three hundred years the social contract binding the people to their Al Saud rulers. But no longer. These days young Saudis compare their lives with those of contemporaries in neighboring Gulf states and elsewhere, and that comparison leaves many of them humiliated and embittered. All too many of these young Saudis know they are living third-world lives in a country that has more than $400 billion in foreign reserves and, in recent years, annual oil revenue in excess of $200 billion. Yet the government fails to provide basic services like quality education, health care, or even proper sewage and drainage to protect from floods. And things just keep happening to stoke anger and forge bonds among the young. In January 2011, as Cairo was erupting in revolution, the kingdom’s second largest city, Jeddah, flooded for the second time in little more than a year in a deluge of rainwater and sewage. For decades corrupt businessmen and bureaucrats had stolen billions of dollars allocated for construction of a proper sewage and drainage system, leaving the city vulnerable to floods of sewage-polluted rainwater. The first flood, in 2009, killed more than 120 people, displaced another 22,000, and destroyed 8,000 homes. King Abdullah promised “never again,” yet in less than 14 months, once again Jeddah was drowning. Young Saudis using Facebook and Twitter helped stranded citizens find safety and shelter when authorities were scarcely seen.
Even the generally respected monarch, King Abdullah, was the target of unprecedented criticism for such a visible failure to deliver on his previous promise. His photo was posted on the Internet with a giant red X and the words, “Why do you give them all this power when they all are thieves?
If Saudi citizens increasingly are in touch, their rulers are increasingly out of touch. King Abdullah, 89, generally popular for his effort to make at least modest reforms, is seen as isolated by his retainers and, at any rate, was slowed by age and serious back surgery in 2010 and again in 2011. Despite his age and infirmities, the king has largely governed without a crown prince since taking the monarchy’s mantle in 2005 because Sultan, 84, was suffering from cancer and Alzheimer’s and finally died in October 2011. The new crown prince, Nayef, 77 and ailing from diabetes and poor circulation, died after less than eight months, to be followed by yet another brother. After them? No one knows. What scares many royals and most ordinary Saudis is that the succession, which historically has passed from brother to brother, soon will have to jump to a new generation of princes. That could mean that only one branch of this family of some seven thousand princes will have power, a prescription for potential conflict as 34 or 35 surviving lines of the founder’s family could find themselves disenfranchised. Saudis know from history that the second Saudi state was destroyed by fighting among princes. Older Saudis vividly recall how this third and latest Saudi state was shaken by a prolonged power struggle between the founder’s two eldest sons after his death in 1953.
Beyond all this, religion, once a pillar of stability, has become a source of division among Saudis. Many Saudis, both modernists and religious conservatives, are offended by the Al Saud’s exploitation of religion to support purely political prerogatives. The accommodating flexibility of religious scholars is eroding the legitimacy of both the Al Saud and their religious partners in power. Saudis hear religious scholars condemning infidels in the sacred land of the Prophet, yet they recall that the religious hierarchy obediently approved the presence of U.S. troops when the king needed them to confront Saddam Hussein in 1990. The scholars similarly condemn any mixing of men and women and deploy their religious police to enforce this ban on ordinary Saudis, but they acquiesced in 2009, when the king opened a richly endowed university where Saudi men and women mix with each other and with foreign infidels.
For all their frustrations, most Saudis do not crave democracy. To conservative Saudis, especially the many devoutly religious, the idea of men making laws rather than following those laid down by Allah in the Koran is antithetical and unthinkable. More modern and moderate Saudis, aware the Al Saud have banned any political and most all social organizations even down to something as apolitical as photography clubs, fear that without Al Saud rule, the country would face tribal, regional, and class conflict—or rule by religious zealots. With seventy thousand mosques spread across the kingdom, only the religious are an organized force; moderates fear that power inevitably would be seized by the most radical. Whatever lies in Saudi Arabia’s future, it is not democracy. What unites conservatives and modernizers, and young and old, is a hunger not for freedom but for justice; for genuine rule of law, not rule by royal whim. They want a government that is transparent and accountable, one that provides standard services such as are available in far less wealthy societies: good education, jobs, affordable housing, and decent health care. Saudis of all sorts resent having to beg princes for favors to secure services that should be a public right. They also want to be allowed to speak honestly about the political and economic issues that affect their lives.
The country fundamentally is a family corporation. Call it Islam Inc. The board of directors, some twenty senior religious scholars who theoretically set rules for corporate behavior, are handpicked by the Al Saud owners, can be fired at royal whim, and have nothing to say about who runs the company. Al Saud family members hold all the key jobs, not just at the top but right down through middle management, even to regional managers. (The governors of all thirteen Saudi provinces are princes.) At the bottom of the company, ordinary employees are poorly paid and even more poorly trained because management doesn’t want initiative that might threaten its control. Imagine working for a company where you can’t aspire even to a regional management position, let alone influence those who control the company that determines your livelihood and your children’s future.
Sullen, resentful, and unmotivated. Most feel no pride in their country but focus on getting even with their overlords by chiseling on their expense accounts and showing up late for work—in effect, by grabbing what they can get from their corporate masters.
Can the Al Saud regime reform in time to save itself?
In the 80 years since Abdul Aziz bin Al Saud used a combination of religion and ruthlessness to reunite Arabia under the Al Saud, his extended family has evolved as perhaps the most successful family enterprise in modern history—and certainly the wealthiest. Saudi Arabia remains an absolute monarchy, the last significant one on earth. Its power centers all are controlled by princes. The king appoints the country’s senior religious leaders, all judges, and all 150 members of its toothless parliament. His relatives own the news media. No social or civic organizations that might be a breeding ground for citizen organization are allowed. Slavery was abolished only in 1962! Royals also control the kingdom’s oil wealth, which has subsidized—and subdued—Saudi citizens while enriching and entrenching the royal rulers. The wealth of the family, like its internal politics, is veiled from public view, a growing source of public anger.
How has an absolute monarchy and a royal family by now consisting of some 7,000 princes—sons, grandsons, even great-great-grandsons of the founder—continued to maintain near-absolute power amid the winds of change sweeping in from the outside world and the pressures boiling up from a young population? One answer is the skill of the family at adapting the founding father’s strategy of divide and conquer from an age of manipulating desert tribes to a modern era of manipulating social groupings and foreign allies. Second, there is the family’s clever use of money—whether the limited gold coins in the founder’s portable money chest or today’s billions from oil revenue—to buy loyalty, or at least submission. Third, there is the pervasive and so often oppressive role of religion that preaches obedience to Allah, and inextricably to the Al Saud, who, unlike ruling dynasties in Western societies, are not simply a temporal power but also Allah’s instruments on earth. Finally, there is the somnolence of Saudi society itself. Notwithstanding the occasional terrorist who blasts onto the world stage, the society has been overwhelmingly passive, imbued from birth with a sense of obedience to God and ruler and with customs of conformity such that only the rarest of Saudis steps outside the strict social norms to leave his place in the labyrinth that divides Saudis one from another. Saudis vividly demonstrate Karl Marx’s axiom that religion is the “opium” of the people.
Like Washington, Abdul Aziz was a giant of a man, towering above most of his fellow countrymen. Like Washington, he exuded a courage and dignity that set him apart from and above his people. But unlike Washington, who refused to be king and retired to his private estate after two terms as president, leaving no sons, Abdul Aziz ruled the Kingdom of Saudi Arabia until his death in 1953 and fathered 44 sons by 22 wives, 36 of whom lived to adulthood. (He limited himself to no more than the four wives at a time allowed by Islam. But he is estimated to have had brief marriages for political purposes to nearly three hundred women over his lifetime.) His elderly sons continue to rule the kingdom to the present. To this day, the Al Saud princes insist they are the glue that holds Saudi Arabia together. As Cairo was engulfed in one of its many “days of rage,” one middle-aged prince assured me: “Without our family, this country would dissolve into chaos. Our people revere the family as you revere George Washington.
If George Washington is famous for never telling a lie, Abdul Aziz is equally famous for cunning and duplicity, traits still much admired in Saudi Arabia.
Knowing when to yield and when to fight is a survival instinct the founding ruler perfected—and passed to his sons. When his Ikhwan urged him to declare a holy war on the British infidels, who after World War I had replaced the Ottoman Turks as the dominant foreign power in the Middle East, Abdul Aziz demurred because he needed British money and cooperation to drive his rival, Sharif Hussein, the great-great-grandfather of Jordan’s King Abdullah, from Mecca and complete his conquest of Arabia. Once the Ikhwan helped conquer Mecca and the surrounding Hejaz region, Abdul Aziz fought a brutal war with these same religious extremists because they wanted to continue to wage jihad beyond Arabia into Iraq, a British protectorate. He was not about to risk his precariously constructed kingdom to expand into Iraq and turn the powerful British against him. Instead, he turned on the Ikhwan, precisely the people whom he had used to help him secure power, and destroyed them. Abdul Aziz’s devotion to religion took a backseat to his determination to retain his rule of Arabia. (And the same is true today of his sons who, when it suits them, confront religious leaders and even fire some of them, while professing total devotion and obedience to Allah.)
“Draw the sword in their face and they will obey; sheathe the sword and they will ask for more pay,” Abdul Aziz once told a British official, to explain his modus operandi.
To demonstrate his willingness to use power where persuasion failed, Abdul Aziz razed the villages of some of his own cousins who had massed an army to threaten his hold on Riyadh.
Like his father, the current king, Abdullah, has practiced the art of balance. Much as his father subdued the Ikhwan, Abdullah has faced the challenge of subduing its modern variant, the Islamic jihadists. In a striking parallel to the Ikhwan, whom Abdul Aziz used and then destroyed, the modern-day Islamic extremists were indulged in the 1980s by a royal family eager to burnish its religious credentials, as Islamic fundamentalism swept the region in the wake of the religious revolution in Iran. The regime supported the jihadists as they fought the Soviets in Afghanistan and imposed rigid religiosity in the kingdom. The Saudi regime then ruthlessly suppressed religious extremists some thirty years later when they began terrorist attacks inside Saudi Arabia in 2003 and thus were seen to pose a threat to Al Saud rule.
This embrace of extreme religiosity began in 1979 after a Bedouin preacher and several hundred followers did the unthinkable: they used firearms, forbidden in any mosque, to seize control of Islam’s holiest site, the Grand Mosque in Mecca.
Juhayman and his cohorts were determined to end what they saw as the Al Saud’s excessive tolerance of infidel innovations—women newscasters on television, cinemas, and even tolerance of Shias, who in their fanatical minds, are members of a heretical sect of Islam not worthy to be called Muslim.
The siege claimed at least one thousand lives. Juhayman and his compatriots were quickly executed. The traumatized royal family soon curbed the societal liberties Juhayman had condemned. Women announcers were ordered off television, women were forced to wear the veil, and cinemas were closed (except at Saudi ARAMCO). In short, the Al Saud killed Juhayman and his cohorts but adopted their agenda of intolerance, spawning yet more radical Islamists and eventually their deadly attacks on the United States on September 11, 2001, and on Saudis in 2003. This incident marked the beginning of a now widespread sense among Saudis that their government was incompetent. That sense only grew in 1990, when the kingdom’s rulers, despite hundreds of billions of dollars in defense purchases over the decades, nonetheless concluded they needed U.S. troops to protect the country from Saddam Hussein, who had invaded Kuwait and had his eye on Saudi oil fields as well.
In the wake of the attack on New York’s Twin Towers by Saudi nationals, both political reformers and religious fundamentalists began to call for reforms inside the kingdom. Fundamentalists sought reforms that essentially would make religious leaders full partners of the Al Saud. Seeing the regime on the defensive, Saudi intellectuals and other moderates too began to press for political pluralism, including a constitution limiting the government’s powers and even direct elections to the country’s Potemkin parliament, the Majlis Ash Shura, or Consultative Council. Faced with these mounting and seemingly irreconcilable demands, Crown Prince Abdullah, the de facto ruler (as King Fahd lay dying), deftly sought to defuse both threats. The regime imprisoned some of its critics and co-opted others. In 2003 Abdullah launched what he called “National Dialogues” that moved the debate from substantive political reform of the monarchy to superficial reform of the society. The articulate activists from the religious and the reformer ranks soon were subsumed and diluted by a broader and far less threatening group of public representatives selected by the government to participate in the nationally televised “dialogue.” In short, the government picked the topics for discussion, such as the role of women, youth, tolerance, and unemployment, and selected those who would discuss them. These National Dialogues soon sucked the energy out of the incipient reform movement and within a year had become just another somnolent event under royal sponsorship, ignored by most of society and viewed with cynicism by more politically aware Saudis.
For two years after the attack on the World Trade Center, as the United States pressured Riyadh to cut Saudi citizens’ financing of terrorists, the Saudi government largely denied that extremism was a problem. But when frustrated extremists turned to violent attacks on Saudi civilians in 2003, the government met the challenge with massive force, killing hundreds and arresting thousands, many of whom remain incarcerated without trials nearly a decade later. Like Abdul Aziz, his sons strongly prefer to co-opt rather than to confront, to buy rather than to bully, to deflect rather than to directly deny. But in extremis, they are willing to employ pretty much the same harsh practices as neighboring Arab rulers or Abdul Aziz himself. Saudi Arabia is replete with secret police, surreptitious surveillance, grim prisons, and torture chambers, even if this is an aspect of the regime that most Saudis manage to avoid.
Since becoming king in 2005, Abdullah, more than any modern Saudi king, has sought to introduce modest reforms to please modernizers and to blunt the kingdom’s image at home and abroad as a breeding ground for fanaticism.
King Abdullah also began sending a flood of Saudi youth abroad for education—more than 100,000 attend foreign universities now, roughly half in the United States. He established King Abdullah University of Science and Technology (KAUST), the new gender-mixed research university, a first in Saudi Arabia, with an endowment reported to be second only to Harvard’s. When one of the senior religious ulama had the temerity to criticize this unprecedented mixing as an infidel innovation forbidden by Islam, the mild-mannered king promptly fired him, a modern form of his father’s beheadings.
The sacking of this sheikh had the desired effect of prompting supportive statements on KAUST from other tame religious leaders, but it angered religious conservatives who see the approval of gender mixing as yet further prostitution by a religious establishment that puts pleasing the king and retaining its privileges ahead of pleasing Allah. Always careful to balance, the king, who had secured ulama approval for gender mixing at his elite university, did nothing to curb the country’s religious police from roaming the kingdom’s streets and harassing ordinary Saudis mixing with anyone of the opposite gender. As is clear by now, the regime perpetually performs a delicate minuet, dancing closer at times to the religious establishment and at other times to modernizers, but always focused on retaining Al Saud control.
The second source of Al Saud survival is money.
The succeeding Al Saud monarchs have lived more or less luxurious lifestyles, but the family as a whole has become infamous around the world for the profligacy of its numerous playboy princes. While Abdul Aziz would have disapproved of such profligacy, his strategy of using at least some of the kingdom’s wealth to buy the loyalty of its subjects continues to this day. Buying loyalty in Saudi Arabia is not, as in so many countries, a matter of greasing the palms of purchased politicians, since there are no independent Saudi politicians to purchase. Purchasing loyalty is far more pervasive than that. Indeed, Saudi Arabia is a wealthy welfare state, in which the public pays no taxes yet receives widespread, if often poor-quality, services, from free education and health care to water and electricity and, of course, cheap energy. At least 80 percent of the revenues in the Saudi treasury accrue from petroleum. All revenue, whether from oil, earnings on the country’s $400 billion in foreign reserves, or even traffic fines, flows into the central government in Riyadh—that is, to the royal family. No accounting is given to the public of either total revenues to the Al Saud coffers or total spending by the Al Saud—on behalf of the people and on behalf of the ever-expanding royal family. The public has no say in the formation of the annual government budget, which represents that portion of government spending that is disclosed publicly.
Royal benevolence pervades the society in myriad minor ones. A seriously sick Saudi waits outside a princely office for a letter that will admit him to one of the premier military hospitals. A reformed terrorist is the beneficiary of a new Toyota,
The list of petitions and royal favors is as long as the line of supplicants who once gathered outside the desert tent of King Abdul Aziz seeking free meals and clothes.
A third source of Al Saud survival is the pervasive and often oppressive role of religion. Indeed, if finely honed political skills and oil riches are essential components of the Al Saud survival kit, Islam is the monarchy’s survival manual.
The puritanical Wahhabi sect of Islam that he represents instructs Muslims to be obedient and submissive to their rulers, however imperfect, in pursuit of a perfect life in paradise.
Mu’awiyah’s Umayyad dynasty lasted nearly 100 years before being conquered by the Abbasids, who accused his heirs of abandoning the true Islam. The conquerors invited the surviving Umayyad rulers to dinner, and after pleasantries, by prearrangement, the waiters locked the doors and clubbed to death their ruler’s guests. The debauchery and cruelty of these early caliphs is reminiscent of some of Roman Catholicism’s medieval popes. Not surprisingly, this depressing history has bred a political fatalism down through the centuries among many Muslims who believe that if just rule couldn’t be established even when the Prophet’s example was so fresh, there’s no possibility that it could happen now. This resignation to living under corrupt temporal leaders and focusing not on improving life on earth but rather on securing a better life in the hereafter helps explain why oppressive and greedy rulers reign for so long in so many Arab countries.
Like an earthquake-proof building, the Al Saud have long had the wisdom to bend ever so slightly at the moment of greatest pressure and then later reclaim, over time, most of what they yielded.
Saudis’ overwhelming desire to conform, to pass unnoticed among the rest of society, is surely a boon to Al Saud control. If Westerners love individualism, most Saudis are literally frightened at the mere thought of being different. To be different is to attract attention. To attract attention is to invite envy from peers and anger from family.
Imagine a life spent anticipating the unspoken desires of an extended family and acquiescing to the unwritten rules of society. This need for conformity forces Saudis to wear multiple faces and change them multiple times each day. The need to adapt and fit in is stressful, so most Saudis tend to reduce the stress by keeping primarily to those they know, thereby reinforcing their isolation from others who aren’t members of their extended family or tribe. “Americans have one face,” says the Saudi who studied in the United States. “We have multiple faces—two, three, four, five, six faces. Our views depend on which face we are wearing, and which face we are wearing depends on who we are with. Saudis don’t have the same views here that we have in Paris.” Young Saudis, however, are increasingly frustrated with this consuming focus on appearance and pervasive social conformity, and they are much more willing than their parents to try to discover who they are rather than just follow the dictates of parents, teachers, imams, and royal rulers. “Our minds are in a box,” says a middle-aged Saudi businessman. “But the young are being set free by the Internet and knowledge. They will not tolerate what we have. No one knows how the spark will come, but things will change because they have to.”
Paradoxically, it is the Al Saud’s deft duplicity, their paternal dispersal of favors, their arrogant exploitation of religion for their own purposes, and their rendering of Saudis to powerless passivity that now threaten the family’s survival, because more and more Saudis—especially women and youth—now share a growing awareness of the rather non-Islamic tactics so artfully employed to cage them and they are determined to press for change that allows more freedom and more dignity for individual Saudis.
By choice, Lulu rarely leaves home. She has no interest in the world outside her home, where her focus is on serving her husband and ensuring that her children follow a strictly religious path. As the days go by, it becomes clear Lulu not only accepts but welcomes the confines of her life. She has no aspiration beyond living life in a way that pleases Allah and ensures her entry to paradise. An essential element of achieving this goal is serving every need of her husband, a professor of hadith, the thousands of stories about the words and deeds of the Prophet Muhammad, collected and passed down by his contemporaries as a guide for devout Muslims’ daily lives. If her husband should be dissatisfied with her or, even worse, be somehow led astray, the fault would be hers. “Men are in charge of women,” says the Koran. “So righteous women are devoutly obedient, guarding in [the husband’s] absence what Allah would have them guard.” Serving Allah means serving her husband. Lulu’s children, including teenage girls, admire and obey her. I ask Lulu if she wants her daughters to have opportunities she did not have. “No, I pray they have a life like mine,” she says instantly. Her eldest daughter, a student at King Saud University, says, “She is dedicating herself to helping us have a life just like hers.” The daughter, dressed in a modest floor-length skirt and long-sleeved sweater even at home, speaks with deep reverence, not the sarcasm that a Western teenager might use.
Most Westerners, who live in an aggressively secular environment, would find it impossible to imagine the pervasive presence of religion, which hangs over Saudi Arabia like a heavy fog and has been a source of stability, along with the Al Saud, for nearly three centuries. But the growing gap between Islam as revealed in the Koran and Islam as practiced in the kingdom is undermining the credibility of the religious establishment and creating divisions among religious conservatives and between them and modernizers. As a result, the religious pillar is cracking, with serious implications for the kingdom’s future stability. But for devout Muslims like Lulu, these troubling divisions simply mean redoubling their effort to follow the true Islam by adhering strictly to the example set by the Prophet Muhammad fourteen hundred years ago.
Every airport, shopping mall, and government or private office building includes a large area spread with prayer rugs indicating the direction of Mecca, so worshipers know where to kneel and pray. Every hotel room has a sticker on the wall or bed or desk with an arrow pointing toward Mecca.
When her husband is home, I am banished to my room, where I read the Koran to pass the time. A religious man like her bearded husband would never mix unnecessarily with a woman who is not a relative, even if she covers her body and face. Indeed, during the week I spend with Lulu, I see her husband only once—when he picks us up from a rare outing to her sister’s home. Fully veiled, I silently slip into the seat behind him, but we are not introduced and the conversation continues as if I were as invisible as Casper the friendly ghost.
At age 19, when her husband offered himself to her family, Lulu willingly chose to be a second wife. “Some men need another wife for many reasons, perhaps to keep from doing something bad,” she explains, clearly meaning adultery, though she doesn’t speak the word. “I prayed to Allah, ‘Let me do this if it is good.’ ” She is separated from the first wife only by a set of stairs, yet they rarely visit. She is far more concerned about whether God had a son than about which elderly son of Abdul Aziz will next rule Saudi Arabia.
A greater openness in recent years has allowed some Saudis to choose a more liberal lifestyle—where men and women sometimes mix, where women can check into a hotel without a male relative, where there is even talk of women being allowed to drive; but if it were to become the new norm, Lulu would undoubtedly resist adapting with all her might. This is the challenge for the kingdom: how to accommodate those citizens who want more freedom to change and those, like Lulu and her family, who truly see change as a road to hell.
As old divisions among tribes, regions, genders, and classes grow ever more visible, religion’s ability to serve as a unifying force is becoming weaker.
Islam is now becoming another source of division.
First, the Al Saud have politicized Saudi Islam. For two decades they used their religious establishment to support jihadists in Afghanistan and religious extremists at home. Then they abruptly switched course in 2003 to insist that the same religious leaders promote the regime’s campaign for a kinder, gentler interpretation of Islam, to undermine Islamic extremists, whom the Al Saud belatedly recognized as threatening their rule. This shift, which followed the terrorist attacks by Islamic extremists inside the kingdom in 2003, has led many Saudis, moderates as well as conservatives, to view the religious establishment, or Council of Senior Ulama, as apologists for the Al Saud and, worse, as indirect puppets of America.
In recent years the religious partner has come to be seen as so openly compliant with Al Saud political needs rather than Allah’s commands that it has lost much of its credibility—and as a consequence, the Al Saud also are losing theirs.
Secondly, while Islam often is seen as a very literal faith, whose adherents follow the injunctions of the Koran to the letter, in fact, in the Muslim world, many interpretations of Islam exist. For most of Saudi history, religious scholars of the Wahhabi sect provided the only valid interpretations. But that is changing dramatically with the advent of the Internet and education. More Saudis are reading and interpreting the Koran for themselves. Thus, for example, women seeking more social equality are plucking verses from the Koran to justify an expanded role for women, even as fundamentalists cite other verses to justify keeping them sequestered and subordinated. In sum, the Al Saud and their Wahhabi ulama no longer have a lock on interpreting Islam.
Third, while the many muezzins call to the faithful in scripted words in perfect harmony, the religious voices reaching Saudi citizens these days through the Internet and satellite television are anything but harmonious. Saudi Islam has become discordant. On any given day, at any hour, Saudis are logging on to the Internet or tuning in to a satellite television channel, where they hear a wide range of Islamic voices preaching everything from modern and moderate Islam to extreme fundamentalist and even violent Islam.
Fourth, modern society presents a whole range of challenges that the Prophet Muhammad did not have to deal with and could not foresee. A youthful population with Internet access to the rest of the world has raised a profusion of issues that are taxing the theology and ingenuity of Islamic scholars.
Sheikh Mutlag, a member of the senior ulama and an adviser to King Abdullah, surely didn’t expect, when he was pursuing his religious studies, that he would be called upon to issue a fatwa on the appropriateness of carrying into a toilet a cell phone that included downloaded selections from the Koran. He settled the issue by permitting cell phones in a toilet on the clever justification that the Koran is (or should be) completely “downloaded” into every Muslim’s mind at all times.
Muslims believe that each human is flanked by two angels who record good and bad deeds. If a believer even thinks of doing something good, the angel records the thought as a single good deed. If the believer actually does what he or she says, God gives credit for ten good deeds. So perhaps this is why Saudis so often make promises even if they have no intention of keeping them. Partial credit is better than none at all.
The obligatory Muslim prayers, or salat, are not requests for intercession or offers of thanks, as common Christian prayers are. While Muslims also offer this sort of prayer, or du’a, the salat is something very different. It is a precisely regulated, formal ritual that features bodily bending while repeating specific verses from the Koran and that climaxes in prostration to God in the direction of Mecca to demonstrate submission to God’s will. The entire procedure requires nearly ten minutes and can be performed only after the worshiper has properly purified himself—and his heart—for the act of worship. This washing, or ablution, is a critical part of preparing for prayer; it requires the worshiper to wash his hands up to the wrist, rinse the mouth, clean the nose, and scrub the face, forearms up to the elbows, head (by rubbing a wet finger from the forehead to the nape of the neck and back), ears, and finally feet. The Prophet is quoted as saying, “The key to paradise is prayer [salat] and the key to prayer is purification.
It is routine for a Saudi—male or female—to interrupt a conversation to pray. Men go to a nearby mosque, while women cover themselves and pray wherever they are indoors.
Other times, in public places, a man will simply roll out a prayer rug in the lobby of a hotel and fall to his knees as others continue to traipse past, scarcely taking notice of the prostrate worshiper. Occasionally, a host will simply prostrate himself across the room, leaving his guest to watch as he subjugates himself to Allah.
Religion cannot serve to direct society down a common path when the religious guides themselves are divided. So beyond the cacophony of Islamic voices now bombarding Saudis from television and the Internet is the even more serious spectacle of a religious establishment at war within itself. In recent years, the senior religious scholars have publicly criticized first the king and then each other over the issue of the religious rectitude of men and women mixing.
So minute and myriad are the issues where religion impacts daily life that the government has established an official Web site for approved fatwas to guide the faithful. The site ( www.alifta.com ) is intended to discourage young Saudis from following fatwas they find posted on the Internet from some unapproved sheikh at home or abroad who doesn’t represent Islam as propounded by Saudi Arabia’s religious scholars. For instance, one Saudi sheikh issued a fatwa condemning soccer because the Koran, he insisted, forbids Muslims to imitate Christians or Jews. Therefore, using words like foul or penalty kick is forbidden. The country’s grand mufti, Sheikh Abdul Aziz bin Abdullah al Ashaikh, rejected that fatwa and called on the religious police to track down and prosecute its author. Using a few non-Arabic words, said the grand mufti, is not forbidden, as even Allah used some non-Arabic words in the Koran. (Not incidentally perhaps, the grand mufti understood that soccer is a national passion.)
Many Saudis can’t afford, or won’t risk, indulgences like alcohol or prostitution while inside the kingdom but are eager to partake of them during travels abroad. Millions of Saudis cross the King Fahd Causeway that connects the kingdom to Bahrain, a sheikdom where they can enjoy cinema, alcohol, and prostitutes or just the pleasure of dinner in a relaxed environment with friends both male and female.
Saudi Arabia, assaulted by technology and globalization, tipsy from a population explosion that has left more than 60% of its citizens age twenty or younger, and clinging to religion as an anchor in this sea of change, is trying to preserve a way of life exhibited by the Prophet fourteen hundred years ago.
For millennia, Saudis struggled to survive in a vast desert under searing sun and shearing winds that quickly devour a man’s energy, as he searches for a wadi of shade trees and water, which are few and far between, living on only a few dates and camel’s milk. These conditions bred a people suspicious of each other and especially of strangers, a culture largely devoid of art or enjoyment of beauty.
Even today Saudis are a people locked in their own cocoons, focused on their own survival—and that of family—and largely uncaring of others. While survival in the desert also imposed a code of hospitality even toward strangers, life in Saudi cities shuts out strangers and thus eliminates any opportunity and thus obligation for hospitality toward them.
Walk down the dusty and often garbage-strewn streets of any Saudi residential neighborhood, and all you will see are walls. To your right and to your left are walls of steel and walls of concrete. Walls ten or twelve feet high.
The people present a picture of uniformity. From the king to the lowest pauper, men wear identical flowing white robes. Their heads most often are draped in red-and-white cotton scarves, usually held in place by a double black circle of woven woolen cord. Similarly, women—when in public—are invisible beneath flowing black abayas, head scarves, and generally full-face veils, or niqab. The society presents a somber cast as men move about their daily business, because laughter and visible emotion are discouraged by Islam as practiced in Saudi Arabia.
After the shocking terrorist attack on New York’s Twin Towers on September 11, 2001, carried out mostly by Saudi-bred terrorists, the royal family began belatedly to discern that it had made a pact with the devil. So once again the regime swung into action to combat extremism. With one hand, it got tough on homegrown terrorists, arresting jihadists and trying to root radical imams from the kingdom’s seventy thousand mosques. With the other hand, the regime relaxed some of the oppressive social restrictions it had imposed two decades earlier. Press controls were partially eased so that newspapers could criticize extremists, suddenly a popular whipping boy of the regime, and even once again publish photos of women. The regime convened national dialogues and, more important, curbed some of the worst excesses of the religious police—at least temporarily. Previously, any fanatic could proclaim himself a mutawa, or religious policeman, and bully his fellow citizens in the name of religious purity. Now the would-be bullies had to be appointed and trained by higher authorities.
But as soon as uprisings began sweeping the Middle East, the nervous Al Saud once again began to cement the small nicks in the walls of Saudi society that the king had created less than a decade earlier. The religious establishment was given new money and new authority to expand its reach deeper into the kingdom by establishing fatwa offices in every province. More ominously, King Abdullah issued a royal decree making it a crime for print or online media to publish any material that harms “the good reputation and honor” of the kingdom’s grand mufti, members of the Council of Senior Ulama, or government officials. So much for reform.
Most remain deeply averse to conduct that might be seen to violate social norms and invite shame upon themselves and their families. So myriad unspoken rules bind most Saudis in place as tightly as Lilliputians tied down Gulliver. The tight-knit tribal unit tracing its lineage to a single ancestor is the key social grouping in Saudi Arabia and remains a powerful force for conformity. Over millennia, to survive the challenges of the desert and of competing tribes, these groups developed a set of core values such as generosity, hospitality, courage, and honor that bound the entire group and preserved its unity. These values, writes David Pryce-Jones in The Closed Circle: An Interpretation of the Arabs, can be summed up as self-respect, but not in the Western sense of conscience or relationship with God. For Arabs, a man’s self-respect is determined by how others see him. So appearance is everything.
A man who kills his wife or daughter for unfaithfulness simply is preserving the honor of his family and his tribe.
The determination of all Saudis to retain honor and avoid shame cannot be overstated. Understanding this begins to help Westerners like me, accustomed to spontaneity, grasp why Saudis are so passive and conformist.
Something as simple as a wife accompanying her husband on a brief trip abroad is laden with rules and norms that trap her into largely self-induced inaction. If a Saudi woman is traveling, Rana explains, she is expected to visit senior relatives and even close neighbors to bid them good-bye. Upon her return, she is obliged to make another round of visits to the same individuals to pay her respects and dispense small gifts. To simply pack her bag and fly off for a few days with her husband would break society’s conventions and thus disrupt social harmony, exposing her to negative gossip and bringing shame upon her family. So confronted with that heavy load of tradition, the wife simply stayed home. This little convention, multiplied and magnified throughout the Saudi maze, is what consumes so much of the time and saps so much of the initiative of Saudi citizens, confines them to their walled compounds, and restricts them largely to contact among family members.
With urbanization, Saudis know little about the true piety of those they encounter in daily life, so appearances have become even more important. To be accepted as pious, a man simply has to sport a beard and short thobe. Covering herself completely in public similarly conveys a woman’s devotion to Allah. This is precisely why many educated Saudi women say they veil: not to do so risks conveying antisocial behavior and being ostracized as liberal.
Both tradition and religion have made most Saudis accustomed to dependence, to being reactive, not proactive; to accepting, not questioning; to being obedient, not challenging; to being provided for rather than being responsible for their own futures. During the centuries when Arabia was dominated by warring tribes, the tribal head was responsible for the needs of his tribe and expected to receive loyalty and obedience from others if he met those needs.
Saudis, from poor supplicants at royal offices to impressive servants of the regime like Abdul Rahman, are accustomed to receiving their livelihood from the ruler. The unspoken but implicit social contract still is that rulers provide stability and prosperity, and the ruled obey. So far prosperity has been sufficient to secure most people’s acquiescence, even as many grumble these days about too much religion, too much dependence on the United States, too much corruption among the princes, too great a gap between rich and poor, too much unemployment among the young. Perceptive Saudis also mutter about the reemergence of tribal loyalties because the regime, rather than create a spirit of nationalism, has sought to ensure control by keeping citizens divided and distrustful of one another, and by encouraging tribal leaders who still meet weekly with senior princes to compete for Al Saud loyalty and largesse.
Today’s Saudi Arabia thus is less a unified nation-state than a collection of tribes, regions, and Islamic factions that coexist in mutual suspicion and fear. A resident of the Hejaz, the relatively cosmopolitan region encompassing the port of Jeddah and the holy city of Mecca, the kingdom’s two international melting pots, resents the fact that men from the Nejd in central Arabia, and the original home of the Al Saud, occupy all key judicial and financial jobs in the kingdom and are allowed to force their conservative customs and religious views on all Saudis. Shia Muslims from the oil-rich Eastern Province, even more than the Sufi Muslims from Jeddah or the Ismaili Muslims from the impoverished south of Saudi Arabia, resent the total domination of the Wahhabi philosophy over every aspect of life and the pervasive discrimination against them. Tribal loyalties also divide the population, as few individuals ever marry outside their tribe. The preferred marriage partner is one’s first cousin. A Saudi instantly can tell, from an individual’s accent and name, the tribal origins of another Saudi. Social life consists almost entirely of family, and family connections are almost always within one tribe. Thus even the most modern and relatively liberal of Saudis who may mix at work with coworkers of various tribal backgrounds most likely is married to a cousin and socializes almost exclusively with other relatives.
Saudi society has undergone a pell-mell urbanization over the past forty years with the result that fully 80 percent of Saudis now live in one of the country’s three major urban centers—Riyadh, Jeddah, and Dammam.
Some royal palaces stretch literally for blocks behind their high walls that block out the less fortunate parts of Saudi society. In poorer neighborhoods, some Saudis live in tents beside barren patches of dirt, where filthy, barefoot boys play soccer on fields demarcated only by piles of garbage or live in ramshackle tenements often with little furniture and limited electricity.
Trapped between the wealthy and the poor is an increasingly fearful and resentful Saudi middle class, whose standard of living has slipped dramatically over the past half-dozen years. A 2006 Saudi stock market crash, coupled with rising inflation, has left them treading water and slowly sinking as they borrow money to try to maintain a lifestyle they cannot afford.
The intensifying clash over the role of women in Saudi society is about far more than whether women should be allowed to drive or, however well shrouded, mix with men in public places. It is not a war between the sexes, but rather a proxy war between modernizers and conservatives over what sort of Saudi Arabia both sexes will inhabit and over the role and relevance of the omnipresent religious establishment in Saudi society.
As Arab youths challenged authoritarian regimes across the Middle East in the Arab Spring of 2011, in Saudi Arabia, ironically, it was the women, not youth, who had the temerity to confront authority. This challenge amounted to some dozens of women repeatedly gathering outside the Interior Ministry demanding the release of their husbands, brothers, and sons imprisoned for political reasons. Some dozens of other women staged a succession of “drive-ins” to protest the continued ban on women driving. Some were arrested; others were ignored. Still, courageous individual women across the kingdom have continued unannounced to test authority by getting behind the wheel of a car and posting videos of their defiance on YouTube.
It is easy to exaggerate the significance of these small public protests. That said, however, even small acts of public defiance are a remarkable sign of change in a society where all public demonstrations are banned and in which the overwhelming majority of women are totally subjugated by religion, tradition, and family.
If a woman could exercise the freedom to drive, a tether of male control would be severed. Indeed, the whole core premise of Wahhabi Islam—that men obey Allah and women obey men—would be challenged.
Not only are women divided against each other, they also are divided from the rest of society by the religious establishment that enforces separation of the sexes. To be born a woman in Saudi Arabia is at best to endure a lifelong sentence of surveillance by a male relative and to take no action outside the household without male approval and, most often, male accompaniment. A father controls every aspect of a Saudi girl’s life until she is passed to a new dominant male—her husband. At worst, a woman’s life is one of not just subjugation but virtual slavery, in which wives and daughters can be physically, psychologically, and sexually abused at the whim of male family members, who are protected by an all-male criminal system and judiciary in those rare cases when a woman dares go to authorities. So it’s not surprising to learn that the supplication to Allah that a groom offers on his wedding night is the same he is instructed to offer when buying a maidservant—or a camel: “Oh Allah, I ask you for the goodness that you have made her inclined toward and I take refuge with You from the evil within her and the evil that you have made her inclined toward.” Imagine on your wedding day in any other society being equated by your husband to a servant or a beast of burden.
The religious ideal in the kingdom is that the two sexes never meet outside the home after kindergarten.
A woman is not allowed to drive a car, not because Islam forbids something that didn’t exist in the Prophet’s day, but ironically because authorities say she might be prey to misbehavior by Saudi men. Nor can she be alone with a man who isn’t a close relative, even in a public place—indeed, especially in a public place, as this flouts religious tradition against gender mixing. When she shops, she cannot try on clothes in the store, because sales attendants are men. She must first buy the garment and then take it home or to a female-supervised restroom for a fitting. In some conservative homes, she doesn’t even eat with her husband but dines only after his meal is finished. Because most ministries and places of business are staffed only by men, if she wants to apply for a job, pay a telephone bill, or secure a visa to import a maid for her home, she needs a male relative to accompany her.
If the men in her life are not enforcing these strictures, self-appointed members of the Committee for the Promotion of Virtue and the Prevention of Vice, the mutawa’a, or so-called religious police, will always do so.
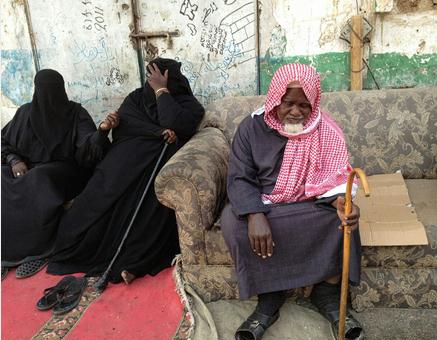
The imam’s mother, like many traditional Saudi women, is one of several wives of her husband. His two other wives, she explains, live nearby so he can easily move from home to home. The wives do not mix, but their children do. One of the other guests acknowledges that she too is the second wife of her husband of two decades.I ask if any of the younger females shares her husband with another wife, and each emphatically shakes her head no. “But it is not my choice,” adds one. “If Allah wills, I accept.
Before the migration of nearly 80% of all Saudis from rural villages into one of three urban centers—Riyadh, Jeddah, and Dammam—people were much freer, they say. A woman’s abaya was simply a short shawl around the shoulders. Couples mixed over dinners in their homes. Children played all across their neighborhoods and spent the night in each other’s homes, something most children aren’t allowed to do these days. “In the eighties the country became very conservative,” says one woman. “We no longer know what is required by religion.
Essentially a Saudi woman is seen as some kind of sexually depraved creature who, if alone in a car, would be rapidly lured into adultery. On the other hand, that same woman being chauffeured around Riyadh by a foreign male driver is considered secure, as she is under the control of a man—the driver. Moreover, that man by virtue of being foreign is seen by Saudi men as merely a sexless extension of the car with no possible appeal to the female passenger.
The independence and forthrightness of Arab women like Kadijah and Aisha were curtailed over the next centuries, as the new Islamic religion conquered most of the area from Arabia to Spain and its triumphant foot soldiers procured captured women as multiple wives and concubines. During the eighth and ninth centuries, women, now plentiful in the harems of elite men, became debased and dependent. Unfortunately for women, codification of Muslim legal thought and practice occurred during this period and achieved final formulation in the 10th century in four major schools of thought that still dominate today. These schools of thought were—and still are—deemed infallible. Thus, legal scholars to this day are obliged to follow precedent, not originate legal doctrine. As a result, women continue to be seen as sex objects whose intrigues can destroy men and disrupt society unless tightly controlled. “Establishment Islam’s version of the Islamic message survived as the sole legitimate interpretation … because it was the interpretation of the politically dominant—those who had the power to outlaw and eradicate other readings as ‘heretical.’ ” The same is true in Saudi today, where the Al Saud and their senior ulama enforce their interpretation of Islam.
Ironically, it was oil wealth that made possible the sidelining of half the country’s productive population. These days, as government allocation of oil wealth fails to keep up with a growing population and increased public expectations, more and more women hope to get off the sidelines and into the game.
Women’s sports are the latest arena for female activists. Officially, sports for girls are banned. This helps account for why some 66% of Saudi women (as opposed to 52% of Saudi men) are reported by health officials to be overweight. Despite this strong religious opposition, women in recent years have been forming soccer, basketball, volleyball, and cricket teams. Some are in schools. More are under the auspices of charities.
“If you want to change society, you have to change the women,” she says. The kingdom’s wealth is dwindling, she argues, and the new generation must be taught to create wealth, not simply consume it, as earlier Saudi generations have done.
The young, overwhelmingly Internet savvy, are well aware of the lifestyles of Western youth, but have almost no leisure options available in the kingdom to absorb their youthful energies. Cinemas are banned. Dating is forbidden. Shopping malls are off limits to young men unless accompanied by a female relative. (This is intended to ensure they do not prey on young women in the malls.) Public fields for soccer are few. Concerts are outlawed. Even listening to music is forbidden by conservative religious sheikhs, though this admonition is widely ignored, as the ubiquitous rap music along Tahlia Street underscores.
An annual book fair sponsored by the Ministry of Information and Culture is about as close to public entertainment as the kingdom gets. Yet religious fundamentalists in 2011 crashed even that staid event, seized a microphone, and berated the presence and dress of women in attendance. “Youth want freedom,” says Saker al Mokayyad, head of the international section at Prince Nayef Arab University, which trains the oppressive internal security forces, here and throughout the Arab world, that keep citizens under constant surveillance. “A young man has a car and money in his pocket, but what can he do? Nothing. He looks at TV and sees others doing things he can’t do and wonders why.
The youth rebellion takes many forms. Some young people simply show their independence by wearing baseball caps and sneakers or by adopting other Western fashions and habits, though this does not necessarily mean they want a Western way of life.
Bugnah concludes the film by interviewing the neighborhood imam, who acknowledges that young boys are selling drugs and young girls are sold by their fathers into prostitution to earn money. He asks each family what they want to say to King Abdullah, and each asks only for a home, something out of reach for about 70% of Saudis, given the high price of land because previous kings have given most of the state’s land to princes or a handful of powerful businessmen who do the regime’s bidding.
A second youth video, Monopoly, highlighted the near impossibility of owning a home in Saudi Arabia because a monopoly on landownership by royals and other wealthy Saudis has put the price of land out of reach of a majority of Saudis.
The Saudi government in 2010 installed in major cities a sophisticated camera system that tickets speeders by automatically sending a ticket to their cell phones. Traffic accidents are the number-one killer in Saudi Arabia. Every ninety minutes someone dies in a traffic accident, and every fifteen minutes another Saudi is left handicapped for life. Traffic fatalities in 2010 totaled more than six thousand, double the number who died in Britain, even though Saudi Arabia’s population is less than half that of Britain. The new saher system has been repeatedly vandalized by young Saudis, who destroy the cameras or steal license plates from police cars and then repeatedly speed through lights, generating scores of bogus tickets for police officers. Youth claim that the money from fines goes to enrich Prince Nayef bin Abdul Aziz, crown prince and minister of interior, who is responsible for the nation’s invasive intelligence agencies. In choosing this target, young Saudis are protesting what they see as both royal corruption and state intrusion into their lives.
Saudis, even Internet-savvy ones, are not at all like Western youth. It isn’t just that many young people in the West use drugs, have sex before marriage, and rarely even think about religion, let alone practice any faith. The biggest difference is that Western youth aren’t reared in societies that venerate religion or value tradition, so they are free to seek their own paths uninhibited by strong societal or family pressures. Young Saudis, even those resisting authority and seeking some independence, are struggling against the thick walls of religion and tradition constructed brick by brick from birth by family, school, mosque, and government. Even if these values and traditions are rejected, the act of breaking free defines the individual.
Saudi youth, whether liberal, traditional, or fundamentalist, share at least three characteristics: most are alienated, undereducated, and underemployed. Unlike their parents and grandparents, who generally express gratitude to the Al Saud for improving their standard of living during the oil boom of the 1970s, young Saudis born in the 1980s and 1990s have no memory of the impoverished Arabia prior to the oil boom and thus express almost no sense of appreciation. Instead, they have experienced a kingdom of poor schools, overcrowded universities, and declining job opportunities. Moreover, their royal rulers’ profligate and often non-Islamic lifestyles are increasingly transparent to Saudis and stand in sharp contrast both to Al Saud religious pretensions and to their own declining living standards.
Young people in any Saudi city drive past princely palaces that often stretch for blocks and ask how such opulence squares with the Prophet’s example of humility and equality among believers. They also hear their religious imams condemn any human likeness as sinful, yet they see life-size pictures of Al Saud rulers in the foyers of every public building in the kingdom.
“Facebook opens the doors of our cages,” says a young single Saudi man in his midtwenties, noting that the social network is the primary way men and women meet in the kingdom.
Saudi society, as we have seen, is deeply divided along multiple fault lines—tribal, regional, religious, gender, and more. All these divisions are visibly accentuated among Saudi youth. The gap between the easy riders on Riyadh’s Tahlia Street and the devout but questioning Imam University students, between the educated young women at Saudi ARAMCO and the isolated girls on the mountaintop in Faifa, between Lulu’s cloistered daughters and Manal’s liberated ones, is all the sharper and thus all the more threatening to the future stability of the Al Saud regime. If overall Saudi society was once homogeneous, the current generation of Saudi youth is openly and proudly heterogeneous. The most significant thing they have in common is dissatisfaction with the status quo. Whether, and if so how, to accommodate this pressure from the young is among the most daunting challenges for the Al Saud regime. CHAPTER
Saudi soccer games are about the only time reserved Saudis are allowed to shout and show joy.
The fact that most Saudi princes are as powerless as ordinary Saudis to address these problems may seem surprising, but perhaps it should not in a society where seniority trumps enterprise, especially among princes. Being born a prince still has advantages, but these days the benefits are more akin to those enjoyed by the offspring of elite businessmen or politicians in the West. These younger princes can gain access to an influential minister or businessman more easily than the average Saudi, but they have little access to or influence on the handful of senior Al Saud princes who rule the kingdom through division, diversion, and dollars.
Saudi Arabia’s founder fathered 44 sons and innumerable daughters. Many of his sons were almost as prolific as their father, so the kingdom now boasts thousands of princes—sons, grandsons, great-grandsons, and by now great-great-grandsons of the founder. These princes may be born to rule, but the truth is only a handful ever will.
In no other country on earth is there a royal family on anything like this scale. Collectively, they increasingly are viewed by the rest of Saudi society as a burdensome privileged caste.
The monarch sees their diversity, divisions, and demands as just one more problem requiring skillful management, all the more so as the issue of generational succession looms large, now that Abdul Aziz’s surviving sons all are in their late sixties or older. Even in a government that prefers princes for most key jobs in Riyadh ministries and provincial leadership roles around the country, the majority of Abdul Aziz’s heirs have no government position. Hundreds of them, to be sure, have quasi-official roles running programs to help the poor or foundations of one sort or another, and many hundreds more use their royal lineage to build businesses through which they obtain land and government contracts worth hundreds of millions and sometimes billions.
But the family is so large some princes still can’t find a sinecure. Third-generation princes are said to receive only $19,000 a month, hardly enough to lead a princely life, and King Abdullah, since assuming the throne in 2005, has stopped passing out envelopes of money to vacationing family members, has curbed the use of the Saudi national airline as an Al Saud private jet service, and has privatized the telephone company so the government no longer covers free cell phone usage for royals. The extended royal family, including progeny of Abdul Aziz’s siblings, is said to include roughly 30,000 members.
The prince typifies the generation that came of age in the 1980s on the heels of the attack on the Grand Mosque in Mecca by religious extremists. The country ceased sending students abroad for education and exposure to Western ways and sharply tilted toward pacifying the fundamentalists, allowing the religious establishment to dominate every aspect of Saudi life, especially education. So for most of the two decades between the attack on the Grand Mosque in 1979 and the attack by extremist Saudis on the World Trade Center in 2001, Saudi education was dominated by fundamentalist, xenophobic religious indoctrination that encouraged young Saudis to see the West as decadent and Christians and Jews as infidel enemies of Islam. That is pretty much Abdul Aziz’s view.
Major Saudi cities now offer all manner of modern consumer products not available a couple of decades ago. Indeed, about all that isn’t available in Saudi Arabia these days is entertainment, alcohol, and books that the government considers subversive—meaning most political and religious titles, including the Bible, and almost all books on Saudi Arabia.
Illiteracy has never shamed Saudis. No less an exemplar than the Prophet Muhammad could not read or write. For nearly two decades, the Angel Gabriel spoke Allah’s revelations to Muhammad, who repeated them to his followers. As with Muhammad, hear and repeat is the foundation of all Saudi education. To this day, the concept of educational inquiry is barely nascent in Saudi Arabia. Students from kindergarten through university for the most part sit in front of teachers
References
Ellyatt, H. 2019. Saudi Arabia is ‘gradually running out of money’ and needs IPO to fund reforms, ex-CIA chief says. CNBC.com