Preface. It’s obviously much easier and more energy efficient to set logs on fire for heat and electricity than to turn them into ethanol.
Burning biomass can’t do much to solve our energy crisis. To produce just 10% of U.S. electricity (405 TWh) would require wood plantations the size of Minnesota (Smil 2015). Every year.
Unfortunately, burnt biomass is not cleaner and greener than fossil fuels and just as hard and expensive to control. Burning wood emits carcinogens, NOx, carbon monoxide, Sulphur dioxide, carbon dioxide, antimony, arsenic, cadmium, chromium, copper, dioxins, furans, lead, manganese, mercury, nickel, polycyclic aromatic hydrocarbons (PAHs), selenium, vanadium, and zinc. If the wood was chemically treated then the range and amount of pollutants grows. Burning biomass worsens our health further by depositing fine particles in our lungs. In addition, burning biomass removes essential agricultural nutrients like nitrogen and phosphate from being returned to the soil that are essential to growing food (Biofuelwatch 2014, Reijnders 2006).
The energy burning biomass to generate electricity pales in comparison to all the energy that went into building the power station and emission controls, planting and logging tree plantations, trucking the biomass to the power station, chipping it into smaller bits, and burning it at only 35% efficiency or less.
When steam engines ruled, forests disappeared over the horizon from rivers and rail tracks. Biomass power stations have a similar problem, they are only cost effective using biomass within 100 miles, and if they burn a forest, it will take 50 years to regenerate.
Biomass technologies are plants that use biological resources, such as forestry waste or farming by-products, to produce electricity through thermal and chemical processes. Biomass technologies are in limited production here in California. While these technologies are designed to harness biological by-products sustainably, they suffer from:
The limitation of requiring large, reliable fuel sources to produce energy economically.
The high cost of transporting the fuel from the origination site to the generation site. This limitation exposes the producer to the volatile market for diesel or other petroleum fuels, which can unexpectedly add significant costs.
Biomass is plant- based material, agricultural vegetation, or agricultural wastes used as fuel and has three primary technology pathways:
Pyrolysis- transformation of biomass feedstock materials into fuel (often liquid “biofuel”) through the application of heat in the presence of a catalyst.
Combustion- transformation of biomass feedstock materials into useful energy through the direct burning of those feedstocks using a variety of burner/boiler technologies also used for burning materials such as coal, oil, and natural gas.
Gasification- transformation of biomass feedstock materials into synthetic gas through the partial oxidation and decomposition of those feedstocks in a reactor vessel and oxidation.
Of these technology pathways, only direct combustion of biomass is commercially available for utility-scale plants.
Gasification methods are used in some small-scale applications but are not yet viable for utility-scale applications.Active research into pyrolysis for biofuel production is ongoing but is not used for electricity production.
Combustion technologies are widespread and include the following general approaches:
Stoker boiler combustion uses similar technology for coal-fired stoker boilers to combust biomass materials, using either a traveling grate or a vibrating bed.
Fluidized bed combustion uses a special form of combustion where the biomass fuel is suspended in a mix of silica and limestone through the application of air through the silica/limestone bed. This is similar to technology used in newer coal-fired boilers. Fluidized bed combustion boilers are classified as either bubbling fluidized bed (BFB) or circulating fluidized bed (CFB) units.
Biomass- cofiring uses biomass fuel burned in conjunction with coal products in current pulverized- coal boiler technology used in utility-scale electricity production.
Recent sources of data and analysis have focused on the fluidized bed technology. It is also the most likely biomass technology to be installed in California. The remainder of this chapter will focus on fluidized bed technology
The inherent fuel versatility of fluidized bed systems provides a plant operator the ability to burn many biomass resource types, including those feedstocks with significant moisture variations.
Biomass fuel type and uniformity-The type and uniformity of delivered biomass fuel supply are a primary cost driver for any biomass technology. Given the variation of the delivered moisture content and heating value of biomass fuel feedstocks, along with fuel processing issues, the handling and processing costs of biomass fuels can vary greatly. As a result, the type and characteristics of the different biomass fuels can have a material impact on the capital cost of the boiler design, as well as the overall fuel handling and operations cost.
Fuel transport and handling costs- The availability of sufficient biomass fuel resources near the plant location is a critical driver for operating cost. Most biomass fuel is transported by truck to a plant site. To maintain commercially reasonable prices, the effective economic radius from the plant location to the aggregate fuel supply is limited to about 100 miles. The varied nature of biomass fuel feedstocks also necessitates special handling equipment and larger numbers of dedicated staff than are needed for coal- fired combustion power plants of equivalent size. As a result, the typical maximum size of biomass plants is limited to about 50 MW in California (McCann, et al., 1994).
Small biomass facilities lose a great deal of power over transmission lines.
Interconnection Loss Estimates for Generation Tie-Lines .
Boiler island cost-Capital cost of the boiler island is a critical cost driver that can account for roughly 40 to 60 percent of the overall plant cost, depending on the type of biomass combusted and the need for postcombustion pollution controls. The choice of source and type of fuels to be combusted is an important cost driver. In addition, the escalation trends for raw materials used in manufacturing the boiler island, primarily steel cost, are factors that can influence delivered boiler island cost.
Long-term fuel supply contracts-Most current biomass fuel supply contracts are of short-term duration and can entail varying fuel qualities. A key cost barrier to promoting biomass circulating bed combustion in California is the ability to develop and achieve performance on long-term (for example, 5 years duration and longer) fuel supply contracts for available fuel sources.
Plant scale- While current CFB technology has been proven to utility-scale applications of up to 300 MW, supply availability limits potential plant scale. Steam-generator scale economies are substantial, with a 50 MW biomass plant likely to cost substantially more per kW than a 500 MW coal-fired plant of the same technology (McCann, et al., 1994).
Emissions control costs-Costs of emission control needed to satisfy air quality and permitting requirements can increase the cost of biomass plants. Post-combustion emissions control technologies, such as selective catalytic reduction/selective noncatalytic reduction technologies for NOx control, and additional particulate matter controls, are important cost drivers that can significantly increase the capital and operating costs of biomass plants.
Preface. Steam engines weren’t very efficient, 10 to 20% at best, which is why they went away beginning around 1920 when oil-powered engines came along. At the very best steam engines for transportation reached 10 to 20% efficiency. They were almost universally powered by coal, mostly by locomotives and stationary engines in factories. Only in America for a few decades was there so much wood that steam boats and locomotives burned wood rather than coal, until deforestation east of the Mississippi forced coal to be used, and a few decades later around 1920 oil combustion engines became more powerful, efficient, far less dangerous, and cheaper and the steam engines that remain are steam turbines used to generate electricity, not to move vehicles.
Steam turbines to generate electricity are very efficient — the best can be 45%. But since trucks run on diesel fuel and can’t be electrified with batteries or catenary, and biomass doesn’t scale up enough to produce electricity, I am mainly interested in steam engines burning biomass as a long-term replacement for diesel-engines for trucks in the future.
Biomass won’t scale up for vehicle and factory steam engines in the future for the same reason it didn’t in the past, the wood will run out quickly. Forests can take decades to grow back, since photosynthesis is inefficient, with about a half percent of new biomass added per year.
Further limiting biomass steam engines is that post carbon they will depend on horses, like they did in the past, to haul biomass fuel and water to the steam engine. Each horse needs an average of 5 acres to provide its food, land which is now used to produce human food.
Meanwhile, post fossil fuels, wood will also be needed for nearly everything – heating and cooking, homes and buildings, furniture and flooring, tools, roofs, and so on. It will be needed to make charcoal to make iron, bricks, metals, ceramics, and so on.
In fact, biomass depletion (especially deforestation) is one of the main reasons past civilizations have failed for the past 5,000 years (see one of my favorite books: John Perlin’s “A forest journey”. And not just because there isn’t enough biomass. When you cut down forests, topsoil blows and washes away, and agricultural production declines. War ships can no longer be built to trade or steal trees elsewhere.
Steam-powered vehicles are so inefficient I wasn’t going to ever cover them. But after several interviews about my book “When Trucks Stop Running”, several readers commented that we’ll use steam engines in the future. I agree. Until the forests are depleted, civilization crashes again, the forests grow back, and steam engines are made again, for a while.
Which reminded me of that one reason why the energy crisis isn’t feared by anyone is that it’s like Bop-a-mole. Even if you succeed in convincing someone that solar PV power won’t be able to replace oil because it has a low EROI (too low to replace itself let alone provide power for everything else), is too seasonal, requires too much non-existent energy storage, and so on, most people will reason: but there’s still wind power, hydrogen, geothermal, wave and tidal, hydropower, natural gas and so on. Given the reduction of news and conversation to ten-second soundbites, the pressure to be optimistic about everything all the time (the scientists will come up with something!), and lack of scientific education, I don’t expect to ever make a dent in the general ignorance on energy and natural resource matters, but I don’t mind. This site is meant for the very small percent of people who, like me, want to understand reality regardless of how depressing it may be. An even smaller subset of them will actually make different choices about career and where to live than they might have otherwise, choices that may save their lives in the bottleneck ahead. Good luck to anyone who has read this far!
As the American farm entered the 1800s, its main source of power came from three animals-the horse, the mule, or the ox. The average farm worked by horses was 100 acres, and a farmer walked 8 miles per acre to plow his fields (with a walking plow) at the average speed of 1 1/2 mph. With 100 acres, the farmer walked 800 miles to plow his fields. And he still had to plant the crop, and cultivate! For wheat and other crops the grain had to be separated from the chaff with a machine called the thresher. The thresher was powered by a power sweep, which was turned by horses. Everything depended on the strength and durability of humans and horses.
In 1849, things began to change. Some of the first portable steam engines for farm use were built in this year, in Philadelphia. They only provided belt power for machines like the thresher. There were three sizes-4, 10, and 30 horsepower. The 4-hp model sold for $625 and the 30-hp model sold for $2300. That was a lot of money back then! These machines were also heavy; the 4-hp model weighed two tons, or 1000 pounds per horsepower!
These machines were pulled from field to field by horses. The steam engine provided steady power, it didn’t tire after hard work, and it only was “fed” when it worked; instead of all year round, like animals. Yet these machines were still crude, and a low steam pressure of 50 to 90 p.s.i. limited the amount of work that could be done.
Over the next few years, the steam pressure would be steadily increased with better quality material and construction of the boilers. However the greatest change of the steam engine would make it unforgettable for the next 150 years-“Self Propelled” steam engines began their debut in 1855. At first they were just a normal “Portable” engine, with chains or gears connecting the crankshaft and the rear wheels. They couldn’t even steer! They still needed horses to turn. But the self-propelled engine could also pull its thresher behind it.
If a steam engine could pull a thresher, it could also pull another type of load-the plow. In 1855, a “steam plow” was used by its inventor Obed Hussey. In 1858, Joseph Fawkes used his 30-hp engine; named “Lancaster”, for a plowing demonstration at the Illinois State Fair. The engine and plow were then taken to the U.S. Agricultural Society’s contest in Chicago where it won the championship. The steam engine that could be used for plowing, pulling, belt work, or other uses became known as the Steam Traction Engine.
Then, development of the steam engine slowed as the Civil War began. Most industry was used to produce weapons of war. However, the Armies required more food, and the Armies took many men from their farms at the same time. The few men and women left on the farms needed to use technology to keep up with demand. So the small number of steam engines (mostly portable types) became more popular. Yet the war kept farmers from getting the technology they wanted. It would have to wait until after the war…
After the war, steam engines steadily improved in technology and quality. Many different types and manufacturers of engines sprung up. Case, one of the largest manufacturers of steam engines, made its first engine in 1876. Port Huron began in 1882. In 1880, a patent was issued for a steering devise; the steam engine could make itself turn! Then came the invention of the clutch (very high technology!). Steam pressures of 150 p.s.i. became commonplace. Work was easier for the farmer as the steam engine pulled the plow, and turned the belt to thresh the grain.
The steam traction engine’s popularity soared during the 1890s. But, so did the horse’s. Just as the Eli Whitney’s cotton gin needed more slaves; the steam engine required more horses. The steam traction engine could plow, haul huge loads, and power the threshing machine all day. It needed plenty of fuel and water, which was brought by horses. The increased amount of tilled land needed to be planted, and cultivated, which the steam engine was too big to do. Although the steam engine made horses unneeded for some big jobs, more horses were needed for many others.
Groups of farmers formed “threshing rings” in order to pay for the costs of an engine and thresher. It was very expensive; a 110 hp engine from Case could cost over $3000! The farmers began to realize that the steam engine, while useful, still didn’t keep expenses down enough (when you add horses to the bill) to make them useful to the small farmer. Only larger farms could afford them. As the “newfangled” gasoline engines became more reliable, and smaller, they began to cut into the steam engine’s market. From 1900 and on the steam engine became less popular. In 1924 came the Farmall, a gas tractor that could do all the jobs on the farm. It was the final nail in the coffin. Steam production stopped a few years later. A few steam engines worked ’till World War Two. Then many were lost in the scrap drives. Not too many are around today, and you can only see them at antique tractor shows. Yet, when they are there, you notice them. Just look for the plumes of coal/wood smoke, and listen for the whistles. They still are impressive!
Interesting Information
President Abraham Lincoln said in 1859-“The successful application of steampower to farm work is a desideratum-especially a steam plow. To be successful, it must, all things considered, plow better than can be done by animal power. It must do all the work as well, and cheaper, or more rapidly, so as to get through more perfectly in season; or in some way afford an advantage over plowing with animals, else it is no success.”
Horsepower in steam engines was first measured with the formula, 1hp for every 10-14 square feet of boiler surface. But this formula was outdated by the increase of steam pressures in the engines, yet the formula was used until 1911. Then a new measurement-brake horsepower (which was measured on a Prony Brake-type dynamometer). An engine from 1908, which was advertised as 30hp, might be advertised as a 100hp engine in 1912! Some ads had both types of horsepower rating, such as 30-100hp.
Steam engines exploded every day in the U.S. in the early 1900s. For a plain steam traction engine-the boiler holds 52 cubic feet of water, and 26 cubic feet of steam at 150 psi. That 26 cubic feet of steam at 150 psi weighs 9.73 lbs, but holds 1,300,000 foot pounds of energy. The 52 cubic feet of water is at 366° F. It holds 38,000,000 foot pounds of energy. When the boiler fails, it releases enough energy (from the steam and water) to send a one-pound object straight up 7,500 miles (into orbit). Or a 7,500 pound object (the traction engine) one mile up!
Some reader comments:
The early farms were not 100 acres in size, most of them were much closer to 40 acres, and probably less than 20 acres was actually plowed under, so the theory of a farmer walking 800 miles just to get the plowing done is a bit far-fetched. A farm of 100 acres would have been quite an operation and would have required several hired men.
This was a good report but the dates are misleading. plowing with traction engines did not start until about 1876 when case introduced the first traction engine.
References
Ertel, Patrick W. American Steam Tractors. 1997.
Halberstadt, Hans. Steam Tractors. 1996. Iron Will. Reiman Publications, L.P., 1997.
Letourneau, Peter. Vintage Case Tractors. 1997.
Macmillan, Don., and Jones, Russell. John Deere Tractors and Equipment, Volume One 1837-1959. American Society of Agricultural Engineers, 1988.
Moorhouse, Robert. The Illustrated History of Tractors. Quintet Publishing Limited, 1996.
Norbeck, Jack. Encyclopedia of American Steam Traction Engines. Crestline Publishing Co., 1976.
Preface. The following industries need heat of up 1800 to 3275 F: Chemicals, Forest products, Iron and Steel, Plastics & Rubber, Fabricated metals, Transport Equipment, Computers, electronics & equipment, Aluminum, Cement, Glass, Machinery, Foundries. For nearly all of these products, there is no commercial electric process. Hydrogen steel is still at prototype stage and far from commercial.
Chapter 9 of my book “Life After Fossil fuels” lists the top heat from nuclear (572), geothermal (400) and others, none of them are hot enough, not even the proposed small nuclear reactors. So that leaves charcoal. According to wiki “Charcoal briquettes can burn up to approximately 1,260 °C (2,300 °F) with a forced air blower forge.”
De Decker (2011) explains that “A large share of energy consumed worldwide is by heat. Cooking, space heating and water heating dominate domestic energy consumption. In the UK, these activities account for 85% of domestic energy use, in Europe for 89% and in the USA for 61%. Heat also dominates industrial energy consumption. In the UK, 76% of industrial energy consumption is heat. In Europe, this is 67%. Few things can be manufactured without heat.
Although it is perfectly possible to convert electricity into heat, as in electric heaters or electric cookers, it is very inefficient to do so. It is often assumed that our energy problems are solved when renewables reach ‘grid parity’ – the point at which they can generate electricity for the same price as fossil fuels. But to truly compete with fossil fuels, renewables must also reach ‘thermal parity‘. It still remains significantly cheaper to produce heat with oil, gas or coal than with a wind turbine or a solar panel.”
In today’s solar thermal plants, solar energy is converted into steam (via a steam boiler), which is then converted into electricity (via a steam turbine that drives an electric generator). This process is just as inefficient as converting electricity into heat: two-thirds of energy gets lost when converted from steam to electricity.
But the good news is that you wont’ starve — the food, beverage and textile industries don’t need high heat.
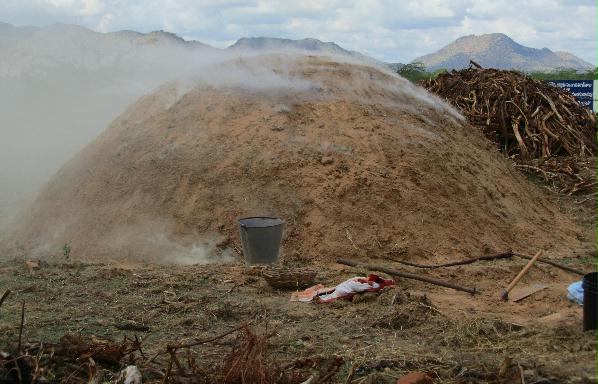
But oh dear, at what a cost to the planet. In the past, the massive production of charcoal, employing hundreds of thousands of workers was a major cause of deforestation
The machete-wielding men lodge themselves deep inside forests for weeks at a time, felling trees that will be incinerated into pieces of charcoal. Because they often work at night and target seemingly idle public land, they operate with relative impunity while decimating forests in parts of Africa.
Fires in Brazil’s Amazon rainforest have underscored the challenges of conserving the Earth’s forest cover, a substantial amount of which is found in Africa. After the Amazon, the Congo basin tropical rainforest — covering territory the size of Western Europe — is the world’s second largest, often referred to as the Earth’s second lung.
The world’s poorest continent, home to over 1.2 billion people, has long struggled to protect its forests amid a population explosion that fuels demand for plant-based energy sources seen by many as cheap, especially charcoal.
Some 25% to 35% of climate-changing greenhouse gas emissions come from so-called biomass burning, which also includes seasonal fires intentionally set to clear land for agriculture, according to the European Space Agency. The majority of those fires occur in tropical regions of Africa.
Reliance on charcoal or firewood is highest in Africa and Asia, according to a 2018 report by the U.N. Food and Agriculture Organization, with some African cities almost entirely dependent on charcoal for cooking. In Kinshasa, the capital of Congo, 90% of residents rely mainly on it, the report said.
In Somalia, ravaged by extremist violence, the cutting of trees to sustain an illicit charcoal trade is so widespread that the U.N. has warned that desertification there threatens stability.
The value of the charcoal export trade from the Horn of Africa nation to the Middle East and elsewhere — though banned — is estimated at over $360 million per year. Some 8.2 million trees were felled for charcoal between 2011 and 2017, according to U.N. figures.
In Uganda, an East African nation whose lush vegetation once inspired Winston Churchill to call it “the pearl of Africa,” authorities have long warned about the unsustainable nature of the charcoal trade, which persists despite the extension of the power grid deep into the country. Hydroelectric power remains too expensive for many people even in the capital, Kampala, as middle-class families run charcoal stoves to keep electricity bills down.
Edwin Muhumuza, an environmental protection activist who runs the Kampala-based civic group Youth Go Green, said demand for charcoal has turned it into a precious commodity much like gold or coffee.
“We are really concerned,” he said. “What annoys is they cut down the trees but they don’t replace them.”
Now the National Environment Management Authority, a government agency, is urging authorities to remove consumption taxes on liquid petroleum gas, an alternative source of cooking energy, to save forests from the charcoal business.
Figures show a dire situation. Uganda’s forest cover as a percentage of total land stood at 9% in 2015, down from 24% in 1990, according to government data.
But authorities in northern districts such as Gulu, which provides much of the charcoal entering Kampala, are fighting back in a campaign that has yielded scores of impounded charcoal trucks since 2015.
Gulu chairman Martin Mapenduzi organizes raids in hopes of arresting charcoal burners.
“Illegal logging has gone down but the destruction of forests for charcoal burning is still high,” Mapenduzi said. “It’s something that is giving us a lot of headache, but we are fighting.”
The price of a bag of charcoal, which can sustain a small family for several weeks, has been rising steadily in Kampala, reaching about $28 in August largely because of reduced supply from places such as Gulu. A whole bag is unaffordable for many who instead buy it daily in smaller quantities.
The expense is still far too much for families, said Rose Twine, an entrepreneur who sells her version of an eco-stove while warning against what she calls the unsustainable reliance on charcoal.
Preface. Below are excerpts from several articles about why a completely automated vehicle is unlikely. Heaven forbid they are invented. Researchers have found that people will drive 76% more miles, stop using bicycles and mass transit, waste a considerable amount of energy, and increase congestion.
In December of 2021 I heard Ralph Nader being interviewed on Science Friday about car safety. When asked about self-driving, he laughed, and said that was such a fantasy, since it required very detailed, up-to-date filming of all streets, which could throw the software off if changes were made, or if the white and yellow lines on the road weren’t clearly visible, and it would cost tens of billions of dollars to maintain highways to the standards needed for car software. I can see that California is aware of this and plans to improve 395,000 miles of highway striping (Snibbe 2018).
Self-driving cars in the news:
Metz C (2021) The Costly Pursuit of Self-Driving Cars Continues On. And On. And On. New York Times. Seven years ago Waymo discovered that spring blossoms made its self-driving cars get twitchy on the brakes. So did soap bubbles. And road flares. Matching the competence of human drivers was elusive. The cluttered roads of America, it turned out, were a daunting place for a robot. The wizards of Silicon Valley said people would be commuting to work in self-driving cars by now. Instead, there have been court fights, injuries and deaths, and tens of billions of dollars spent on a frustratingly fickle technology that some researchers say is still years from becoming the industry’s next big thing. Only the deepest-pocketed outfits like Waymo, a subsidiary of Google’s parent company, Alphabet; auto giants; and a handful of start-ups are managing to stay in the game.
Consensus is growing among designers that self-driving cars just aren’t perceptive enough to make them sufficiently safe.
The problem is that cars can’t begin to figure out what’s around them — separating toddlers from traffic cones, for example — if they can’t see the objects in the first place. Autonomous cars still can’t see well enough to safely maneuver in heavy traffic or see far enough ahead to handle highway conditions in any kind of weather.
Until now, the standard model for autonomous cars has used some combination of four kinds of sensors — video cameras, radar, ultrasonic sensors and lidar. It’s the approach used by all the leading developers in driverless tech, from Aptiv to Waymo. However, as dozens of companies run trials in states like California, deployment dates have drifted, and it has become increasingly obvious that the standard model may not be enough.
Video cameras can be foiled by glare. Standard radar can judge the relative speed of objects but has Mr. Magoo-like vision. Ultrasonic sensors can sense only nearby objects — and not very clearly. Lidar (formally, light detection and ranging), while able to create 3-D images of people and street signs, has distance limitations and can be stymied in heavy rain. And even the most sophisticated artificial intelligence software can’t help if it doesn’t have the perceptual data to begin with.
My comment: according to the article, other sensing technologies are being developed, but read the articles below before thinking this is an easy technical problem to solve soon. Just be glad that some of this technology is making conventional cars safer to drive.
Mervis, J. December 15, 2017. Not so fast. We can’t even agree on what autonomous, much less how they will affect our lives. Science.
Human drivers aren’t as unsafe as they’re made out to be. A fatal crash now occurs once every 3.3 million hours of vehicle travel. It will be hard for an automated system to beat that. The public will be much less accepting of crashes caused by software glitches or malfunctioning hardware rather than human error. “Society now tolerates a significant amount of human error on our roads,” Pratt told a congressional panel earlier this year. “We are, after all, only human.”
While developers amass data on the sensors and algorithms that allow cars to drive themselves, research on the social, economic, and environmental effects of Automated Vehicles (AVs) is sparse. Truly autonomous driving is still decades away according to most transportation experts.
In the dystopian view, driverless cars add to many of the world’s woes. Freed from driving, people rely more heavily on cars—increasing congestion, energy consumption, and pollution. A more productive commute induces people to move farther from their jobs, exacerbating urban sprawl. At the same time, unexpected software glitches lead to repeated recalls, triggering massive travel disruptions. Wealthier consumers buy their own AVs, eschewing fleet vehicles that come with annoying fellow commuters, dirty back seats, and logistical hassles. A new metric of inequality emerges as the world is divided into AV haves and have-nots.
Companies have good reason for painting the rosiest scenario for their technology, Shladover, a transportation engineer at the California Partners for Advanced Transportation Technology program in Richmond says. “Nobody wants to appear to be lagging behind the technology of a competitor because it could hurt sales, their ability to recruit top talent, or even affect their stock price,” he says.
As a result, it’s easy for the public to overestimate the capabilities of existing technology. In a fatal crash involving a Tesla Model S and a semitrailer in May 2016, the driver was using what Tesla describes as the car’s “autopilot” features—essentially an advanced cruise control system that can adjust the car’s speed to sync with other vehicles and keep the car within its lane. That fits the definition of a level-two vehicle, which means the driver is still in charge. But he wasn’t able to react in time when the car failed to detect the semi.
Shladover believes AV companies need to be much clearer about the “operational design” of their vehicles—in other words, the specific set of conditions under which the cars can function without a driver’s assistance. “But most of the time they won’t say, or they don’t even know themselves,” he says.
But progress will likely be anything but steady. Level three, for example, signifies that the car can drive itself under some conditions and will notify drivers when a potential problem arises in enough time, say 15 seconds, to allow the human to regain control. But many engineers believe that such a smooth hand-off is all but impossible because of myriad real-life scenarios, and because humans aren’t very good at refocusing quickly once their minds are elsewhere. So many companies say they plan to skip level three and go directly to level four—vehicles that operate without any human intervention.
Even a level-four car, however, will operate autonomously only under certain conditions, say in good weather during the day, or on a road with controlled access.
Rural communities might need government subsidies to give residents of a sparsely populated area the same access to AVs that their urban neighbors enjoy. And advocates for mass transit, bicycling, and carpooling are likely to demand that AV fleets enhance, rather than compete against, these sustainable forms of transportation.
Decades of research have warned about the human attention span in automated cockpits
After the Tesla’s Model S in auto-pilot mode crashed into a truck and killed its driver, the safety of self-driving cars has been questioned due to 3 factors: the autopilot system didn’t see the truck coming, the driver didn’t notice the truck either, so neither applied the brakes.
Who better knows the dangers than NASA, where automation in cockpits has been studied for decades (i.e. cars, space shuttle, airplane). They describe how connected a person is to a decision-making process as “in the loop”, which, say driving a car yourself, means Observe, Orient, Decide, Act (OODA). But if your car is in autopilot but you can still interact with the system to brake or whatever, you are “ON the loop”.
Airplanes fly automated, with pilots observing. But this is very different from a car. If something goes wrong the pilot has many minutes to react. The plane is 8 miles in the air.
But in a car, you have just ONE SECOND. That requires a faster reflex reaction time than a test pilot. There’s almost no margin for error. This means you might as well be driving manually since you still have to be paying full attention when the car is on autopilot, not sitting in the back seat reading a book.
Tesla tries to get around this by having the autopilot make sure the driver’s hands are on the wheel and visual and audible alerts are triggered if not.
But NASA has found this doesn’t work because the better the auto-pilot is, the less attention the driver pays to what’s going on. It is tiring, and boring, to monitor a process that does well for a long time, and was called a “vigilance decrement” as far back as 1948. Experiments back then showed that after just 15 minutes vigilance drops off.
So the better the system the more we’re likely to stop paying attention. But no one would want to buy a self-driving car that they may as well be driving. The whole point is that dangerous stuff we’re already doing now like changing the radio, eating, and talking on the phone would be less dangerous in autopilot mode.
These findings expose a contradiction in systems like Tesla’s Autopilot. The better they work, the more they may encourage us to zone out—but in order to ensure their safe operation they require continuous attention. Even if Joshua Brown was not watching Harry Potter behind the wheel, his own psychology may still have conspired against him.
Tesla’s plan assumes that automation advances will eventually get around this problem.
Transportation experts have set up 6 levels of automation.
What the car does at each of the 6 levels:
0: nothing
1: accelerates, brakes, OR steers
2: accelerates, brakes, AND steers
3: assumes full control within narrow parameters, such as when driving on the freeway, but not during merges or exit.
4: Everything, only under certain conditions (e.g. specific locations, speed, weather, time of day)
5: everything: goes everywhere, any time, and under all conditions
What the driver does:
0: Everything
1: Everything but with some assistance
2: remains in control, monitors and reacts to conditions
3: must be capable of regaining control within 10-15 seconds
4: Nothing under certain conditions, but everything at other times
5: Nothing, and unable to assume control
Our take on the prospects:
0: older fleet
1: present fleet
2: Now in testing
3: might never be devloped
4: where the industry wants to be
5: Never
Computers do not deal well with anything unexpected, with sudden and unforeseen events. Self-driving cars can obey the rules of the road, but they cannot anticipate how other car drivers will behave. Without super-accurate GPS automation relies on seeing lines on the pavement to keep in their lane, but snow, rain, and fog can make them go away. Self-driving cars rely on special detailed maps of the location of intersections, on-ramps, stop signs and so on. very few roads are mapped to this degree, or updated with construction, detours, conversions to roundabouts, new stop lights, and so on. They don’t detect potholes, puddles, or oil spots well and can be confounded by the shadows of overpasses. If a collision is unavoidable, do you run over the child or swerve into a light pole and kill the driver potentially? (Boudette 2016).
Self-driving cars will require human supervision. On many occasions, the cars will tell their human drivers, “Here, you take the wheel,” when they encounter complex driving situations or emergencies. In the automotive industry, this is referred to as the hand-off problem, and automotive engineers say there is no easy solution to make a driver who may be distracted by texting, reading email or watching a movie perk up and retake control of the car in the fraction of a second that is required in an emergency. The danger is that by inducing human drivers to pay even less attention to driving, the safety technology may be creating new hazards. The ability to know if the driver is ready, and if you’re giving them enough notice to hand off, is a really tricky question.
The Tesla performed well in freeway driving, but on city streets and country roads, Autopilot performance could be described as hair-raising. The car, which uses only a camera to track the roadway by identifying lane markers, did not follow the curves smoothly or slow down when approaching turns. On a 220-mile drive to Lake Tahoe from Palo Alto, Calif., Dr. Thrun said he had to intervene more than a dozen times.
Like the Tesla, the new autonomous Nissan models will require human oversight and even their most advanced models aren’t autonomous in snow, heavy rain and some nighttime driving.
You could propose various fixes, but none of them get around the 1 second time for the driver to react. That is not fixable.
Massachusetts Institute of Technology, CSAIL. 2018. Self-driving cars for country roads: Most autonomous vehicles require intricate hand-labeled maps, but new system enables navigation with just GPS and sensors. ScienceDaily.
Uber’s recent self-driving car fatality underscores the fact that the technology is still not ready for widespread adoption. One reason is that there aren’t many places where self-driving cars can actually drive. Companies like Google only test their fleets in major cities where they’ve spent countless hours meticulously labeling the exact 3D positions of lanes, curbs, off-ramps and stop signs.
Indeed, if you live along the millions of miles of U.S. roads that are unpaved, unlit or unreliably marked, you’re out of luck. Such streets are often much more complicated to map, and get a lot less traffic, so companies are unlikely to develop 3D maps for them anytime soon. From California’s Mojave Desert to Vermont’s White Mountains, there are huge swaths of America that self-driving cars simply aren’t ready for.
Snibbe K (2018) New Road Striping in California Meant to Help Self-Driving Vehicles. The Orange County Register. https://www.govtech.com/fs/new-road-striping-in-california-meant-to-help-self-driving-vehicles.html
Really great short story about self driving cars: T. C. Boyle. 2019. Asleep at the Wheel. New Yorker.
Preface. This article appeared in the magazine Foreign Policy. Some key points:
Renewables to power the world would require 34 million metric tons of copper, 40 million tons of lead, 50 million tons of zinc, 162 million tons of aluminum, and no less than 4.8 billion tons of iron.
The batteries for power storage when the sun isn’t shining and the wind isn’t blowing will require 40 million tons of lithium requiring a 2,700 percent increase over current levels of extraction. Lithium is an ecological disaster. It takes 500,000 gallons of water to produce one ton of lithium. Most lithium is in dry areas, and mining companies are using up the groundwater, leaving nothing for farmers to irrigate their crops with, while chemical leaks from lithium mines have poisoned thousands of miles of rivers, killing entire freshwater ecosystems.
We’ll also need to replace 2 billion vehicles with electric vehicles, leading to even more mind-boggling amounts of materials.
Hickel J (2019) The limits of clean energy. If the world isn’t careful, renewable energy could become as destructive as fossil fuels. Foreign policy.
The conversation about climate change has been blazing ahead in recent months. Propelled by the school climate strikes and social movements like Extinction Rebellion, a number of governments have declared a climate emergency, and progressive political parties are making plans—at last—for a rapid transition to clean energy under the banner of the Green New Deal.
This is a welcome shift, and we need more of it. But a new problem is beginning to emerge that warrants our attention. Some proponents of the Green New Deal seem to believe that it will pave the way to a utopia of “green growth.” Once we trade dirty fossil fuels for clean energy, there’s no reason we can’t keep expanding the economy forever.
This narrative may seem reasonable enough at first glance, but there are good reasons to think twice about it. One of them has to do with clean energy itself.
The phrase “clean energy” normally conjures up happy, innocent images of warm sunshine and fresh wind. But while sunshine and wind is obviously clean, the infrastructure we need to capture it is not. Far from it. The transition to renewables is going to require a dramatic increase in the extraction of metals and rare-earth minerals, with real ecological and social costs.
We need a rapid transition to renewables, yes—but scientists warn that we can’t keep growing energy use at existing rates. No energy is innocent. The only truly clean energy is less energy.
In 2017, the World Bank released a little-noticed report that offered the first comprehensive look at this question. It models the increase in material extraction that would be required to build enough solar and wind utilities to produce an annual output of about 7 terawatts of electricity by 2050. That’s enough to power roughly half of the global economy. By doubling the World Bank figures, we can estimate what it will take to get all the way to zero emissions—and the results are staggering: 34 million metric tons of copper, 40 million tons of lead, 50 million tons of zinc, 162 million tons of aluminum, and no less than 4.8 billion tons of iron.
In some cases, the transition to renewables will require a massive increase over existing levels of extraction. For neodymium—an essential element in wind turbines—extraction will need to rise by nearly 35 percent over current levels. Higher-end estimates reported by the World Bank suggest it could double.
The same is true of silver, which is critical to solar panels. Silver extraction will go up 38 percent and perhaps as much as 105 percent. Demand for indium, also essential to solar technology, will more than triple and could end up skyrocketing by 920 percent.
And then there are all the batteries we’re going to need for power storage. To keep energy flowing when the sun isn’t shining and the wind isn’t blowing will require enormous batteries at the grid level. This means 40 million tons of lithium—an eye-watering 2,700 percent increase over current levels of extraction.
That’s just for electricity. We also need to think about vehicles. This year, a group of leading British scientists submitted a letter to the U.K. Committee on Climate Change outlining their concerns about the ecological impact of electric cars. They agree, of course, that we need to end the sale and use of combustion engines. But they pointed out that unless consumption habits change, replacing the world’s projected fleet of 2 billion vehicles is going to require an explosive increase in mining: Global annual extraction of neodymium and dysprosium will go up by another 70 percent, annual extraction of copper will need to more than double, and cobalt will need to increase by a factor of almost four—all for the entire period from now to 2050.
The problem here is not that we’re going to run out of key minerals—although that may indeed become a concern. The real issue is that this will exacerbate an already existing crisis of overextraction. Mining has become one of the biggest single drivers of deforestation, ecosystem collapse, and biodiversity loss around the world. Ecologists estimate that even at present rates of global material use, we are overshooting sustainable levels by 82 percent.
Take silver, for instance. Mexico is home to the Peñasquito mine, one of the biggest silver mines in the world. Covering nearly 40 square miles, the operation is staggering in its scale: a sprawling open-pit complex ripped into the mountains, flanked by two waste dumps each a mile long, and a tailings dam full of toxic sludge held back by a wall that’s 7 miles around and as high as a 50-story skyscraper. This mine will produce 11,000 tons of silver in 10 years before its reserves, the biggest in the world, are gone.
To transition the global economy to renewables, we need to commission up to 130 more mines on the scale of Peñasquito. Just for silver.
Lithium is another ecological disaster. It takes 500,000 gallons of water to produce a single ton of lithium. Even at present levels of extraction this is causing problems. In the Andes, where most of the world’s lithium is located, mining companies are burning through the water tables and leaving farmers with nothing to irrigate their crops. Many have had no choice but to abandon their land altogether. Meanwhile, chemical leaks from lithium mines have poisoned rivers from Chile to Argentina, Nevada to Tibet, killing off whole freshwater ecosystems. The lithium boom has barely even started, and it’s already a crisis.
And all of this is just to power the existing global economy. Things become even more extreme when we start accounting for growth. As energy demand continues to rise, material extraction for renewables will become all the more aggressive—and the higher the growth rate, the worse it will get.
It’s important to keep in mind that most of the key materials for the energy transition are located in the global south. Parts of Latin America, Africa, and Asia will likely become the target of a new scramble for resources, and some countries may become victims of new forms of colonization. It happened in the 17th and 18th centuries with the hunt for gold and silver from South America. In the 19th century, it was land for cotton and sugar plantations in the Caribbean. In the 20th century, it was diamonds from South Africa, cobalt from Congo, and oil from the Middle East. It’s not difficult to imagine that the scramble for renewables might become similarly violent.
If we don’t take precautions, clean energy firms could become as destructive as fossil fuel companies—buying off politicians, trashing ecosystems, lobbying against environmental regulations, even assassinating community leaders who stand in their way.
Some hope that nuclear power will help us get around these problems—and surely it needs to be part of the mix. But nuclear comes with its own constraints. For one, it takes so long to get new power plants up and running that they can play only a small role in getting us to zero emissions by midcentury. And even in the longer term, nuclear can’t be scaled beyond about 1 terawatt. Absent a miraculous technological breakthrough, the vast majority of our energy will have to come from solar and wind.
Reducing energy demand not only enables a faster transition to renewables, but also ensures that the transition doesn’t trigger new waves of destruction.
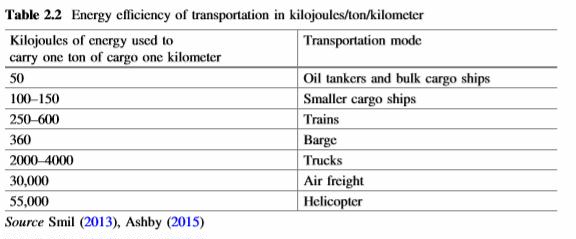
Preface. As oil declines and the energy crisis worsens, airplanes ought to be the first to go since they are 600 times less energy efficient than large cargo ships (30,000 / 50), 50 to 120 times less efficient than trains, and 7.5 to 15 times less efficient than trucks.
Though airplanes will continue to fly, because they use kerosene, which is a fraction of every crude barrel of oil, and much of it can’t be converted to diesel (trucks, rail, ships) or gasoline (cars). Though ships can burn just about anything, and since they carry 90% of all global trade, perhaps kerosene can keep them going a bit longer.
Kerosene is the fraction of choice for airplanes for a number of reasons. First, it has a much higher flash point than gas, commonly around 464°F. Second, kerosene has a freezing point of -57 F, which is not uncommon at the high altitudes planes fly at. In fact, it’s usually – 67 F — but the kerosene doesn’t freeze because the plane is flying through this cold air mass at hundreds of miles per hour. The speed of air over the wings creates friction, heating the surfaces (Page 2020).
United States air carriers burn through 17 billion gallons of jet fuel annually. The amount of fuel an airliner needs depends on many factors, including aircraft type, weight and direction of travel. Here are some price estimates for 2019 (Stewart 2019):
Los Angeles International to Tokyo Narita: This trans-Pacific hop uses an estimated 9,500 gallons of jet fuel at an estimated price of $19,190.
New York JFK to Los Angeles International: This popular transcon flight uses an estimated 5,325 gallons of jet fuel at an estimated price tag of $10,757. The return to New York uses slightly less fuel at 5,075 gallons with an estimated price of $10,252.
Chicago O’Hare to Miami International: Heading southbound, this flight operates using an estimated 2,350 gallons, with an estimated cost of $4,747. On the northbound return, the cost estimate soars to $7,201, using an estimated 3,565 gallons.
Denver International to San Francisco International Airport: This particular route can see significant variances in fuel quantity and pricing because of the variety of aircraft operating between the two cities. On average, aircraft fill up with an estimated 3,500 gallons of jet fuel, costing an estimated $7,070. However, price can vary from $4,040 on the low end to $14,140 on the high end.
It’s also been found that if airplanes flew in birdlike formations, the way geese fly in a V, up to 10% of their energy could be saved as well as emissions lowered (Khadilkar 2021).
Nygren, E., et al. 2009. Aviation fuel and future oil production scenarios. Energy Policy 37/10: 4003-4010
Jet fuel is extracted from the middle distillates fraction and competes with the production of diesel. Aviation fuel is almost exclusively extracted from the kerosene fraction of crude oil.
Today global oil production is roughly 81.5 million barrels per day (Mb/d), which is equivalent to an annual output of 3905.9 Mt.
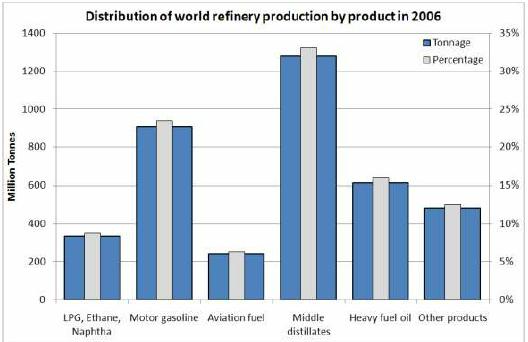
Aviation fuels include both jet fuel for turbine engines and aviation gasoline for piston engines. The dominant fuel is jet fuel originating from crude oil as it is used in all large aircraft. Jet fuel is almost exclusively extracted from the kerosene fraction of crude oil, which distills between the gasoline fraction and the diesel fraction. The IEA estimated the world’s total refinery production in 2006 was 3861 million tonnes (Mt). The aviation fuel part was 6.3%, implying an annual aviation fuel production of 243 Mt (corresponding to about 5 Mb/d), including both jet fuel and aviation gasoline.
Figure 3 shows how the world’s refinery production is divided into different fractions.
Figure 3: Distribution of world refinery production in 2006. The total production was 3861 Mt. Source: International Energy Agency, 2008b. Key World Energy Statistics 2008 and previous editions, see also: http://www.iea.org/textbase/nppdf/free/2008/key_stats_2008.pdf
If the refinery would like to increase jet fuel production, diesel production must decrease. During the year the proportion between diesel and jet fuel production changes and the fuel most profitable at that moment is produced.
Swedish Environmental class-1, ultra-low sulphur, diesel is a prioritized product, which has the consequence that no jet fuel at all is manufactured. The kerosene fraction is blended directly into the diesel fraction to provide the correct viscosity properties. Having fewer products is a way to increase the efficiency of the refinery.
The conclusion to be drawn is that aviation fuel production is not a fixed percentage of refinery output. In 2006, aviation fuel was 6.3% of world refinery production. The kerosene fraction is an average of 8-10% of the crude oil, but all kerosene does not become jet fuel or diesel. Kerosene can also be used to decrease the viscosity of the heavy fractions of crude oil and is used as lamp oil in certain parts of the world.
The environmental parameters that define the operating envelope for aviation fuels such as pressure, temperature and humidity vary dramatically both geographically and with altitude. Consequently, aviation fuel specifications have developed primarily on the basis of simulated performance tests rather than defined compositional requirements. Given the dependence on a single source of fuel on an aircraft and the flight safety implications, aviation fuels are subject to stringent testing and quality assurance procedures. The fuel is tested in a number of certified ways to be sure of obtaining the right properties following a specification of the international standards from, for example, IATA guidance material, ASTM specifications and UK defense standards (Air BP, 2000). Tests are done several times before the fuel is finally used in an airplane.
Today, the increasing addition of biofuels to diesel is a problem for the aviation industry. One of the more common biodiesels is FAME (Fatty Acid Methyl Esther). FAME is not a hydrocarbon and no non-hydrocarbons are allowed in jet fuel, except for approved additives as defined in the various international specifications such as DEF STAN 91-91 and ASTM D 1655. Consequently, biofuels-contaminated jet fuel cannot be utilized due to jet fuel standards. The problem with FAME is that it has the ability to be absorbed by metal surfaces. Diesel and jet fuel are often transported in a joint transport system making it possible for FAME stuck in tanks, pipelines and pumps to desorb to the jet fuel. The limit for contamination of jet fuel with FAME is 5 ppm. FAME can be picked up in any point of the supply chain, making 5 ppm a difficult limit and therefore the introduction of biofuels to the diesel fraction has had a negative impact upon jet fuel supply security.
References
Ashby, M.F., 2015. Materials and sustainable development table A.14.
Khadilkar D (2021) Tight Flight: A birdlike formation would save fuel for planes. Scientific American.
Preface. Vaclav Smil doesn’t mention using plastic for heat, but in a letter to The Guardian, David Reed suggests:
“The effort of collecting, transporting and cleaning plastics for possible recycling has largely failed, created much more pollution and contributed massively to climate change. The idea of burning plastics and using the energy to heat our homes was proposed by the plastics company Dow more than 30 years ago: it suggested treating all plastics as “borrowed oil”. At that time, ordinary domestic waste had a calorific value of low-grade coal, so the suggestion was that this waste should be burned in efficient plants with heat recovery and treatment of the gases produced, perhaps even trapping the carbon dioxide produced, rather than trying to recycle the complex (and dirty) mix of plastics. Today, with higher use of more complex plastics, this makes even more sense. Mixed plastics cannot really be recycled: they are long-chain molecules, like spaghetti, so if you reheat and reprocess them, you inevitably end up with something of lower performance; it’s called down-cycling.”
While this could be polluting if not done right, people will certainly turn to burning plastic and anything else they can get their hands on at some point of energy decline. Better to do it correctly now in an incinerator than in backyards in the future as well as to protect our land and waterways from plastic pollution right now.
Thermal recycling processes require temperatures of between 300 °C and 900 °C (572 °F to 1,650 °F), consuming a whole lot of energy (Nakaji 2021).
Fracked shale oil and gas have created a boom in plastics in the U.S., with billions of dollars invested in new plants to take advantage of this very temporary bonanza (of the 8 major tight oil basins, only the Permian is not in decline). Fracked oil is too light to be used as a transportation fuel.
2022-4-6 Ethane to outpace growth in all other U.S. petroleum product consumption through 2023. U.S. Energy Information Administration: Ethane mainly serves as a petrochemical feedstock to produce ethylene, which is used to make plastics and resins. Consumption of ethane has grown every year since 2010 in the U.S. More is now consumed than jet fuel or propane. Consumption of ethane, which we estimate using product supplied, grew by 50,000 barrels per day (b/d) in 2021, according to data from our March 2022 Petroleum Supply Monthly. We forecast in our March 2022 Short-Term Energy Outlook (STEO) that by 2023, U.S. consumption of ethane will grow by another 340,000 b/d.
Polyethylene (PE) is by far the most important thermoplastic (it accounted for 29% of the world’s aggregate plastic output, or roughly 77 Mt, in 2010), polypropylene (PP) comes next (with about 19% or 50 Mt in 2010), followed by polyvinyl chloride (PVC, about 12% or 32 Mt in 2010).
In 2010, packaging consumed almost 40% of the total (mostly as various kinds of PE and PP), construction about 20% (mostly for plastic sheets used as vapor barriers in wall and ceiling insulation), the auto industry claimed nearly 8% (interior trim, exterior parts), and the electrical and electronic industry took about 6% (mostly for insulation of wires and cables).
All of these products begin as ethane. In North America and the Middle East ethane is separated from natural gas, and low gas prices and abundant supply led to surplus production for export and favored further construction of new capacities: in 2012 Qatar launched the world’s largest LDPE plant and, largely as a result of shale gas extraction, new ethylene capacities are planned in the USA (Stephan, 2012). The dominant feedstock for ethane in Europe, where prices of imported natural gas are high, is naphtha derived by the distillation of crude oil.
Plastics have a limited lifespan in terms of functional integrity: even materials that are not in contact with earth or water do not remain in excellent shape for decades. Service spans are no more than 2–15 years for PE, 3–8 years for PP, and 7–10 years for polyurethane; among the common plastics only PVC can last two or three decades and thick PVC cold water pipes can last even longer (Berge, 2009).
Some products made out of plastic:
Transparent or opaque bags (sandwich, grocery, or garbage)
sheets (for covering crops and temporary greenhouses),
wraps (Saran, Cling)
squeeze bottles (for honey)
HDPE garbage cans
containers (for milk, detergents, motor oil)
HDPE for house wraps (Tyvek) and water pipes
PEX for water pipes and as insulation for electrical cables
UHMWPE for knee and hip replacements.
massive LDPE water tanks
indoor–outdoor carpeting
lightweight fabrics woven from PP yarn and used particularly for outdoor apparel
insulated wires, water, and sewage pipes to food wraps and her car’s interior and body undercoating
disposable and surgical gloves
flexible tubing for feeding
breathing and pressure monitoring, catheters
blood bags
IV containers
sterile packaging
trays
basins
bed pans and rails
thermal blankets
lab ware
construction (house sidings, window frames)
outdoor furniture
water hoses
office gadgets
toys
References
Nakaji Y et al (2021) Low-temperature catalytic upgrading of waste polyolefinic plastics into liquid fuels and waxes. Applied Catalysis B: Environmental.
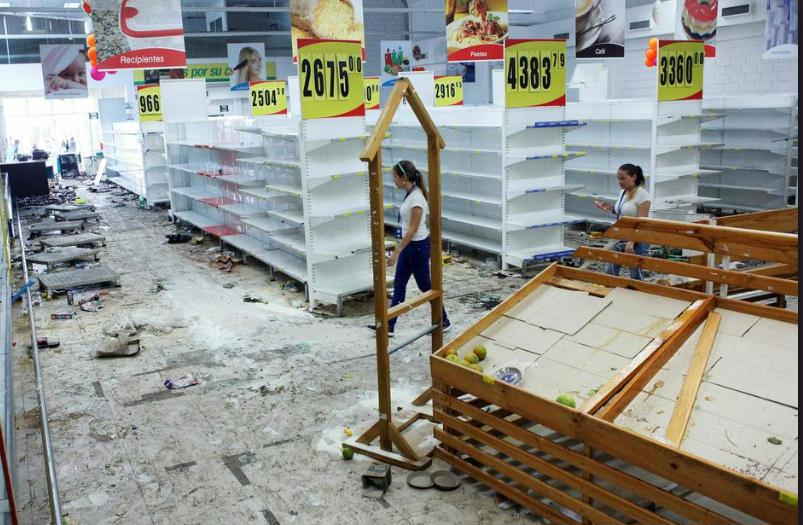
Preface. Venezuela is experiencing a double whammy of drought and low oil prices, which has lead to blackouts and inability to import food, due to their oil production peaking in 1997. If you want to know how collapse will unfold in the United States and elsewhere, read the posts from the categories and posts below. Mexico may be next as you can read here.
Crude oil is fouling waterways, contributing to deforestation, poisoning farmland and killing wildlife at an ever-greater rate.
The collapse of Venezuela’s once prolific oil industry has triggered an economic and humanitarian crisis that accelerated in 2019 after U.S. President Donald Trump implemented strict sanctions cutting the Maduro regime off from international energy markets. It isn’t only Venezuela’s economy and people which have suffered from a foundering hydrocarbon sector and corroding energy infrastructure, tremendous damage has occurred to the environment. Oil spills, leaking pipelines and storage facilities, noxious discharges from ramshackle intermittently operating refineries and toxic tar like slicks are commonplace in Venezuela. The OPEC member’s collapsing petroleum industry, along with precious metals and other mining, is a key culprit of the significant environmental damage occurring in the near-failed state. This is particularly worrying when it is considered that Venezuela is ranked as the eleventh most biodiverse country globally. Two organizations which provide regular reports and updates regarding the substantial environmental degradation occurring because of the petrostate’s oil industry are the Venezuelan Observatory of Environmental Human Rights and the Venezuelan Observatory of Political Ecology.
The Maracaibo Basin contains 15% of Venezuela’s copious oil reserves, which at 304 billion barrels are the largest globally, and is responsible for around two-thirds of the OPEC member’s hydrocarbon production. As a result, the lake contains thousands of drilling platforms, miles of pipelines which in many cases are unmapped and scores of storage facilities as well as other industry infrastructure. Most facilities are more than half a century old and heavily corroded because of their age and an endemic lack of crucial maintenance. The OVDHA estimates up to 1,000 barrels of crude (Spanish) are being discharged into Lake Maracaibo every day due to ongoing low-level leaks from heavily corroded petroleum pipelines, storage tanks and other decaying infrastructure.
With Venezuela in shambles, criminals and insurgents run large stretches of the nation’s territory. But some of them are stepping to take over the role the government used to play, and bring drinking water to residents in the arid scrublands, teach farming workshops and offer medical checkups. They mediate land disputes, fine cattle rustlers, settle divorces, investigate crimes and punish thieves.
Many residents — hungry, hunted by local drug gangs and long complaining of being abandoned by their government — have welcomed the Marxist guerrillas of Colombia, also known as the National LIberation Army (ELN) for the kind of protection and basic services the state is failing to provide.
By some estimates, guerrilla fighters from across the border now operate in more than half of Venezuela’s territory, according to the Colombian military, rights activists, security analysts and dozens of interviews in the affected Venezuelan states. Organized and well-armed, the ELN quickly displaced the local gangs that terrorized villages. The guerrillas imposed harsh penalties for robbery and cattle rustling, mediated land feuds, trucked in drinking water, offered basic medical supplies and investigated murders in a way the state never did, residents said.
It was hardly a charitable undertaking, though. In return for bringing stability, the ELN took over the smuggling and drug trafficking routes in the area, much as they have in parts of Colombia. They also began taxing shopkeepers and ranchers.
Colombian guerrillas have used the Venezuelan countryside as a haven for decades, and neglected Caracas shantytowns have long been home to organized crime. But rarely have criminal organizations exerted such territorial and economic control — and the government so little — as they do now. Venezuela is sleepwalking into fragmentation by armed groups.
Before the ELN took control, criminals fought brutally over the smuggling routes, terrorized neighborhoods, sprayed houses with bullets, and demolished villages. Most residents fled to Colombia, but are coming back now that it is safer.
The dismantling of Venezuela’s environmental institutions and the collapse of its oil sector have generated a chain reaction of unsustainable natural resource extraction. Illegal land grabbing, deforestation and an out-of-control gold rush in protected rainforest areas have created a perfect storm combining environmental degradation with a humanitarian crisis. Massive sediment loads from mining are decimating reservoirs and hydropower generation capacity, while mercury from gold extraction pollutes rivers and sickens people.
Throughout the 20th century, Venezuela, considered among the most biodiverse countries in the world, was a pioneer of sustainable policies. But starting in 1999, the government of Hugo Chávez began to systematically dismantle the country’s environmental protections, despite its progressive, pro-Indigenous rhetoric. “Eco-socialism” replaced functioning institutions, causing an avalanche of ecological disasters that mocked Venezuela’s commitments under the Paris agreement.
The devastation has accelerated under Nicolás Maduro, Chávez’s successor. Since becoming president, Maduro has overseen the total unraveling of Petróleos de Venezuela (PDVSA), Venezuela’s state oil company. PDVSA’s legal revenue from oil exports plummeted from $73 billion in 2011, to $22 billion in 2016, to $743 million in 2020.
The lack of infrastructure maintenance causes massive crude oil and pollutant spills with no remediation plans. Critical coastal marine and terrestrial environments are severely affected. The most important oil production regions, especially Lake Maracaibo, the northern Monagas state and the Orinoco oil belt, are degenerating into a mosaic of polluted wastelands.
To compensate for the losses in oil revenue, Maduro decreed 12 percent of the Venezuelan Amazon — an area bigger than Portugal — as a “mining development region”. This unique rainforest ecosystem, rich in biodiversity, also contains vast reserves of coltan, iron, bauxite, diamonds and, most importantly, gold.
According to Mongabay and Global Forest Watch, illegal mining, logging and collection of firewood for cooking accounted for over 3.2 million lost acres of rainforest between 2001 and 2018, one of the highest deforestation rates in tropical America. RAISG’s 2018 report and SOSOrinoco’s mining footprint map place Venezuela at the top of the list of Amazonian countries with the highest number of illegal mines. Hundreds of mining sectors have been detected, including 59 illegal gold mining clusters in Canaima National Park, a UNESCO World Heritage site, and other protected areas, which are home to 27 Indigenous communities.
Violence and disease plague the mining areas. Roughly 50 percent of reported malaria cases in Latin America are in Venezuela. Of 398,000 reported new cases in 2019, 70 percent were in southern Venezuela. Mining sites are exploited by state and nonstate groups, including the Colombian National Liberation Army (ELN) and the Revolutionary Armed Forces of Colombia (FARC), promoting violence, slave and child labor, prostitution and disintegration of Indigenous social structures.
2019. Venezuela’s Water System is Collapsing. New York Times.
In Venezuela, a crumbling economy and the collapse of even basic state infrastructure means water comes irregularly — and drinking it is an increasingly risky gamble. Scientists found that about a million residents were exposed to contaminated supplies. This puts them at risk of contracting waterborne viruses that could sicken them and threatens the lives of children and the most vulnerable.
The risks posed by poor water quality are particularly threatening for a population weakened by food and medication shortages.
Electrical breakdowns and lack of maintenance have gradually stripped the city’s complex water system to a minimum. Water pumps, treatment plants, chlorine injection stations and entire reservoirs have been abandoned as the state ran out of money and skilled workers
Outside Caracas, the breakdown of the water infrastructure is even more profound, leaving millions without regular supplies and forcing communities to dig wells and rely on untreated rivers.
The New York Times interviewed dozens of Venezuelan farmers. Nearly all have slashed their planting area this year and some are leaving their fields fallow – steps that are likely to deplete what is left of the food supply and lead even more Venezuelans to join the estimated four million who have already fled the country.
Farmers said they have tried to produce in spite of scarce inputs, price controls, crime, inflation and collapsing demand. But this year’s harvest is only half of 2018’s because of the gasoline shortage and other problems such as lack of seeds and fertilizer.
In Venezuela’s vast plains further east, sugar cane rots just yards from a refining mill and rice fields are left barren for the first time in 70 years because farmers don’t have fuel to transport their produce to distribution centers or seeds and fertilizers to plant new crops.
Venezuela’s main agricultural association, Fedeagro, estimates the area planted with the country’s main crops, corn and rice, will shrink by about 50% this year.
On a visit to Pueblo Llano last month, 150 cars waited outside the closed gas station for the sixth straight day. Many of the drivers slept in their cars to prevent robberies, braving the frigid weather at an altitude of 7,500 feet. During the day, they walked backed to their farmsteads, a trip that in some cases took hours. “While I’m sitting here in line, my produce is rotting in the fields,” said farmer Richard Rondón as he gave away summer squash as long as his arm from the back of his pickup truck to people passing by. “I got nothing to harvest with.”
The shortage has hamstrung the time-sensitive rice and corn harvest in the state of Portuguesa. In May, it prevented farmers from planting a new crop before the rainy season.
At the once-busy beach resort of Patanemo, tourism has evaporated over the last two years as Venezuela’s economic crisis has deepened and deteriorating cellphone service left visitors too afraid of robbery to brave the isolated roads. In some regions, travel requires negotiating roads barricaded by residents looking to steal from travelers.
These days, its Caribbean shoreline flanked by forested hills receives a different type of visitor: people who walk 10 minutes from a nearby town carrying rice, plantains or bananas in hopes of exchanging them for the fishermen’s latest catch.
With bank notes made useless by hyperinflation, and no easy access to the debit card terminals widely used to conduct transactions in urban areas, residents of Patanemo rely mainly on barter. In visits to three villages across Venezuela, Reuters reporters saw residents exchanging fish, coffee beans and hand-picked fruit for essentials to make ends meet in an economy that shrank 48% during the first five years of President Nicolas Maduro’s government.
Residents of the town of Guarico this year found a different way of paying bills – coffee beans for anything from haircuts to spare parts for agricultural machinery. The transactions are based on a reference price for how much coffee fetches on the local market, Linares said. In April, one kilo (2.2 pounds) of beans was worth the equivalent of $3.00. In El Tocuyo, another town in Lara state, three 100 kilo sacks of coffee buy 200 liters (53 gallons) of gasoline.
It is just one of a growing number of rural towns slipping into isolation as Venezuela’s economy implodes amid a long-running political crisis.
From the peaks of the Andes to Venezuela’s sweltering southern savannahs, the collapse of basic services including power, telephone and internet has left many towns struggling to survive.
Venezuela’s crisis has taken a heavy toll on rural areas, where the number of households in poverty reached 74% in 2017 compared with 34% in the capital of Caracas. Residents rarely travel to nearby cities, due to a lack of public transportation, growing fuel shortages and the prohibitive cost of consumer goods.
Walking for hours, making oil lamps, bearing water. For Venezuelans today, suffering under a new nationwide blackout that has lasted days, it’s like being thrown back to life centuries ago.
El Avila, a mountain that towers over Caracas, has become a place where families gather with buckets and jugs to fill up with water, wash dishes and scrub clothes. The taps in their homes are dry from lack of electricity to the city’s water pumps. “We’re forced to get water from sources that obviously aren’t completely hygienic. But it’s enough for washing or doing the dishes,” said one resident, Manuel Almeida.
Because of the long lines of people, the activity can take hours of waiting.
Elsewhere, locals make use of cracked water pipes. But they still need to boil the water, or otherwise purify it. “We’re going to bed without washing ourselves,” said one man, Pedro Jose, a 30-year-old living in a poorer neighborhood in the west of the capital.
Some shops seeing an opportunity have hiked the prices of bottles of water and bags of ice to between $3 and $5 — a fortune in a country where the monthly minimum salary is the equivalent of $5.50.
Better-off Venezuelans, those with access to US dollars, have rushed to fill hotels that have giant generators and working restaurants.
For others, preserving fresh food is a challenge. Finding it is even more difficult. The blackout has forced most shops to close.
“We share food” among family members and friends, explained Coral Munoz, 61, who counts herself lucky to have dollars.
For Kelvin Donaire, who lives in the poor Petare district, survival is complicated. He walks for more than an hour to the bakery where he works in the upmarket Los Palos Grandes area. “At least I’m able to take a loaf back home,” Donaire said.
Many inhabitants have taken to salting meat to preserve it without working refrigerators.
Others, more desperate, scour trash cans for food scraps. They are hurt most by having to live in a country where basic food and medicine has become scarce and out of reach because of rocketing hyperinflation.
The latest blackout this week also knocked out communications. According to NetBlocks, an organization monitoring telecoms networks, 85% of Venezuela has lost connection.
In stores, cash registers no longer work and electronic payment terminals are blanked out. That’s serious in Venezuela, where even bread is bought by card because of lack of cash. Some clients, trusted ones, are able to leave written IOUs.
With Caracas’s subway shut down, getting around the city is a trail, with choices between walking for miles, lining up in the out-sized hope of getting on one of the rare and badly overcrowded and dilapidated buses or managing to get fuel for a vehicle. Pedro Jose said bus tickets have nearly doubled in price.
As night casts Caracas into darkness, families light their homes as best they can. “We make lamps that burn gasoline, or oil, or kerosene — any type of fuel,” explained Lizbeth Morin, 30.
It’s hard to understand how bad a country is doing with figures like inflation rate, unemployment rate, and their minimum wage. A better way to understand a nation’s living standards is how many calories a person could afford to buy a day earning a minimum wage if they spent all of their money on food — that is — the food with the most calories, which in Venezuela has sometimes been pasta or flour, and today is the yucca plant.
Venezuelans could by 57,000 calories in 2012 with one day’s wages, and several dozen eggs.
But today a person can afford just 900 calories or 2 eggs. It would take a Venezuelan 6 weeks to be able to afford one Big Mac earning minimum wage.
Since the average person needs 2,000 calories a day, as well as calories to feed their family, and also housing, clothing, medicine, and so on, it’s not surprising that the average Venezuelan lost 24 pounds last year, and that Venezuela probably has the highest murder rate in the world.
The result is that at least 10% of Venezuelans have emigrated, nearly 3 million people. If that many proportionally left the U.S. we’d have 30 million people fleeing to Canada and Mexico and elsewhere.
…”Venezuela’s murder rate, meanwhile, now surpasses that of Honduras and El Salvador, which formerly had the world’s highest levels, according to the Venezuelan Violence Observatory. Blackouts are a near-daily occurrence, and many people live without running water. According to media reports, schoolchildren and oil workers have begun passing out from hunger, and sick Venezuelans have scoured veterinary offices for medicine. Malaria, measles, and diphtheria have returned with a vengeance, and the millions of Venezuelans fleeing the country — more than 4 million, according to the International Crisis Group — are spreading the diseases across the region, as well as straining resources and goodwill.”
…”Thanks to their geology, Venezuela’s oil fields have enormous decline rates, meaning the country needs to spend more heavily than other petrostates just to keep production steady. “
2017-10-22 Oil Quality Issues Could Bankrupt Venezuela. The next few weeks for Venezuela will be crucial, as it struggles to meet a huge stack of debt payments. Reports that the nation’s oil production is experiencing deteriorating quality raises a new cause for concern for the crumbling South American nation.Reuters reported that its oil shipments are “soiled with high levels of water, salt or metals that can cause problems for refineries”, which has led to $200 million in cancellations of oil contracts, making Venezuela even less able to make debt payments, since oil is the only source of revenue barely keeping the nation afloat. Many experienced oil workers have fled the country to find food and escape violence. Because of these problems, and Trump imposed sanctions, U.S. imports have dropped from roughly 700,000 barrels per day to 250,000 bpd.
2017-2-27 ASPO Peak Oil Review: A new survey shows that 75% of Venezuelans may have lost an average of 19 pounds in the last year as widespread food shortages continue. Nearly a third of the population are now eating two meals a day or less. The survey also shows that the average shopper spends 35 hours a month waiting in line to buy food and other necessities. A sense of hopelessness has engulfed the country, and most no longer have an incentive or the strength to protest against the government and its policies as was happening two years ago. Government roundups of opposition politicians continue. Venezuela is clearly well on its way to becoming a failed state.
Food Producers Alert They Have Only 15 Days Left of Inventory amid Rampant Inflation
“Despair and violence is taking over Venezuela. The economic crisis sweeping the nation means people have to withstand widespread shortages of staple products, medicine, and food. So when the Maduro administration began rationing electricity this week, leaving entire cities in the dark for up to 4 hours every day, discontent gave way to social unrest.
On April 26, people took to the streets in three Venezuelan states, looting stores to find food.
Maracaibo, in the western state of Zulia, is the epicenter of thefts: on Tuesday alone, Venezuelans raided pharmacies, shopping malls, supermarkets, and even trucks with food in seven different areas of the city.
Although at least nine people were arrested, and 2,000 security officers were deployed in the state, Zulia’s Secretary of Government Giovanny Villalobos asked citizens not to leave their homes. “There are violent people out there that can harm you,” he warned.
In Caracas, the Venezuelan capital, citizens reported looting in at least three areas of the city. Twitter users reported that thefts occurred throughout the night in the industrial zone of La California, Campo Rico, and Buena Vista. The same happened in Carabobo, a state in central Venezuela.
Supermarkets employees from Valencia told the PanAm Post that besides no longer receiving the same amount of food as before, they must deal with angry Venezuelans who come to the stores only to find out there’s little to buy.
Purchases in supermarkets are rationed through a fingerprint system that does not allow Venezuelans to acquire the same regulated food for two weeks.
Due to the country’s mangled economy, millions must stand in long lines for hours just to purchase basic products, which many resell for extra income as the country’s minimum wage is far from enough to cover a family’s needs.
On Wednesday, the Venezuelan Chamber of Food (Cavidea) said in a statement that most companies only have 15 days worth of stocked food.
According to the union, the production of food will continue to dwindle because raw materials as well as local and foreign inputs are depleted.
In the statement, Cavidea reported that they are 300 days overdue on payments to suppliers and it’s been 200 days since the national government last authorized the purchase of dollars under the foreign currency control system.
The latest Survey of Living Conditions (Encovi) showed that more than 3 million Venezuelans eat only twice a day or less. The rampart inflation and low wages make it increasingly more difficult for people to afford food.
“Fruits and vegetables have disappeared from shopping lists. What you buy is what fills your stomach more: 40 percent of the basic groceries is made up of corn flour, rice, pasta, and fat”.
But not even that incomplete diet Venezuelans can live on because those food products are hard to come by. Since their prices are controlled by the government, they are scarce and more people demand them.
The survey also notes the rise of diseases such as gastritis, with an increase of 25 percent in 2015, followed by poisoning (24.11 percent), parasites (17.86 percent), and bacteria (10.71 percent).
The results of this study are consistent with the testimony of Venezuelan women, who told the PanAm Post that because “everything is so expensive” that they prefer to eat twice a day and leave lunch for their children. That way they can make do with the little portions they can afford.”
Preface. With world peak oil production in 2018 so far (Peak oil is here!) it looks like peak sand won’t be the main factor in the fall of our fossil-fueled civilization. After all, oil makes all materials and activities possible, including sand. But still, interesting to know that so many limits to growth are being reached at roughly (see posts in category Peak Everything.)
Sand Primer:
Without sand, there would be no concrete, ceramics, computer chips, glass, plastics, abrasives, paint and so on
We can’t use desert sand because it’s too round, polished by the wind, and doesn’t stick together. You need rough edges, so desert sand is worthless
Good sand is getting so rare there’s an enormous amount of illegal mining in over 70 countries. In India the Sand Mafia is one of the most powerful, will kill for sand. It’s easy to steal sand and sell there.
This has led to between 75%-90% of beaches in the world receding and a huge amount of environmental damage.
By 2100 all beaches will be gone
Australia is selling sand to nations that don’t have any more (like the United Arab Emirates, who used all of their ocean sand to make artificial islands)
Sand is a big business, sales are $70 Billion a year
concrete is 40% sand
most construction sand comes from rivers, lakes and shorelines
How Much Sand is needed?
200 tons Average house
3,000 tons Hospital or other large building
30,000 tons per kilometer of highway
12,000,000 tons Nuclear Power Plant (that’s equal to nearly 250 miles of highway)
Half of all sand is trapped behind the 845,000 dams in the world.
Zhong X et al (2022) Increasing material efficiencies of buildings to address the global sand crisis. Nature sustainability.
here is a rapidly unfolding sand supply crisis in meeting growing material needs for infrastructure. We find a ~45% increase in global building sand use from 2020 to 2060 under a middle-of-the-road baseline scenario
Buildings provide the basic human needs for shelter and social infrastructure and form the foundations of societies. The construction of buildings is also highly material-intensive and consumes a large amount of metallic (for example, steel and copper) and non-metallic minerals (mainly concrete, brick and glass).
prominent commentaries have pointed to severe global sand crises impacting regions as diverse as Cambodia, California, the Middle East and China. Sand over-exploitation has commonly driven ecosystem destruction/collapse in shoreline erosion, biodiversity loss, less food production, and disaster resilience degradation, This will get worse as sand extraction and new buildings grow.
The use of sand and gravel has seen the fastest increase in use across all solid materials used by humans and now represents the largest share of material use (~68–85% by mass), surpassing fossil fuels and biomass. Sand is used mostly for making concrete or glass (with concrete comprising over 95% of this use in the building sector) and requires chloride-free supplies (to prevent corrosion of other building materials) along with specific physical properties in terms of both size and shape. For example, desert sand is too smooth to be used as a binding agent for concrete and sea sand is too high in chloride levels for most construction purposes. Most construction sand is extracted from rivers, lakes and shorelines.
In a rapidly growing market this has led to over-exploitation and degradation. Even when regulated, illegal sand mining and trade has been reported in ~70 countries, often involving highly organized gangs or ‘mafias’ operating with the complicity of regulators. The livelihoods of an estimated 3 billion people living along rivers are remarkably threatened by long-term, unsustainable sand exploitation, along with deep impacts on ecology and land availability.
We explore how building sand use might be reduced by 5 to 23% with these 6 strategies: (1) more intensive use, (2) building lifetime extension, (3) reductions in concrete content by lightweight design, (4) timber framing, (5) component reuse and (6) natural sand substitution by alternatives (7) reduce the floor area, (8) international cooperation
Glaciers grind rocks into silt, sand and gravel. Greenland hopes that there’s enough sand for them to become a sand exporter, if the environmental damage isn’t too high.
That won’t be easy. Nearly all sand is mined within 50 miles of its destination because it costs too much to move it more than that. So Greenland would have to find a way to make moving sand profitable.
A way to find the sand is required as well, since much of what the glacier produces is a fine silt that isn’t suitable for concrete.
Then if sand is found, an energy intensive process begins. A pipe is extended to the sea floor and sucks up water and sand. Huge amounts of sand would need to be extracted into large bulk carriers, and new ports,and loading facilities built. The distance to the nearest large cities is considerable longer than 50 miles. Boston is 2250 miles and London 1900 miles away.
Today 75 to 90% of the world’s natural sand beaches are disappearing, due partly to massive legal and illegal mining, rising sea levels, increasing numbers of severe storms, and massive erosion from human development along coastlines. Many low-lying barrier islands are already submerged.
The sand and gravel business is now growing faster than the economy as a whole. In the United States, the market for mined sand has become a billion-dollar annual business, growing at 10% a year since 2008. Interior mining operations use huge machines working in open pits to dig down under the earth’s surface to get sand left behind by ancient glaciers. But as demand has risen — and the damming of rivers has held back the flow of sand from mountainous interiors — natural sources of sand have been shrinking.
One might think that desert sand would be a ready substitute, but its grains are finer and smoother; they don’t adhere to rougher sand grains, and tend to blow away. As a result, the desert state of Dubai brings sand for its beaches all the way from Australia.
And now there is a global beach-quality sand shortage, caused by the industries that have come to rely on it. Sand is vital to the manufacturing of abrasives, glass, plastics, microchips and even toothpaste, and, most recently, to the process of hydraulic fracturing. The quality of silicate sand found in the northern Midwest has produced what is being called a “sand rush” there, more than doubling regional sand pit mining since 2009.
But the greatest industrial consumer of all is the concrete industry. Sand from Port Washington on Long Island — 140 million cubic yards of it — built the tunnels and sidewalks of Manhattan from the 1880s onward. Concrete still takes 80 percent of all that mining can deliver. Apart from water and air, sand is the natural element most in demand around the world, a situation that puts the preservation of beaches and their flora and fauna in great danger. Today, a branch of Cemex, one of the world’s largest cement suppliers, is still busy on the shores of Monterey Bay in California, where its operations endanger several protected species.
The huge sand mining operations emerging worldwide, many of them illegal, are happening out of sight and out of mind, as far as the developed world is concerned. But in India, where the government has stepped in to limit sand mining along its shores, illegal mining operations by what is now referred to as the “sand mafia” defy these regulations. In Sierra Leone, poor villagers are encouraged to sell off their sand to illegal operations, ruining their own shores for fishing. Some Indonesian sand islands have been devastated by sand mining.
To those of us who visit beaches only in summer, they seem as permanent a part of our natural heritage as the Rocky Mountains and the Great Lakes. But shore dwellers know differently. Beaches are the most transitory of landscapes, and sand beaches the most vulnerable of all.
Yet the extent of this global crisis is obscured because so-called beach nourishment projects attempt to hold sand in place and repair the damage by the time summer people return, creating the illusion of an eternal shore.
Before next summer, endless lines of dump trucks will have filled in bare spots and restored dunes. Virginia Beach alone has been restored more than 50 times. In recent decades, East Coast barrier islands have used 23 million loads of sand, much of it mined inland and the rest dredged from coastal waters — a practice that disturbs the sea bottom, creating turbidity that kills coral beds and damages spawning grounds, which hurts inshore fisheries.
It is time for us to understand where sand comes from and where it is going. Sand was once locked up in mountains and it took eons of erosion before it was released into rivers and made its way to the sea. As Rachel Carson wrote in 1958, “in every curving beach, in every grain of sand, there is a story of the earth.” Now those grains are sequestered yet again — often in the very concrete sea walls that contribute to beach erosion.
We need to stop taking sand for granted and think of it as an endangered natural resource. Glass and concrete can be recycled back into sand, but there will never be enough to meet the demand of every resort. So we need better conservation plans for shore and coastal areas. Beach replenishment — the mining and trucking and dredging of sand to meet tourist expectations — must be evaluated on a case-by-case basis, with environmental considerations taking top priority. Only this will ensure that the story of the earth will still have subsequent chapters told in grains of sand.
Stop illegal sand mining in India http://www.washingtonpost.com/world/asia_pacific/indias-illegal-sand-mining-fuels-boom-ravages-rivers/2012/05/19/gIQA3HzdaU_story.html
———————————————————————————–
Below is a table from CRYSTALLINE SILICA PRIMER, Industrial Minerals, U.S. Department of the Interior http://minerals.usgs.gov/minerals/pubs/commodity/silica/780292.pdf about how sand is used (see Table 2 for even more uses):
Table 1. Silica In Commodities And End-Product Applications
Commodity/form of silica/major commercial applications
Zircon / Quartz / Ceramics, refractories, zirconia production
In Heavy Industry
Foundry molds and cores for the production of metal castings are made from quartz sand. The manufacture of high-temperature silica brick for use in the linings of glass- and steel-melting furnaces represents another common use of crystalline silica in industry. The oil and gas industry uses crystalline silica to break up rock in wells. The operator pumps a water-sand mixture, under pressure, into the rock formations to fracture them so that oil and gas may be easily brought to the surface. More than 1 million tons of quartz sand were used annually for this purpose during the 1970’s and early 1980’s when oil-well drilling was at its peak. Quartz sand is also used for filtering sediment and bacteria from water supplies and in sewage treat ment. Although this use of crystalline silica has increased in recent years, it still represents a small proportion of the total use.
High-Tech Applications
Historically, crystalline silica, as quartz, has been a material of strategic importance. During World War II, communications components in telephones and mobile military radios were made from quartz. With today’s emphasis on military command, control, and communications surveillance and with modern advances in sophisticated electronic systems, quartz-crystal devices are in even greater demand. In the field of optics, quartz meets many needs. It has certain optical properties that permit its use in polarized laser beams. The field of laser optics uses quartz as windows, prisms, optical filters, and timing devices. Smaller portions of high-quality quartz crystals are used for prisms and lenses in optical instruments. Scientists are experimenting with quartz bars to focus sunlight in solar-power applications. Quartz crystals possess a unique property called piezoelectricity. A piezoelectric crystal converts mechanical pressure into electricity and vice versa. When a quartz crystal is cut at an exact angle to its axis, pressure on it generates a minute electrical charge, and likewise, an electrical charge applied to quartz causes it to vibrate more than 30,000 times per second in some applications. Piezoelectric quartz crystals are used to make electronic oscillators, which provide accurate frequency control for radio transmitters and radio-frequency telephone circuits. Incoming signals of interfering frequencies can be filtered out by piezoelectric crystals. Piezoelectric crystals are also used for quartz watches and other time-keeping devices
(It’s 2014 but 2011 is the most recent data available, only a third of those queried responded, stats for sand vs gravel are not broken out, no information about ecological damage or theft, a pretty inept, incomplete report overall, but for what it’s worth): A total of 810 million metric tons (Mt) of construction sand and gravel was produced in the United States in 2011. This was a slight increase of 5 Mt from the revised production of 2010, the first increase in annual production since 2006, following 4 consecutive years of decreases. The slight improvement came in response to increased demand from certain State economies experiencing the boom in natural gas and oil production and from some construction segments.
As sand and gravel became less available owing to resource constraint or economic conditions in some locales, builders began to crush bedrock to produce a manufactured sand and gravel often referred to as crushed stone
Of the 810 Mt of construction sand and gravel produced in 2011, 60% was reported or estimated without a breakdown by end use (tables 4–5). Of the remaining 327 Mt, 44% was used as concrete aggregate; 25% was used for road base and coverings and road stabilization; 13%, for asphaltic concrete aggregate and other bituminous mixtures; 12%, for construction fill; about 1% each, for concrete products, plaster and gunite sands, and snow and ice control; and the remainder was used for golf course maintenance, filtration, railroad ballast, road stabilization, roofing granules, and many other miscellaneous uses.
The high cost of transportation limit foreign trade to mostly local transactions across international boundaries. U.S. imports and exports were equivalent to less than 1% of domestic consumption.
Preface. This article raises many objections to nuclear power. Theoretically it could be cheaper, but the exact opposite has happened, it keeps getting more expensive. For example the only new reactors being built in the U.S. now are at Georgia Power’s Vogtle plant (Amy 2021). Costs were initially estimated at $14 billion; the latest estimate is $27 billion. The first reactors at the plant, built in the 1970s, took a decade longer to build than planned, and cost 10 times more than expected. The two under construction now were expected to be running 2016, but it’s now unlikely that they’ll be ready in 2022, or later, in the latest delay unit 4 won’t be ready until 2023 (Surran 2021).
The authors also point out that reactors are vulnerable to catastrophes from extreme weather, earthquakes, volcanoes, tsunamis; from technical failure; and unavoidable human error. Climate change has led to severe droughts that shut down reactors as the surrounding waters become too warm to provide the vital cooling function.
Commentators from Greenpeace to the World Bank agree that climate change is an emergency, threatening civilization and life on our planet. Any solution must involve the control of greenhouse gas emissions by phasing out fossil fuels and switching to alternative technologies that do not impair the human habitat while providing the energy we require to function as a species.
This sobering reality has led some prominent observers to re-embrace nuclear energy. Advocates declare it clean, efficient, economical, and safe. In actuality it is none of these. It is expensive and poses grave dangers to our physical and psychological well-being. According to the US Energy Information Agency,the average nuclear power generating cost is about $100 per megawatt-hour. Compare this with $50 per megawatt-hour for solar and $30 to $40 per megawatt-hour for onshore wind. The financial group Lazard recently said that renewable energy costs are now “at or below the marginal cost of conventional generation” — that is, fossil fuels — and much lower than nuclear.
In theory these high costs and long construction times could be brought down. But we have had more than a half-century to test that theory and it appears have been solidly refuted. Unlike nearly all other technologies, the cost of nuclear power has risen over time. Even its supporters recognize that it has never been cost-competitive in a free-market environment, and its critics point out that the nuclear industry has followed a “negative learning curve.” Both the Nuclear Energy Agency and International Energy Agency have concluded that although nuclear power is a “proven low-carbon source of base-load electricity,” the industry will have to address serious concerns about cost, safety, and waste disposal if it is to play a significant role in addressing the climate-energy nexus.
But there are deeper problems that should not be brushed aside. They have to do with the fear and the reality of radiation effects. At issue is what can be called “invisible contamination,” the sense that some kind of poison has lodged in one’s body that may strike one down at any time — even in those who had seemed unaffected by a nuclear disaster. Nor is this fear irrational, since delayed radiation effects can do just that. Moreover, catastrophic nuclear accidents, however infrequent, can bring about these physical and psychological consequences on a vast scale. No technological system is ever perfect, but the vulnerability of nuclear power is particularly great. Improvements in design cannot eliminate the possibility of lethal meltdowns. These may result from extreme weather; from geophysical events such as earthquakes, volcanoes, and tsunamis (such as the one that caused the Fukushima event); from technical failure; and from unavoidable human error. Climate change itself works against nuclear power; severe droughts have led to the shutting down of reactors as the surrounding waters become too warm to provide the vital cooling function.
Advocates of nuclear energy invariably downplay the catastrophic events at Fukushima and Chernobyl. They point out that relatively few immediate deaths were recorded in these two disasters, which is true. But they fail to take adequate account of medical projections. The chaos of both disasters and their extreme mishandling by authorities have led to great disparity in estimates. But informed evaluations in connection with Chernobyl project future cancer deaths at anywhere from several tens of thousands to a half-million.
Studies of Chernobyl and Fukushima also reveal crippling psychological fear of invisible contamination. This fear consumed Hiroshima and Nagasaki, and people in Fukushima painfully associated their own experiences with those of people in the atomic-bombed cities. The situation in Fukushima is still far from physically or psychologically stable. This fear also plagues Chernobyl, where there have been large forced movements of populations, and where whole areas poisoned by radiation remain uninhabitable.
The combination of actual and anticipated radiation effects — the fear of invisible contamination — occurs wherever nuclear technology has been used: not only at the sites of the atomic bombings and major accidents, but also at Hanford, Wash., in connection with plutonium waste from the production of the Nagasaki bomb; at Rocky Flats, Colo., after decades of nuclear testing; and at test sites in Nevada and elsewhere after soldiers were exposed to radiation following atomic bomb tests.
Nuclear reactors also raise the problem of nuclear waste, for which no adequate solution has been found despite a half-century of scientific and engineering effort. Even when a reactor is considered unreliable and is closed down, as occurred recently with the Pilgrim Point reactor in Plymouth, or closes for economic reasons, as at Vermont Yankee, the accumulated waste remains at the site, dangerous and virtually immortal. Under the 1982 Nuclear Waste Policy Act, the United States was required to develop a permanent repository for nuclear waste; nearly 40 years later, we still lack that repository.
Finally there is the gravest of dangers: plutonium and enriched uranium derived from nuclear reactors’ contributing to the building of nuclear weapons. Steps can be taken to reduce that danger by eliminating plutonium as a fuel, but wherever extensive nuclear power is put into use there is the possibility of its becoming weaponized. Of course, this potential weaponization makes nuclear reactors a tempting target for terrorists.
There are now more than 450 nuclear reactors throughout the world. If nuclear power is embraced as a rescue technology, there would be many times that number, creating a worldwide chain of nuclear danger zones — a planetary system of potential self-annihilation. To be fearful of such a development is rational. What is irrational is to dismiss this concern, and to insist, after the experience of more than a half-century, that a “fourth generation” of nuclear power will change everything.
Advocates of nuclear power frequently compare it to carbon-loaded coal. But coal is not the issue; it is already making its way off the world stage. The appropriate comparison is between nuclear and renewable energies. Renewables are part of an economic and energy revolution: They have become available far more quickly, extensively, and cheaply than most experts predicted, and public acceptance is high. To use renewables on the necessary scale, we will need improvements in energy storage, grid integration, smart appliances, and electric vehicle charging infrastructure. We should have an all-out national effort — reminiscent of World War II or, ironically, the making of the atomic bomb — that includes all of these areas to make renewable energies integral to the American way of life. Gas and nuclear will play a transitional role, but it is not pragmatic to bet the planet on a technology that has consistently underperformed and poses profound threats to our bodies and our minds.
Above all, we need to free ourselves of the “nuclear mystique” : the magic aura that radiation has had since the days of Marie Curie. We must question the misleading vision of “Atoms for Peace,” a vision that has always accompanied the normalization of nuclear weapons. We must free ourselves from the false hope that a technology designed for ultimate destruction could be transmogrified into ultimate life-enhancement.
References
Amy J (2021) Georgia nuclear plant cost tops $27B as more delays unveiled. Associated Press.

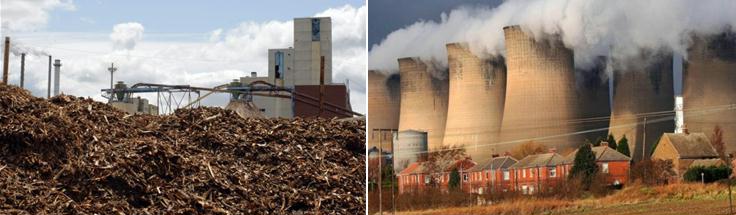
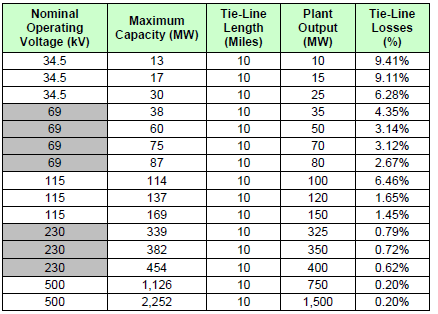 .
.