How safe are utility-scale energy storage batteries?

This image has an empty alt attribute; its file name is 2MW-AZ-battery-that-exploded.jpg

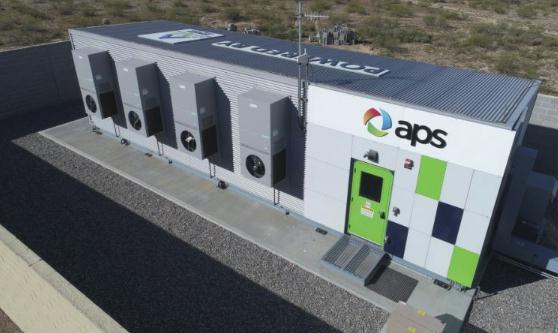
This 2 MW battery, installed by the Arizona Public Service electric company, exploded in April 2019 and sent eight firefighters and a policeman to the hospital (Cooper 2019). At least 23 South Korean lithium-ion facilities caught fire in a series of incidents dating back to August 2017 (Deign 2019).

Preface.  Airplanes can be forced to make an emergency landing if even a small external battery pack, like the kind used to charge cell phones, catches on fire (Mogg 2019). So if even a small battery pack can force an airplane to land, imagine the conflagration a gigantic utility scale storage battery might cause.

A lithium-ion battery designed to store just one day of U.S. electricity generation (11 TWh) to balance solar and wind power would be huge.  Using data from the Department of Energy (DOE/EPRI 2013) energy storage handbook, I calculated that the cost of a utility-scale lithium ion battery capable of storing 24 hours of electricity generation in the United States would cost $11.9 trillion dollars, take up 345 square miles, and weigh 74 million tons.  Though of course there’d me many of them, if each one took an acre you’d have 220,800 acres of them, and they do take up an acre or more because there’s other equipment, transmission lines, substations and more on the site.

Since at least 6 weeks of energy storage is needed to keep the grid up during times when there’s no sun or wind, you’d need to have 1,325,800 acre sites of batteries.  This storage has to come mainly from batteries, because geographically there’s very few places to put Compressed Air Energy Storage (CAES), Pumped Hydro energy storage (PHS) (and also because they both have a very low energy density), or Concentrated Solar Power with Thermal Energy Storage, with sites of 5 square miles each, in deserts. Currently natural gas is the main energy storage, always available to quickly step in when the wind dies and sun goes down, as well as provide power around the clock with help from coal, nuclear, and hydropower.

Storing large amounts of energy, whether it’s in larger rechargeable batteries, or smaller disposable batteries, can be inherently dangerous. The causes of lithium battery failure can include puncture, overcharge, overheating, short circuit, internal cell failure and manufacturing deficiencies.  Nearly all of the utility-scale batteries now on the grid or in development are massive versions the same lithium ion technology that powers cellphones and laptops. If the batteries get too hot, a fire can start and trigger a phenomenon known as thermal runaway, in which the fire feeds on itself and is nearly impossible to stop until it consumes all the available fuel.

There are several articles below about battery hazards, the main one is at the end, a summary of an 82 page Department of Energy document on this subject. Clearly containing utility scale energy batteries will be difficult:

“Thermal damage to ESS chemistries and components presents unique challenges to the fire service community, building owners, and insurers. As evidenced in full-scale testing of EV battery fires, fire suppression required more water than anticipated, and significantly more in some cases. Additionally, confirming that the fire was completely extinguished was difficult due to the containment housings of EV batteries that can mask continued thermal reaction within undamaged cells. In one of the tests performed by Exponent, Inc., one battery reignited after being involved in a full-scale fire test some 22 hours post-extinguishment; in another case, an EV experienced a subsequent re-ignition 3 weeks post-crash testing.”

In the news:

2022-9-20 Officials closed Highway 1 in both directions in Moss Landing early Tuesday morning after a fire was detected at the PG&E Elkhorn Battery Storage facility. Officials became aware of a fire in one Tesla Megapack at PG&E’s Elkhorn Battery Storage facility in Monterey County at 1:30 a.m. There is an ongoing hazardous materials incident in Moss Landing. Please shut your windows and turn off your ventilation systems. In the event of changing weather patterns, impacted areas may change, Monterey County spokeswoman Maia Carroll warned. Capt. John Hasslinger with the North County Fire Protection District said when firefighters arrived at the facility, one of the battery packs was actively burning. https://www.santacruzsentinel.com/2022/09/20/caltrans-highway-1-temporarily-closed-in-moss-landing/

Alice Friedemann  www.energyskeptic.com  Author of Life After Fossil Fuels: A Reality Check on Alternative Energy; When Trucks Stop Running: Energy and the Future of Transportation”, Barriers to Making Algal Biofuels, & “Crunch! Whole Grain Artisan Chips and Crackers”.  Women in ecology  Podcasts: WGBH, Jore, Planet: Critical, Crazy Town, Collapse Chronicles, Derrick Jensen, Practical Prepping, Kunstler 253 &278, Peak Prosperity,  Index of best energyskeptic posts

***

Larsson F et al (2017) Toxic fluoride gas emissions from lithium-ion battery fires. Scientific Reports.

https://www.nature.com/articles/s41598-017-09784-z

[Note: this paper is looking at car batteries — utility scale batteries are thousands of times larger ]

Lithium-ion battery fires generate intense heat and considerable amounts of gas and smoke. Although the emission of toxic gases can be a larger threat than the heat, the knowledge of such emissions is limited.  The risks associated with gas and smoke emissions from malfunctioning lithium-ion batteries may in some circumstances be a larger threat, especially in confined environments where people are present, such as in an aircraft, a submarine, a mine shaft, a spacecraft or in a home equipped with a battery energy storage system.This paper presents quantitative measurements of heat release and fluoride gas emissions during battery fires for seven different types of commercial lithium-ion batteries. Large amounts of hydrogen fluoride (HF) can be generated, ranging between 20 and 200 mg/Wh of nominal battery energy capacity. In addition, 15–22 mg/Wh of another potentially toxic gas, phosphoryl fluoride (POF3), was measured in some of the fire tests. Fluoride gas emission can pose a serious toxic threat and the results are crucial findings for risk assessment and management, especially for large Li-ion battery packs.

USDOE. December 2014. Energy Storage Safety Strategic Plan. U.S. Department of Energy.

Energy storage is emerging as an integral component to a resilient and efficient grid through a diverse array of potential application. The evolution of the grid that is currently underway will result in a greater need for services best provided by energy storage, including energy management, backup power, load leveling, frequency regulation, voltage support, and grid stabilization. The increase in demand for specialized services will further drive energy storage research to produce systems with greater efficiency at a lower cost, which will lead to an influx of energy storage deployment across the country. To enable the success of these increased deployments of a wide variety of storage technologies, safety must be instilled within the energy storage community at every level and in a way that meets the need of every stakeholder. In 2013, the U.S. Department of Energy released the Grid

Energy Storage Strategy , which identified four challenges related to the widespread deployment of energy storage. The second of these challenges, the validation of energy storage safety and reliability, has recently garnered significant attention from the energy storage community at large. This focus on safety must be immediately ensured to enable the success of the burgeoning energy storage industry, whereby community confidence that human life and property not

The safe application and use of energy storage technology knows no bounds. An energy storage system (ESS) will react to an external event, such as a seismic occurrence, regardless of its location in relation to the meter or the grid. Similarly, an incident triggered by an ESS, such as a fire, is ‘blind’ as to the location of the ESS in relation to the meter.

Most of the current validation techniques that have been developed to address energy storage safety concerns have been motivated by the electric vehicle community, and are primarily focused on Li-ion chemistry and derived via empirical testing of systems. Additionally, techniques for Pb-acid batteries have been established, but must be revised to incorporate chemistry changes within the new technologies. Moving forward, all validation techniques must be expanded to encompass grid-scale energy storage systems, be relevant to the internal chemistries of each new storage system and have technical bases rooted in a fundamental-scientific understanding of the mechanistic responses of the materials.

Introduction

Grid energy storage systems are “enabling technologies”; they do not generate electricity, but they do enable critical advances to modernize the electric grid. For example, there have been numerous studies that have determined that the deployment of variable generation resources will impact the stability of grid unless storage is included.5 Additionally, energy storage has been demonstrated to provide key grid support functions through frequency regulation.6 The diversity in the performance needs and deployment environments drive the need of a wide array of storage technologies.

Often, energy storage technologies are categorized as being high-power or high-energy. This division greatly benefits the end user of energy storage systems because it allows for the selection of a technology that fits an application’s requirements, thus reducing cost and maximizing value. Frequency regulation requires very rapid response, i.e. high-power, but does not necessarily require high energy. By contrast, load-shifting requires very high-energy, but is more flexible in its power needs. Uninterruptible power and variable generation integration are applications where the needs for high-power versus high-energy fall somewhere in between the aforementioned extremes. Figure 1 shows the current energy storage techniques deployed onto the North American grid.7 This variety in storage technologies increases the complexity in developing a single set of protocols for evaluating and improving the safety of grid storage technologies and drives the need for understanding across length scales, from fundamental materials processes through full scale system integration. 5 Denholm, Paul; Ela, Erik; Kirby, Brendan; Milligan, Michael.

Figure 1. Percentage of Battery Energy Storage Systems Deployed8 Lithium Iron Total Megawatt PercentagePhosphate 4.84% Flow Other 2.62% 14.38% Lead acid 28.20% Sodium sulfur 8.17% Lithium ion 41.79%

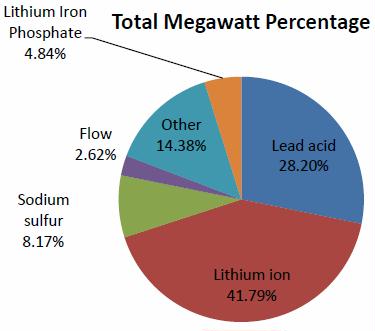
Figure 1. Percentage of Battery Energy Storage Systems Deployed.

The variety of deployment environments and application spaces compounds the complexity of the approaches needed to validate the safety of energy storage systems. The difference in deployment environment impacts the safety concerns, needs, risk, and challenges that affect stakeholders. For example, an energy storage system deployed in a remote location will have very different potential impacts on its environment and first responder needs than a system deployed in a room in an office suite, or on the top floor of a building in a city center. The closer the systems are to residences, schools, and hospitals, the higher the impact of any potential incident regardless of system size.

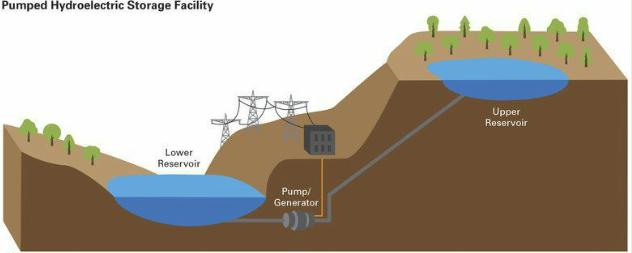
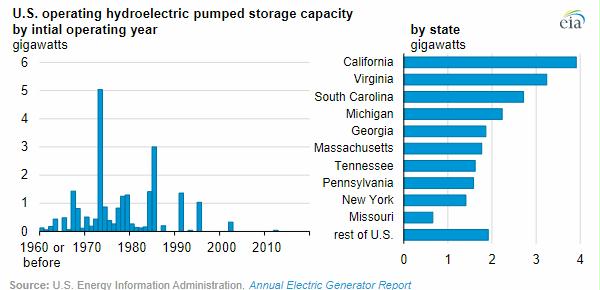
Pumped hydro is one of the oldest and most mature energy storage technologies and represents 95% of the installed storage capacity. Other storage technologies, such as batteries, flywheels and others, make up the remaining 5% of the installed storage base, are much earlier in their deployment cycle and have likely not reached the full extent of their deployed capacity.

Though flywheels are relative newcomers to the grid energy storage arena, they have been used as energy storage devices for centuries with the earliest known flywheel being from 3100 BC Mesopotamia. Grid scale flywheels operate by spinning a rotor up to tens of thousands of RPM storing energy in a combination of rotational kinetic energy and elastic energy from deformation of the rotor. These systems typically have large rotational masses that in the case of a catastrophic radial failure need a robust enclosure to contain the debris. However, if the mass of the debris particles can be reduced through engineering design, the strength, size and cost of the containment system can be significantly reduced.

As electrochemical technologies, battery systems used in grid storage can be further categorized as redox flow batteries, hybrid flow batteries, and secondary batteries without a flowing electrolyte. For the purposes of this document, vanadium redox flow batteries and zinc bromine flow batteries are considered for the first two categories, and lead-acid, lithium ion, sodium nickel chloride and sodium sulfur technologies in the latter category. As will be discussed in detail in this document, there are a number of safety concerns specific to batteries that should be addressed, e.g. release of the stored energy during an incident, cascading failure of battery cells, and fires.

A reactive approach to energy storage safety is no longer viable. The number and types of energy storage deployments have reached a tipping point with dramatic growth anticipated in the next few years fueled in large part by major, new, policy-related storage initiatives in California14, Hawaii15, and New York. The new storage technologies likely to be deployed in response to these and other initiatives are maturing too rapidly to justify moving ahead without a unified scientifically based set of safety validation techniques and protocols. A compounding challenge is that startup companies with limited resources and experience in deployment are developing many of these new storage technologies. Standardization of the safety processes will greatly enhance the cost and viability of new technologies, and of the startup companies themselves. The modular nature of ESS is such that there is just no single entity clearly responsible for ESS safety; instead, the each participant in the energy storage community has a role and a responsibility. The following sections outline the gaps in addressing the need for validated grid energy storage system safety.

To date, the most extensive energy storage safety and abuse R&D efforts have been done for Electric Vehicle (EV) battery technologies. These efforts have been limited to lithium ion, lead-acid and nickel metal hydride chemistries and, with the exception of grid-scale lead-acid systems, are restricted to smaller size battery packs applicable to vehicles.

The increased scale, complexity, and diversity in technologies being proposed for grid- scale storage necessitates a comprehensive strategy for adequately addressing safety in grid storage systems. The technologies deployed onto the grid fall into the categories of electro-chemical, electromechanical, and thermal, and are themselves within different categories of systems, including CAES, flywheels, pumped hydro and SMES. This presents a significant area of effort to be coordinated and tackled in the coming years, as a number of gap areas currently exist in codes and standards around safety in the field. R&D efforts must be coordinated to begin to address the challenges.

An energy storage system can be categorized primarily by its power, energy and technology platform. For grid-scale systems, the power/energy spectrum spans from smaller kW/kWh to large MW/MWh systems. Smaller kW/kWh systems can be deployed for residential and community storage applications, while larger MW/MWh systems are envisioned for electric utility transmission and distribution networks to provide grid level services. This is in contrast to electric vehicles, for which the U.S. Advanced Battery Consortium (USABC) goals are both clearly defined and narrow in scope with an energy goal of 40 kWh. While in practice some EV packs are as large as 90 kWh, the range of energy is still small compared with the grid storage applications. This research is critical to the ability of first responders to understand the risks posed by ESS technologies and allow for the development of safe stratagies to minimize risk and mitigate the event.

Furthermore, the diversity of battery technologies and stationary storage systems is not generally present in the EV community. Therefore, the testing protocols and procedures used historically and currently for storage systems for transportation are insufficient to adequately address this wide range of storage systems technologies for stationary applications. Table 1 summarizes the high level contrast between this range of technologies and sizes of storage in the more established area of EV. The magnitude of effort that must be taken on to encompass the needs of safety in stationary storage is considerable because most research and development to improve safety and efforts to develop safety validation techniques are in the EV space. Notably, the size of EV batteries ranges by a factor of two; by contrast, stationary storage scales across many orders of magnitude. Likewise, the range of technologies and uses in stationary storage are much more varied than in EV. Therefore, while the EV safety efforts pave the way in developing R&D programs around safety and developing codes and standards, they are highly insufficient to address many of the significant challenges in approaching safe development, installation, commissioning, use and maintenance of stationary storage systems.

An additional complexity of grid storage systems is that the storage system can either be built on-site or pre-assembled, typically in shipping containers. These pre-assembled systems allow for factory testing of the fully integrated system, but are exposed to potential damage during shipping. For the systems built on site, the assembly is done in the field; much of the safety testing and qualification could potentially be done by local inspectors, who may or may not be as aware of the specifics of the storage system. Therefore, the safety validation of each type of system must be approached differently and each specific challenge must be addressed.

Batteries and flywheels are currently the primary focus for enhanced grid-scale safety. For these systems, the associated failure modes at grid-scale power and energy requirements have not been well characterized and there is much larger uncertainty around the risks and consequences of failures. This uncertainty around system safety can lead to barriers to adoption and market success, such as difficulty with assessing value and risk to these assets, and determining the possible consequences to health and the environment. To address these barriers, concerted efforts are needed in the following areas: • Materials Science R&D – Research into all device components • Engineering controls and system design • Modeling • System testing and analysis • Commissioning and field system safety research It is a notable challenge within the areas outlined above to develop understanding and confidence in relating results at one scale to expected outcomes at another scale, or predicting the interplay between components, as well as protecting against unexpected outcomes when one or more failure mode is present at the same time in a system. Extensive research, modeling and validation are required to address these challenges. Furthermore, it is necessary to pool the analysis approaches of failure mode and effects analysis (FMEA) and to use a safety basis in both research and commissioning to build a robust safety program. Furthermore, identifying, responding and mitigating to any observed safety events are critical in validating the safety of storage.

A holistic view with regard to setting standards to ensure thorough safety validation techniques is the desired end goal; the first step is to study on the R&D level failure from the cell to system level, and from the electrochemistry and kinetics of the materials to module scale behavior. Detailed hazards analysis must be conducted for entire systems in order to identify failure points caused by abuse conditions and the potential for cascading events, which may result in large scale damage and/or fire. While treating the storage system as a “black box” is helpful in setting practical standards for installation, understanding the system at the basic materials and chemistry levels and how issues can initiate failure at the cell and system level is critical to ensure overall system safety.

Batteries, understanding the fundamental electrochemistry and materials changes under selected operating conditions helps guide the cell level safety. Knowledge of cell-level failure modes and how they propagate to battery packs guides the cell chemistry, cell design and integration. Each system has different levels of risk associated with basic electrochemistry that must be understood; the trade-off between electrochemical performance and safety must be managed. There are some commonalities of safety issues between storage technologies. For example, breeching of a Na/S (NAS) or Na/NiCl2 (Zebra) battery could result in exposure of molten material and heat transfer to adjacent cells. Evolution of H2 from lead-acid cells or H2 and solvent vapor from lithium-ion batteries during overcharge abuse could results in a flammable/combustible gas mixture. Thermal runaway in lithium-ion (Li-ion) cells could transfer heat to adjacent cells and propagate the failure through a battery.

Moreover, while physical hazards are often considered, health and environmental safety issues also need to be evaluated to have a complete understanding of the potential hazards associated with a battery failure. These may include the toxicity of gas species evolved from a cell during abuse or when exposed to abnormal environments,  toxicity of electrolyte during a cell breech or spill in a Vanadium redox flow battery (VRB), environmental impact of water runoff used to extinguish a battery fire containing heavy metals. Flywheels provide an entirely different set of considerations, including mechanical containment testing and modeling, vacuum loss testing, and material fatigue testing under stress.

The topic of Li-ion battery safety is rapidly gaining attention as the number of battery incidents increases. Recent incidents, such as a cell phone runaway during a regional flight in Australia and a United Parcel Service plane crash near Dubai, reinforce the potential consequence of Liion battery runaway events. The sheer size of grid storage needs and the operational demands make it increasingly difficult to find materials with the necessary properties, especially the required thermal behavior to ensure fail-proof operation. The main failure modes for these battery systems are either latent (manufacturing defects, operational heating, etc.) or abusive (mechanical, electrical, or thermal).

Any of these failures can increase the internal temperature of the cell, leading to electrolyte decomposition, venting, and possible ignition. While significant strides are being made, major challenges remain in combating solvent flammability still remain, which is the most significant area that needs improvement to address safety of Li-ion cells, and is therefore discussed here in greater detail. To mitigate thermal instability of the electrolyte, a number of different approaches have been developed with varied outcomes and moderate success. Conventional electrolytes typically vent flammable gas when overheated due to overcharging, internal shorting, manufacturing defects, physical damage, or other failure mechanisms. The prospects of employing Li-ion cells in applications depend on substantially reducing the flammability, which requires materials developments (including new lithium salts) to improve the thermal properties. One approach is to use fire retardants (FR) in the electrolyte as an additive to improve thermal stability. Most of these additives have a history of use as FR in the plastics industry. Broadly, these additives can be grouped into two categories—those containing phosphorous and that containing fluorine. A concerted effort to provide a hazard assessment and classification of the event and mitigation when an ESS fails, either through internal or external mechanical, thermal, or electrical stimulus is needed by the community.

Electrolyte Safety R&D The combustion process is a complex chemical reaction by which fuel and an oxidizer in the presence of heat react and burn. Convergence of heat (an oxidizer) and fuel (the substance that burns) must happen to have combustion. The oxidizer is the substance that produces the oxygen so that the fuel can be burned, and heat is the energy that drives the combustion process. In the combustion process a sequence of chemical reactions occur leading to fire.41 In this situation a variety of oxidizing, hydrogen and fuel radicals are produced that keep the fire going until at least one of the three constituents is exhausted.

5.4.1 Electrolytes Despite several studies on the issue of flammability, complete elimination of fire in Li-ion cells has yet to be achieved. One possible reason for the failure could be linked to lower flash point (FP) (<38.7 °C) of the solvents.42 Published data shows that polyphosphazene polymers and ionic liquids used as electrolytes are nonflammable.43 However, the high FP of these chemicals is generally accompanied by increased viscosity, thus limiting low temperature operation and degrading cell performance at sub-ambient temperatures. These materials may also have other problems such as poor wetting of the electrodes and separator materials, excluding them from use in cells despite being nonflammable. Ideally, solvents would be used that have no FP while simultaneously exhibiting ideal electrolyte behavior (see below for a number of critical properties that the electrolytes need to meet) and would remain liquid at low temperatures down to -50 ºC or below for use in Li-ion cells. A number of critical electrochemical and thermal properties are given below that FR have to meet simultaneously. The tradeoffs between properties are possible but when it comes to safety there cannot be tradeoffs. • High voltage stability • Comparable conductivity to traditional electrolytes • Lower flame propagation rate or no fire at all • Lower self-heating rate • Stable against both the electrodes • Able to wet the electrodes and separator materials • Higher onset temperature for exothermic peaks with reduced overall heat production • No miscibility problems with co-solvents

The higher energy density of Li-ion cells can only result in a more volatile device, and while significant efforts have been put forth to address safety, significant research is still needed. To improve safety of Li-ion batteries, the electrolyte flammability needs significant advances or further mitigation is needed in areas that will contain the effects of failures to provide graceful failures with safer outcomes in operation.

Electrodes, separators, current collectors, casings, cell format headers and vent ports While electrolytes are by far the most critical component in Li-ion battery safety, research has been pursued into safety considerations around the other components of the cell. These factors can become more critical as research continues in wider ranges of chemistries for stationary storage.

Capacitors Electrostatic capacitors are a major failure mechanism in power electronics. These predominately fail because of the strong focus on low cost devices, and low control over manufacturing. In response, they are used at a highly de-rated level, and often with redundant design. When they fail they often show slow degradation with decreasing resistivity leading eventually to shorting. Cascading failures can lead to higher consequence failures elsewhere in a system. Arcs or cascading failures can occur. The added complexity of redundant design is a safety risk. While there is a niche market for high reliability capacitors, they are not economically viable for most applications, including grid storage. These devices are made of precious metals and higher quality ceramic processing that leads to fewer oxygen vacancies in the device.

Polymer capacitors can have a safety advantage as they can be self-healing, and therefore graceful failure; however these are poor performers at elevated temperatures and are flammable.

Currently, the low cost and low reliability of capacitors make them a very common component that fails in devices, affecting the power electronics and providing a possible trigger for a cascading failure. While improved reliability has been achieved in capacitors such devices are cost prohibitive due to their manufacturing and testing. Development of improved capacitors at reasonable cost, or design to prevent cascading failures in the event of capacitor failure should be addressed.

Pumps tubing and tanks Components specific to flow battery, and hybrid flow battery technologies have not been researched in the context of safety for battery technology. These include components such as pumps, tubing and storage tanks. Research from other areas that use similar components can be a starting point, but these demonstrate how the range of components is much broader than current R&D in battery safety.

Manufacturing defects The design of components and testing depends on understanding the range of purity in materials, and conformity in engineering. Defects are a large contributor to shorts in batteries for example. Understanding the reproducibility among parts, and the influence of defects on failure is critical to understanding and designing for safer storage systems.

The science of fault detection within large battery systems is still within its infancy; most analysis and monitoring of large battery systems is focused on monitoring issues such as state of health and state of charge monitoring, however limited work has been performed. Offer et al.53 first

Software Analytics. In this day and age of information technology, any comprehensive research, development, and deployment strategy for energy storage should be rounded out with an appropriate complement of software analytics. Software is on a par with hardware in importance, not only for engineering controls, but for performance monitoring; anomaly detection, diagnosis, and tracking; degradation and failure prediction; maintenance; health management; and operations optimization. Ultimately, it will become an important factor in improving overall system and system-of-systems safety. As with any new, potentially high consequence technology, improving safety will be an ongoing process. By analogy with airline safety, energy storage projects which use cutting-edge technologies would benefit from “black boxes” to record precursors to catastrophic failures. The black boxes would be located off-site and store minutes to months of data depending on the time scale of the phenomena being sensed. They would be required for large-scale installations, recommended for medium-scale installations, and optional for small installations. Evolving standards for what and how much should be recorded will be based on the results from research as well as experience.

Since some energy storage technologies are still early in their development and deployment, there should be an emphasis on developing safety cases. Safety cases should cover the full range of safety events that could reasonably be anticipated, and would therefore highlight the areas in which software analytics are required to ensure the safety of each system. Each case would tell a story of an initiating event, an assessment of its probability over time, the likely subsequent events, and the likely final outcome or outcomes. The development of safety cases need not be onerous, but they should demonstrate to everyone involved that serious thought has been given to safety.

Table 2. Common Tests to Assess Risk from Electrical, Mechanical, and Environmental Conditions55 Condition Electrical Mechanical Environmental Tests under development Tests Test of current flow Abnormal charging test, overcharging and charging time Forced discharge test Crush test Impact test Shock test Vibration test Heating test Temperature cycling test Low pressure altitude test Failure propagation Internal short circuit (non-impact test) Ignition/flammability IR absorption diagnostics Separator testing

The established tests for electrical, mechanical and environmental conditions are therefore tailored to identifying and quantifying the consequence and likelihood of failure in lead-acid and lithium ion technologies with typical analyses that include burning characteristics, off-gassing, smoke particulates, and environmental run off from fire suppression efforts. Even for the most studied abuse case of lithium ion technologies, some tests have been identified as very crude or ineffective with limited technical merit. For example, the puncture test, used to replicate failure under an internal short, is widely believed to lack the ability to accurately to mimic this particular failure mode. These tests are less likely to reproduce potential field failures when applied to technologies for which they were not originally designed. The above testing relates exclusively to cell/pack/module level and does not take into consideration the balance of the storage system. Other tests on Li-ion system are targeted at invoking and quantifying specific events; for example, impact testing and overcharging tests probe the potential for thermal runaway which occurs during anode and cathode decomposition reactions. Other failure modes addressed by current validation techniques include electrolyte flammability, thermal stability of materials including the separators, electrolyte components and active materials, and cell-to-cell failure.

Gap areas and opportunities An energy storage system deployed on the grid, whether at the residential (<10kW) or bulk generation scale on the order of MW, is susceptible to similar failures as described above for Li-ion. However, given the multiple chemistries and application space, there is a significant gap in our ability to understand and quantify potential failures under real-world conditions; in order to ensure safety as grid storage systems are deployed, it is critical to understand their potential failure modes within each deployment environment. Furthermore, it must be considered that grid-scale systems include at the very least: power electronics, transformers, switchgear, heating and cooling systems and housing structures or enclosures. The size and the variety of technologies necessitate a rethinking of safety work as it is adopted from current validation techniques in the electrified vehicle space. 

To address the component and system level safety concerns for all the technologies being developed for stationary energy storage, further efforts will be required to: understand these systems at the fundamental materials science, develop appropriate engineering controls, fire protection and suppression methods, system design, complete validation testing and analysis, and establish real world based models for operating. System level safety must also address several additional factors including the relevant codes, standards and regulations, the needs of first responders, and anticipate risks and consequences not covered by current CSR. The wide range of chemistries and operating conditions required for grid-scale storage presents a significant challenge for safety R&D. The longer life requirements and wider range of uses for storage require a better understanding of degradation and end of life failures under normal operating and abuse conditions. The size of batteries also necessitates a stronger reliance on modeling. Multi-scale models for understanding thermal runaway, and fire propagation; whether originated in the chemistry, the electronics, or external to the system; have not been developed. Currently gap areas for stationary energy storage exist from materials research and modeling through system life considerations such as operation and maintenance.

Engineering controls and system design. Currently the monitoring needs of batteries, as well as effectiveness of means to separate battery cells and modules, or various fire suppression systems and techniques in systems have not been studied extensively. Individual companies and installations have relied on past experience in designing these systems. For example: Na battery installations have focused on mitigating the potential impact of the high operating temperature, Pb-acid batteries has focused on controlling failures associated with hydrogen build up, while in technologies that don’t use electrochemistry like flywheels, have focused on mechanical concerns such as run-out and high temperature, or change in chamber pressure. Detailed testing and modeling are required to fully understand the needs in system monitoring and containment of failure propagation. Rigorous design of safety features that adequately address potential failures are also still needed in most technology areas. Current efforts have widely focused on monitoring cell and module level voltages in addition to the thermal environment; however the tolerances for safe operation are not known for these systems. Further development efforts are needed to help manufacturers and installers understand the appropriate level of monitoring in order to safely operate a system and prevent failure resulting from internal short circuits, latent manufacturing defects or abused batteries from propagating to the full system.

Modeling The size and cost of grid-scale storage system make it prohibitive to test full-scale systems, modeling can play a critical role in improved safety.

Fire suppression Large-scale energy storage systems can mitigate risk of loss by isolating parts of a system in different transportation containers, or using materials or assemblies to section off batteries. Most current systems have automated and manually triggered fire suppression systems within the enclosure but have limited knowledge if such suppression systems will be useful in the event of fire.

The interactions between fire suppressants and system chemistries must be fully understood to determine the effectiveness of fire suppression. Key variables include the: volume of suppressant required, rate of suppressant release, and distribution of suppressants. Basic assumptions about electrochemical safety have not been elucidated, for example it is not even clear whether a battery fire is of higher consequence than other types of fires, and if so at what scale this is of concern.

The National Fire Protection Association (NFPA) has provided a questionnaire regarding suppressants for vehicle batteries. Tactics for suppression of fires involving electric-drive vehicle (EDV) batteries: a. How effective is water as a suppressant for large battery fires? b. Are there projectile hazards? c. How long must suppression efforts be conducted to place the fire under control and then fully extinguish it? d. What level of resources will be needed to support these fire suppression efforts? 1 e. Is there a need for extended suppression efforts? f. What are the indicators for instances where the fire service should allow a large battery pack to burn rather than attempt suppression?

NFPA 13, Standard for the Installation of Sprinkler Systems,60 does not contain specific sprinkler installation recommendations or protection requirements for Li-ion batteries. Reports and literature on suppressants universally recommended the use of water.61 However, the quantity of water needed for a battery fire is large: 275-2639 gallons for a 40 kWh EV sized Liion battery pack. This is higher than recommended for internal combustion engine (ICE) vehicle fires.

Summary. Science-based safety validation techniques for an entire energy storage system are critical as the deployments of energy storage systems expand. These techniques are currently based on previous industry knowledge and experience with energy storage for vehicles, as well as experience with grid-scale Pb-acid batteries. Now, they must be broadened to encompass gridscale systems. The major hurtle to this expansion is encompassing both much broader range in scale stationary storage systems, as well as the much broader range of technologies. Furthermore, the larger scale of stationary storage over EV storage necessitates the consideration of a wider range of concerns, beyond the storage device. This includes areas such as power electronics and fire suppression. The required work to develop validation is significant. As progress is made in understanding validation through experiment and modeling, these evidence-based results can feed into codes, regulations and standards, and can inform manufacturers and customers of stationary storage solutions to improve the safety of deployed systems.

Currently, fire departments do not categorize ESS as stand-alone infrastructure capable of causing safety incidents independent of the systems that they support. Instead, fire departments categorize grid ESS as back-up power systems such as uninterruptible power supplies (UPS) for commercial, utility, communications and defense settings, or as PV battery-backed systems for on, or off-grid residential applications. This categorization results in limited awareness of ESS and their potential risks, and thus the optimal responses to incidents. This categorization of energy storage systems as merely back-up power systems also results in the treatment of ESS as peripheral to the risk management tools.

The energy storage industry is rapidly expanding due to market pressures. This expansion is surpassing both the updating of current CSR and development of new CSR needed for determining what is and is not safe and

No general, technology-independent standard for ESS integration into a utility or a stand-alone grid has yet been developed.

Incident responses with standard equipment are tailored to the specific needs of the incident type and location, whether it’s two “pumper” engines and a “ladder” truck with two to four personnel, plus a Battalion Chief to act as Incident Commander, for a total of 9 to 13 personnel responding to an injury/accident, or a structure fire that requires five engines, two trucks, and two Battalion Chiefs for a total of 17 to 30 personnel. With each additional “alarm” struck will send another two to three “pumper” engines and a “ladder” truck. In all of these cases, the incident response personnel typically arrive on scene with only standard equipment. This equipment is guided by various NFPA standards for equipment on each apparatus, personal protective equipment (PPE), and other rescue tools. In responding to an ESS incident, the fire service seldom incorporates equipment specialized for electrical incidents.

A number of unique challenges must be considered in developing responses to any energy storage incident. In particular, difficulties securing energized electrical components can present significant safety challenges for fire service personnel. Typically, the primary tasks are to isolate power to the affected areas, contain spills, access and rescue possible victims, and limit access to the hazard area. The highest priority is given to actions that support locating endangered persons and removing them to safety with the least possible risk to responders. Where the rescue of victims continues until it is either accomplished or determined that there are no survivors or the risk to responders is too great. Industrial fires can be quite dangerous depending on structure occupancy, i.e. the contents, process, and personnel inside. Water may be used from a safe distance on larger fires that have extended beyond the original equipment or area of origin, or which are threatening nearby exposures; however, determination of “safe” distance has been little researched by the fire service scientific community.

Fire suppression and protection systems. Each ESS installation is guided by application of existing CSR that may not reflect the unique and varied chemistries in use. Fire-suppressant selection should be based on the efficacy of specific materials and needed quantities on site based on appropriate and representative testing, conducted in consultation with risk managers, fire protection engineers, and others, as well as alignment with existing codes and standards. For example, non-halogenated inert gas discharge systems may not be adequate for thermally unstable oxide chemistries, as they generate oxides in the process of heating, which may lead to combustion in oxygen deficient atmospheres. Ventilation requirements imposed by some Authorities Having Jurisdiction (AHJs) may work against the efficacy of these gaseous suppression agents. Similarly, water-based sprinkler systems may not prove effective for dissipating heat dissipation in large-scale commodity storage of similar chemistries. Therefore, additional research is needed to provide data on which to base proper agent selection for the occupancy and commodity, and to establish standards that reflect the variety of chemistries and their combustion profile.

Current commodity classification systems used in fire sprinkler design (NFPA 13-Standard for Installation of Sprinkler Systems) do not have a classification for lithium or flow batteries. This is problematic, as the fire hazard may be significantly higher depending on the chemicals involved and will likely result in ineffective or inaccurate fire sprinkler coverage. Additionally, thermal decomposition of electrolytes may produce flammable gasses that present explosion risks.

Verification and control of stored energy. Severe energy storage system damage resulting from fire, earthquake, or significant mechanical damage may require complete discharge, or neutralization of the chemistry, to facilitate safe handling of components. Though the deployment of PV currently exceeds that of ESS, there is still a lack of a clear response procedure to de-energize distributed PV generation in the field. Fire fighters typically rely on the local utility to secure supply-side power to facilities.

In the case of small residential or commercial PV, the utility is not able to assist because the system is on the owner side of the meter, which presents a problem for securing a 600Vdc rooftop array. Identifying the PV integrators responsible for installation may not be possible, and other installers may be hesitant to assume any liability for a system they did not install. This leaves a vacuum for the safe, complete overhaul of a damaged structure with PV. Similarly, ESS faces the complication of unclear resources for assistance and the inabilities of many first responders to knowledgably verify that the ESS is discharged or de-energized.

Post-incident response and recovery. Thermal damage to ESS chemistries and components presents unique challenges to the fire service community, building owners, and insurers. As evidenced in full-scale testing of EV battery fires, fire suppression required more water than anticipated, and significantly more in some cases. Additionally, confirming that the fire was completely extinguished was difficult due to the containment housings of EV batteries that can mask continued thermal reaction within undamaged cells. In one of the tests performed by Exponent, Inc., one battery reignited after being involved in a full-scale fire test some 22 hours post-extinguishment; in another case, an EV experienced a subsequent re-ignition 3 weeks post-crash testing.

Governmental approvals and permits related to the siting, construction, development, operation, and grid integration of energy storage facilities can pose significant hurdles to the timely and cost effective implementation of any energy storage technology. The process for obtaining those approvals and permits can be difficult to navigate, particularly for newer technologies for which the environmental, health, and safety impacts may not be well documented or understood either by the agencies or the public.

References

Cooper, J. 2019.  Arizona fire highlights challenges for energy storage. Associated Press.

Deign, J. 2019.  The Safety Question Persists as Energy Storage Prepares for Huge Growth. Recent battery plant blazes and a hydrogen station blast have again raised questions about the safety of energy storage technologies.  greentechmedia.com

DOE/EPRI. 2013. Electricity storage handbook in collaboration with NRECA. USA: Sandia National Laboratories and Electric Power Research Institute.

Mogg, T. 2019. Battery pack suspected cause of recent Virgin Atlantic aircraft fire.  Digitaltrends.com

Posted in Batteries, Lithium-ion, Safety | Tagged , , , , , , | Comments Off on How safe are utility-scale energy storage batteries?

Scientists on where to be in the 21st century based on sustainability

Source: Shaw 2020, Xu 2020 The greater the climate change the more this zone moves North

Preface. The article below is based on Hall & Day’s book “America’s Most Sustainable Cities and Regions: Surviving the 21st Century Megatrends”.

Related articles:

Alice Friedemann www.energyskeptic.com  author of “When Trucks Stop Running: Energy and the Future of Transportation”, 2015, Springer, Barriers to Making Algal Biofuels, and “Crunch! Whole Grain Artisan Chips and Crackers”. Podcasts: Derrick Jensen, Practical Prepping, KunstlerCast 253, KunstlerCast278, Peak Prosperity , XX2 report

***

Day, J. W., et al. Oct 2013. Sustainability and place: How emerging mega-trends of the 21st century will affect humans and nature at the landscape levelEcological Engineering.

Five scientists have written a peer-reviewed article about where the best and worst places will be in the future in America based on how sustainable a region is when you take into account climate change, energy reserves, population, sea-level rise, increasingly strong hurricanes, and other factors.  Three of the scientists, John W. Day, David Pimentel, and Charles Hall, are “rock stars” in  ecology.

Below are some excerpts from this 16 page paper that I found of interest (select the title above to see the full original paper).

Best places to be

WhereToBe Day2013 good places greenestThe greener the better — unless there are too many people (circles indicate large cities).  modified from U.S. EPA (2013)


where to be day 2013 best is underperforming now


Move to an Under-performing Region (and away from a Mega-region): Many areas rich in natural resources often have high poverty rates, perhaps due to “the resource curse”, usually applied internationally to countries rich in fossil fuels, agriculture, forestry, and fisheries, but financially poor with stratified social classes. We believe this concept can be applied to states. You can see above that most under-performing counties are rural. These are regions that have not kept pace with national trends over the last 3 decades in terms of population, employment, and wages. Note that with the exception of the Great Lakes mega-region, the under-performing regions are outside of the 11 mega-regions. These underperforming areas generally have high natural resources and agricultural production.

Worst Places to Be

Worst places to be

Several areas of the U.S. will have compromised sustainability in the 21st century. These include the southern Great Plains, the Southwest, the southern half of California, the Gulf and Atlantic coasts, especially southern Louisiana and Southern Florida, and areas of dense population such as south Florida and the Northeast.

where to be day 2013 not in megaregions

[My comment: You should also consider how long forests will last in your area, people will be burning them to cook and heat their homes with, and eventually make furniture, homes, floors, spoons, and hundreds of other objects as shown in the FoxFire series.  There were 92 million people in 1920, just 29% of the population we have now.  To zero in on the details, see this account of what happened in Vermont]

forest virgin growth 1620 1850 1920

Avoid the large megaregions.

Future Trends

The trends of energy scarcity, climate change, population, and many other factors are likely to reduce the sustainability of the landscape humans depend on, in some places more than others, since materials and energy both limited and distributed unevenly.

Industrial agriculture is very energy intensive: 19% of the total energy use in the U.S.

14% of that is Agricultural production, food processing and packaging, 5% for transportation and preparation.

  • Each American uses 528 gallons/year in oil equivalents to supply their food, or 169 billion gallons for 320 million Americans.
  • About 33% of the energy required to produce 2.5 acres of crops is invested in machine operation.
  • On average, nearly 10 calories of energy are used to make 1 calorie of edible food.
  • Cropland provides 99.7% of the global human food supply (measured in calories) with less than 1% coming from the sea.
  • Global per capita use is      .50 acre for cropland and 1.25 acres of pasture land
  • The U.S. and Europe use 1.25 acres of cropland and 2     acres  of pasture land
  • Crop-land now occupies 17% of the total land area in the U.S., but little additional land is available or even suitable for future agricultural expansion.
  • As the U.S. population increases, climate impacts grow, and energy resources decrease, there will be less cropland area per capita.
  • A significant portion of food produced in the U.S. is irrigated and located in areas where water shortages will increase.

Agricultural land

  • 1950:   1,250,000,000 acres
  • 2000:      943,000,000 acres – down 21.5% from 1950

…………Acres              States (cropland is unequally distributed)

  • 508,000,000    N & S Dakota, Nebraska, Kansas, Oklahoma, Texas, New Mexico,                         Colorado, Montana, Wyoming
  • 135,700,000    Ohio, Indiana, Illinois, Wisconsin, Minnesota, Iowa, Missouri
  •   27,800,000    California (50% of vegetables, fruits, and nuts in USA

Crops need a lot of water.  Some use 265 to to 530 gallons of water per 2.2 pounds of crops produced (dry matter).  Corn needs 10 million liters per hectare, soybeans 6 million L/ha fora yield of 3.0 tons/ha. Wheat requires only about 2.4 million L/ha for a yield of 2.7 t/ha. Under semiarid conditions, yields of non-irrigated crops, such as corn, are low (1.0 t/ha to 2.5 t/ha) even when ample amounts of fertilizer are applied. Approximately 40% of water use in the United States is used solely for irrigation. Reducing irrigation dependence in the U.S. would save significant amounts of energy, but probably require that crop production shift from the dry and arid western regions to the more agriculturally suitable eastern U.S.

Why Cities will be Bad Places to be

The cities most dependent on cheap energy will be the most affected (especially the Southwest and southern great plains)

U.S. population increased steadily from 3.9 million in 1790 to nearly 310 million in 2010 (or almost 8,000% in just 220 years, an exponential growth rate of almost 2%). Life also became progressively more urbanized and by 2010, 259 million people or 83% lived in urban areas compared to 56 million in rural areas.

The maintenance of large urban megaregions requires enormous and continuous inputs of energy and materials. Modern industrial society and modern cities are inherently unsustainable.

Some have argued that large urban areas are more energy efficient than rural areas (Dodman, 2009). But Fragkias (2013) examined the relation between city size and greenhouse gas emissions and found that emissions scale proportionally with urban population size for U.S. cities and that larger cities are not more emissions efficient than smaller ones. In a review of energy and material flows through the world’s 25 largest urban areas, Decker(2000) also concluded that large urban areas are only weakly dependent on their local environment for energy and material inputs but are constrained by their local areas for supplying water and absorbing wastes. Rees  contends that if cities are to be sustainable in the future, they must rebalance production and consumption, abandon growth, and re-localize. The trajectory of megatrends of the 21st century will make this difficult for all large urban regions in the U.S. and impossible for some.

By 2025, it is estimated that 165 million people, or about half the population, will live in 4 megaregions; the Northeast, Great Lakes, Southern California, and San Francisco Bay regions. An additional 45 million will live in south Florida and the Houston-Dallas region. The supply lines that support these megaregions with food, energy, and other materials stretch for long distances across the landscape. Areas dependent on longer, energy intensive supply lines are vulnerable to the rising costs of energy for transportation.

The economies of urban areas, especially the currently most economically successful ones based on the human, financial, and information service sectors, are strongly dependent on the spending of discretionary income, which is predicted to decrease substantially over the 21st century.

Best cities to live in

But many cities have lost population, especially those that were based in the manufacturing sector of the economy during the 20th century. Detroit and Flint, Michigan, are often cited as examples but there are many others. Between 1950 and 2000, St. Louis lost 59% of its population. Pittsburgh, Buffalo, Detroit, and Cleveland lost more than 45% each. It is possible that many of the rust belt cities that have experienced population decreases will be more sustainable than more “successful” cities in the northeast and other areas. They now have a lower population density and tend to exist in rich agricultural regions. Indeed, abandoned land is being used for food production in a number of depopulating cities.

Worst cities to live in

By contrast, the northeast is the most densely populated region of the country. The population is expected to reach almost 60 million by 2025. The states that make up the region have about 34 million acres of farmland or about 0.2 ha per person. By contrast, it takes about 1.2 ha per capita to provide the food consumed in the U.S. If agriculture becomes more local and less productive as some predict due to increasing energy costs then it will be a challenge to maintain the current food supply to the northeast.

The least sustainable region will likely be the southwestern part of the country from the southern plains to California. Climate change is already impacting this region and it is projected to get hotter and drier. Winter precipitation is predicted to be more rain and less snow. These trends will lead to less water for direct human consumption and for agriculture. This is critical since practically all agriculture in the region is irrigated. The Southwest has the lowest level of ecosystem services of any region in the U.S. California is the most populous state in the nation with most people living in the southern half of the state, the area with highest water stress. The Los Angeles metro area is the second largest in the nation. But population density is low over much of the rest of the region and is concentrated in large urban areas such as Las Vegas, Phoenix, and Albuquerque. California is one of the most important food producing states in the nation but this will be threatened by water scarcity and increasing energy costs. Much of the region is strongly dependent on tourism and spending discretionary income, especially Las Vegas, so future economic health will likely be compromised in coming decades. Many cities and regions whose economy is dependent on tourism will have compromised sustainability.

Energy scarcity

World oil production peaked in 2005 and has been on a plateau since then.

400 giant fields discovered before 1960 provide 80% of world oil.

Shale oil and gas have very high depletion rates and the production of unconventional reserves such as the Canadian and Venezuelan tar sands are extremely unlikely to be scaled up sufficiently to offset conventional decline rates.

Society depends on the surplus energy provided from the energy extraction sector for the material and energy throughput that allows for economic growth and productivity. As energy becomes more expensive to extract and produce, more money and energy that might otherwise be spent in other sectors of the economy must be spent in the energy sector, decreasing real growth (my comment: that means fewer jobs and increasing poverty)

The transition to a less oil reliant, more sustainable society in the U.S. is many decades away.

Since so much of the economy depends upon the widespread availability of cheap oil for the production and distribution of goods, the onset of peak oil and the decline in net energy available to society has profound implications for overall societal well being (my comment: this is the understatement of the year – what this means is extreme social unrest from hunger and lack of oil or natural gas to heat homes and cook with, etc)

Just as the first half of the oil age consisted of constantly increasing production, the second half of the oil age will consist of a continual rate of depletion that cannot be offset by new discoveries or low EROI alternatives.

Descriptions of regions in the article

  • Most negatively affected areas: Southwest including much of California & Southern Great Plains. All of these regions will be drier with less water at the same time population is growing.
  • decreased fresh water availability: Southern Great Plains, SouthWest (Lake Mead has a 50% chance of drying up within 2 decades)
  • Eastern half of U.S.: abundant natural resources but avoid megaregions
  • Poor soil: southwest
  • Severest climate change impacts: Southwest
  • Driest, hottest, most extreme droughts and floods: Southwest
  • Most tree deaths, super forest fires, loss of species, dust: Southwest
  • Snow melting too fast: West Coast – fewer crops, especially California which grows 1/3 of America’s food
  • Flooding: Mississippi basin due to more intense storms in the future
  • Rising sea level: coastal zones
  • stronger hurricanes: Gulf and Atlantic coasts from warming surface waters of the oceans. Hurricanes are also expected to become more frequent.
  • Hurricane surge: Gulf and Atlantic Coasts with New Orleans the worst threatened
  • Mississippi delta: resources of the river can be used to rebuild and restore the rich natural systems of the area
  • Energy scarcity will affect everyone everywhere
  • Less rain: great plains
  • Ogallala aquifer depletion: great plains (energy scarcity will add to the cost and difficulties of pumping the water up)

Good areas

  • High rainfall and primary production: eastern states
  • High ecosystem services: river valleys and coastal areas
  • Estuaries, swamps, floodplains
  • Warmer, moist climates: higher primary productivity than colder climates

There’s a lot more, I especially liked the attack of the current economic paradigms (i.e. growth forever) on pages 6 – 9.

Also, many of the referenced papers in the article are good reads with important details not covered fully in this paper.

I personally think cities might be good for a few years into the crisis as governments concentrate resources and supply lines where the highest population densities are.  Gas stations out in the rural areas will be the first to close, throwing some places into sudden self-reliancy.  But at some point the whole system snaps like a volcano erupting from oil shocks, rusting oil and gas infrastructure falling apart (especially refineries), natural disasters, black swans like (cyber) warfare, electric grid down for a year or more, nuclear winter from nuclear war anywhere in the world, electromagnetic pulses from solar flares or a nuclear explosion, hunger and consequent social unrest, and other factors in the Decline, Collapse, and “A Fast Crash?” categories.  That will make cities the worst places to be.  Best to move to under-performing areas now since it will take years to become part of another community and learn the necessary skills.

References

Shaw A, et al. 2020. New climate maps show a transformed United States. Propublica.org. My note: too much focus on RCP 8.5 when RCP 2.6 to 4.5 is the most likely outcome given that peak oil has already happened, so there aren’t enough fossils to get to 8.5

Xu C, et al. 2020. Future of the human climate niche. Proceedings of the national academy of sciences.

Posted in Where to Be or Not to Be | Tagged , | 30 Comments

Microbes a key factor in climate change

Preface. The IPCC, like economists, assumes our economy and burning of fossil fuels will grow exponentially until 2100 and beyond, with no limits to growth. But conventional oil peaked and has stayed on a plateau since 2005, so clearly peak global oil production is in sight. As is peak soil, aquifer depletion, biodiversity destruction, and deforestation to name just a few existential threats besides climate change.

The lack of attention to microbes in the IPCC model further weakens their predictions about the trajectory of climate change. As this article notes, diatoms are our friends, they “perform 25–45% of total primary production in the oceans, owing to their prevalence in open-ocean regions when total phytoplankton biomass is maximal. Diatoms have relatively high sinking speeds compared with other phytoplankton groups, and they account for ~40% of particulate carbon export to depth”.

Diatoms didn’t appear until 40 million years ago, and sequester so much carbon that they caused the poles to form ice caps. So certainly scientists should study whether their numbers are decreasing or increasing. But also the IPCC needs to include diatoms and other microbes in their models. It’s a big deal that they haven’t, since microorganisms support the existence of all higher life forms.

Alice Friedemann   www.energyskeptic.com  author of “When Trucks Stop Running: Energy and the Future of Transportation”, 2015, Springer and “Crunch! Whole Grain Artisan Chips and Crackers”. Podcasts: Derrick Jensen, Practical Prepping, KunstlerCast 253, KunstlerCast278, Peak Prosperity , XX2 report

* * *

University of New South Wales. 2019. Leaving microbes out of climate change conversation has major consequences, experts warn. Science Daily.

Original article: Cavicchioli, R., et al. 2019. Scientists’ warning to humanity: microorganisms and climate change. Nature Reviews Microbiology.

More than 30 microbiologists from 9 countries have issued a warning to humanity — they are calling for the world to stop ignoring an ‘unseen majority’ in Earth’s biodiversity and ecosystem when addressing climate change.

The researchers are hoping to raise awareness both for how microbes can influence climate change and how they will be impacted by it — calling for including microbes in climate change research, increasing the use of research involving innovative technologies, and improving education in classrooms.

“Micro-organisms, which include bacteria and viruses, are the lifeforms that you don’t see on the conservation websites,” says Professor Cavicchioli. “They support the existence of all higher lifeforms and are critically important in regulating climate change. “However, they are rarely the focus of climate change studies and not considered in policy development.”

Professor Cavicchioli calls microbes the ‘unseen majority’ of lifeforms on earth, playing critical functions in animal and human health, agriculture, the global food web and industry.

For example, the Census of Marine Life estimates that 90% of the ocean’s total biomass is microbial. In our oceans, marine lifeforms called phytoplankton take light energy from the sun and remove carbon dioxide from the atmosphere as much as plants. The tiny phytoplankton form the beginning of the ocean food web, feeding krill populations that then feed fish, sea birds and large mammals such as whales.

Marine phytoplankton perform half of the global photosynthetic CO2 fixation and half of the oxygen production despite amounting to only ~1% of global plant biomass. In comparison with terrestrial plants, marine phytoplankton are distributed over a larger surface area, are exposed to less seasonal variation and have markedly faster turnover rates than trees (days versus decades). Therefore, phytoplankton respond rapidly on a global scale to climate variations.

Sea ice algae thrive in sea ice ‘houses’. If global warming trends continue, the melting sea ice has a downstream effect on the sea ice algae, which means a diminished ocean food web.

Climate change is literally starving ocean life,” says Professor Cavicchioli.

Beyond the ocean, microbes are also critical to terrestrial environments, agriculture and disease.

In terrestrial environments, microbes release a range of important greenhouse gases to the atmosphere (carbon dioxide, methane and nitrous oxide), and climate change is causing these emissions to increase,” Professor Cavicchioli says.

“Farming ruminant animals releases vast quantities of methane from the microbes living in their rumen — so decisions about global farming practices need to consider these consequences.

“And lastly, climate change worsens the impact of pathogenic microbes on animals (including humans) and plants — that’s because climate change is stressing native life, making it easier for pathogens to cause disease.

“Climate change also expands the number and geographic range of vectors (such as mosquitos) that carry pathogens. The end result is the increased spread of disease, and serious threats to global food supplies.”

Greater commitment to microbe-based research needed

In their statement, the scientists call on researchers, institutions and governments to commit to greater microbial recognition to mitigate climate change.

“The statement emphasizes the need to investigate microbial responses to climate change and to include microbe-based research during the development of policy and management decisions,” says Professor Cavicchioli.

Additionally, climate change research that links biological processes to global geophysical and climate processes should have a much bigger focus on microbial processes.

This goes to the heart of climate change, so if micro-organisms aren’t considered effectively it means models cannot be generated properly and predictions could be inaccurate,” says Professor Cavicchioli.

“Decisions that are made now impact on humans and other forms of life, so if you don’t take into account the microbial world, you’re missing a very big component of the equation.”

Professor Cavicchioli says that microbiologists are also working on developing resources that will be made available for teachers to educate students on the importance of microbes.

“If that literacy is there, that means people will have a much better capacity to engage with things to do with microbiology and understand the ramifications and importance of microbes.”

Posted in Climate Change, Scientists Warnings to Humanity | Tagged , , | 5 Comments

America loves the idea of family farms. That’s unfortunate. By Sarah Taber

Preface. As declining fossil fuels force more and more people back into being farmers, eventually 75 to 90% of the population, it would be much better for this to happen with family farms than gigantic mega-farms with workers who are slaves in all but name. This essay offers an alternative, collaborative worker-owned farming that has already been proven to work..

Alice Friedemann   www.energyskeptic.com  author of “When Trucks Stop Running: Energy and the Future of Transportation”, 2015, Springer and “Crunch! Whole Grain Artisan Chips and Crackers”. Podcasts: Derrick Jensen, Practical Prepping, KunstlerCast 253, KunstlerCast278, Peak Prosperity , XX2 report

* * *

Taber, S. 2019. America loves the idea of family farms. That’s unfortunate. nymag.com

Family farms are central to our nation’s identity. Most Americans, even those who have never been on a farm, have strong feelings about the idea of family farms — so much that they’re the one thing that all U.S. politicians agree on. Each election, candidates across the ideological spectrum roll out plans to save family farms — or give speeches about them, at least. From Little House on the Prairie to modern farmer’s markets, family farms are also the core of most Americans’ vision of what sustainable, just farming is supposed to look like.

But as someone who’s worked in agriculture for 20 years and researched the history of farming, I think we need to understand something: Family farming’s difficulties aren’t a modern problem born of modern agribusiness. It’s never worked very well. It’s simply precarious, and it always has been. Idealizing family farms burdens real farmers with overwhelming guilt and blame when farms go under. It’s crushing.

I wish we talked more openly about this. If we truly understood how rare it is for family farms to happen at all, never mind last multiple generations, I hope we could be less hard on ourselves. Deep down we all know that the razor-thin margins put families in impossible positions all the time, but we still treat it like it’s the ideal. We blame these troubles on agribusiness — but we don’t look deeper. We should. If we’re serious about building food systems that are sustainable and robust in the long term, we need to learn from how farming’s been done for most of human history: collaboratively.

Farming has almost always existed on a larger social scale—very extended families up to whole villages. We tend to think of medieval peasants as forebears of today’s family farms, but they’re not. Medieval villages worked much more like a single unit with little truly private infrastructure—draft animals, plows, and even land were operated at the community level.
Family farming as we know it— nuclear families that own their land, pass it on to heirs, raise some or all of their food, and produce some cash crops—is vanishingly rare in human history.

It’s easy to see how Anglo-Americans could mistake it for normal. Our cultural heritage is one of the few places where this fluke of a farming practice has made multiple appearances. Family farming was a key part of the political economy in ancient Rome, late medieval England, and colonial America. But we keep forgetting something very important about those golden ages of family farming. They all happened after, and only after, horrific depopulation events.

Rome emptied newly conquered lands by selling the original inhabitants into slavery. In England, the Black Death killed so many nobles and serfs that surviving peasants seized their own land and became yeomen — free small farmers who neither answered to a master nor commanded their own servants. Colonial Americans, seeking to recreate English yeoman farming, began a campaign of genocide against indigenous people that has lasted for centuries, and created one of the greatest transfers of land and wealth in history.

Family farming isn’t just difficult. It’s so brittle that it only makes a viable livelihood for farmers when land is nearly valueless for sheer lack of people. In areas where family farming has persisted for more than a couple generations it’s largely thanks to extensive, modern technocratic government interventions like grants, guaranteed loans, subsidized crop insurance, free training, tax breaks, suppression of farmworker wages, and more. Family farms’ dependence on the state is well understood within the industry, but it’s heresy to talk about it openly lest taxpayers catch on. I think it’s time to open up, because I don’t think a practice that needs that much life support can truly be considered “sustainable.” After seeing what I’ve seen from 20 years in the industry, continuing to present it as such feels to me like a type of con game — because there is a better way.

America’s history is filled with examples of collaborative farming. It’s just less publicized than single-family homesteading. African-American farmershave a long and determined history of collaborative farming, a brace against the viciousness of slavery and Jim Crow. Native peoples that farmed usually did so as a whole community rather than on a single-family basis. In the early days of the reservation system, some reservations grew their food on one large farm run by the entire nation or tribe. These were so successful that colonial governments panicked, broke them up, and forced indigenous farmers to farm as individual single-family homesteads. This was done with the express goal of impoverishing them — which says a lot about the realities of family farming, security, and financial independence. It also says a lot about how long those grim realities have been understood. Indigenous groups today run modern, innovative, community-level land operations, including over half the farms in Arizona; or Tanka’s work restoring prairies, bison, and traditional foodways in the Dakotas as the settler-built wheat economy dries up.

One collaborative tradition that’s been very public about how their community-size farms function is the Hutterites, a religious group of about 460 communities in the U.S. and Canada numbering 75-150 people apiece. Despite the harsh prairies where they live, and farming about half as many acres per capita as neighboring family farmers, Hutterites are thriving and expanding when neighboring family farms are throwing in the towel.
Their approach — essentially farming as a large employee-owned company with diverse crops and livestock — has valuable lessons.

Outsiders often chalk up the success of the Hutterites, who forgo most private property, to “free labor” or “not having to pay taxes.” Neither of these are accurate. Hutterite farms thrive due to farming as a larger community rather than as individual families. Family farms can achieve economies of scale by specializing in one thing, like expanding a dairy herd or crop acreage. But with only one or two family members running a farm, there simply isn’t enough bandwidth to run more than one or two operations, no matter how much labor-saving technology is involved. The community at a Hutterite farm allows them to actually pull off what sustainability advocates talk about, but family farms consistently struggle with: diversifying.

To understand why this structure is useful, take the experience of a colleaguewhose family runs a wheat farm in the Great Plains. He’s trying to make extra cash by grazing cattle on their crop when it’s young. This can enhance the soil and future yields if done right, and his family agreed to it, but they couldn’t help build the necessary fence, or pay for another laborer to help him. The property remains fenceless, without additional income, and without the soil health boosts from carefully managed grazing. Community-size farms like Hutterite operations have larger, more flexible labor pools that don’t get stuck in these catch-22 situations.

Stories like this abound in farm country. America’s farmland is filled with opportunities to sustainably grow more food from the same acres and earn extra cash, thwarted by the limited attention solo operations can give. We treat this plight as natural and inevitable. We treat it as something to solve by collective action on a national level — government policies that help family farms. We don’t talk about how readily these things can be solved by collective action at the local level.

Collaboration doesn’t just make better use of the land — it can also do a lot for farmers’ quality of life. Hutterites, thanks to farming on a community scale, get four weeks of vacation per year; new mothers get a few months’ maternity leave and a full-time helper of their choosing — something few American women in any vocation can do.

We don’t have to commit to the Hutterite lifestyle to benefit from the advantages of collaborative farming. Big, diverse, employee-owned farms work, and they can turn farming into a job that anyone can train for and get — you don’t have to be born into it.

Many of today’s new farmers who weren’t born into farming are young and woefully undercapitalized, stuck in a high-labor/low-revenues cycle with little chance for improvement. Others begin farming as a second career, with plenty of capital but a time horizon of perhaps 20 years — rather than the 40 it often takes to make planting orchards, significant investments in land, and other improvements worth it. These new farmers are absolutely trying to do the right thing, but solo farming simply doesn’t give them the resources or time horizon to “think like a cathedral builder.” Good farming is a relay race. We have to build human systems that work like a relay team.

Finally, and perhaps most important, collaborative farming can be a powerful tool for decolonization. Hutterite communities are powerhouses, raising most of the eggs, hogs, or turkeys in some states — and they’re also largely self-sufficient. This has allowed them to build their own culture to suit their own values. They have enough scale to build their own crop processing, so they can work directly with retailers and customers on their own terms instead of going through middlemen. They build their own knowledge instead of relying on “free” agribusiness advice as many family farms do. In other words, they’re powerful. Imagine what groups like this, with determined inclusivity from top leadership down through rank-and-file, could do to right the balance of power in the United States.

Solo farming does work for a few. I don’t want to discount their accomplishments — but I also don’t think we can give them their due without acknowledging the uphill battle they’re in. I think it’s important to be honest about family farming’s challenges and proactive about handling them. One of the best ways to do that is to pool efforts. Our culture puts so much emphasis on one “right” way of farming — solo family operations — that we ignore valuable lessons from people who’ve done it differently for hundreds or thousands of years. It’s time for us to open up and look at other ways of doing things.

Posted in Farming & Ranching | Tagged , , , | 4 Comments

Bodhi Paul Chefurka: Carrying capacity, overshoot and sustainability

Preface. This is a post written by Bodhi Paul Chefurka in 2013 at his blog paulchefurka.ca here. I don’t understand his ultimate sustainable carrying capacity based on hunter gatherers. Why will agriculture go away? But the rest of the article is spot on.

Alice Friedemann   www.energyskeptic.com  author of “When Trucks Stop Running: Energy and the Future of Transportation”, 2015, Springer and “Crunch! Whole Grain Artisan Chips and Crackers”. Podcasts: Practical Prepping, KunstlerCast 253, KunstlerCast278, Peak Prosperity , XX2 report

***

Ever since the writing of Thomas Malthus in the early 1800s, and especially since Paul Ehrlich’s publication of “The Population Bomb”  in 1968, there has been a lot of learned skull-scratching over what the sustainable human population of Planet Earth might “really” be over the long haul.

This question is intrinsically tied to the issue of ecological overshoot so ably described by William R. Catton Jr. in his 1980 book “Overshoot:The Ecological Basis of Revolutionary Change”.  How much have we already pushed our population and consumption levels above the long-term carrying capacity of the planet?

In this article I outline my current thoughts on carrying capacity and overshoot, and present five estimates for the size of a sustainable human population.

Carrying Capacity

Carrying capacity” is a well-known ecological term that has an obvious and fairly intuitive meaning: “The maximum population size of a species that the environment can sustain indefinitely, given the food, habitat, water and other necessities available in the environment.” 

Unfortunately that definition becomes more nebulous and controversial the closer you look at it, especially when we are talking about the planetary carrying capacity for human beings. Ecologists will claim that our numbers have already well surpassed the planet’s carrying capacity, while others (notably economists and politicians…) claim we are nowhere near it yet!
 
This confusion may arise because we tend to confuse two very different understandings of the phrase “carrying capacity”.  For this discussion I will call these the “subjective” view and the “objective” views of carrying capacity.
 
The subjective view is carrying capacity as seen by a member of the species in question. Rather than coming from a rational, analytical assessment of the overall situation, it is an experiential judgement.  As such it tends to be limited to the population of one’s own species, as well as having a short time horizon – the current situation counts a lot more than some future possibility.  The main thing that matters in this view is how many of one’s own species will be able to survive to reproduce. As long as that number continues to rise, we assume all is well – that we have not yet reached the carrying capacity of our environment.

From this subjective point of view humanity has not even reached, let alone surpassed the Earth’s overall carrying capacity – after all, our population is still growing.  It’s tempting to ascribe this view mainly to neoclassical economists and politicians, but truthfully most of us tend to see things this way.  In fact, all species, including humans, have this orientation, whether it is conscious or not.

Species tend to keep growing until outside factors such as disease, predators, food or other resource scarcity – or climate change – intervene.  These factors define the “objective” carrying capacity of the environment.  This objective view of carrying capacity is the view of an observer who adopts a position outside the species in question.It’s the typical viewpoint of an ecologist looking at the reindeer on St. Matthew Island, or at the impact of humanity on other species and its own resource base.

This is the view that is usually assumed by ecologists when they use the naked phrase “carrying capacity”, and it is an assessment that can only be arrived at through analysis and deductive reasoning.  It’s the view I hold, and its implications for our future are anything but comforting.

When a species bumps up against the limits posed by the environment’s objective carrying capacity,its population begins to decline. Humanity is now at the uncomfortable point when objective observers have detected our overshoot condition, but the population as a whole has not recognized it yet. As we push harder against the limits of the planet’s objective carrying capacity, things are beginning to go wrong.  More and more ordinary people are recognizing the problem as its symptoms become more obvious to casual onlookers.The problem is, of course, that we’ve already been above the planet’s carrying capacity for quite a while.
 
One typical rejoinder to this line of argument is that humans have “expanded our carrying capacity” through technological innovation.  “Look at the Green Revolution!  Malthus was just plain wrong.  There are no limits to human ingenuity!”  When we say things like this, we are of course speaking from a subjective viewpoint. From this experiential, human-centric point of view, we have indeed made it possible for our environment to support ever more of us. This is the only view that matters at the biological, evolutionary level, so it is hardly surprising that most of our fellow species-members are content with it.

 
The problem with that view is that every objective indicator of overshoot is flashing red.  From the climate change and ocean acidification that flows from our smokestacks and tailpipes, through the deforestation and desertification that accompany our expansion of human agriculture and living space, to the extinctions of non-human species happening in the natural world, the planet is urgently signalling an overload condition.

Humans have an underlying urge towards growth, an immense intellectual capacity for innovation, and a biological inability to step outside our chauvinistic, anthropocentric perspective.  This combination has made it inevitable that we would land ourselves and the rest of the biosphere in the current insoluble global ecological predicament.

Overshoot

When a population surpasses its carrying capacity it enters a condition known as overshoot.  Because the carrying capacity is defined as the maximum population that an environment can maintain indefinitely, overshoot must by definition be temporary.  Populations always decline to (or below) the carrying capacity.  How long they stay in overshoot depends on how many stored resources there are to support their inflated numbers.  Resources may be food, but they may also be any resource that helps maintain their numbers.  For humans one of the primary resources is energy, whether it is tapped as flows (sunlight, wind, biomass) or stocks (coal, oil, gas, uranium etc.).  A species usually enters overshoot when it taps a particularly rich but exhaustible stock of a resource.  Like fossil fuels, for instance…
 
Population growth in the animal kingdom tends to follow a logistic curve.  This is an S-shaped curve that starts off low when the species is first introduced to an ecosystem, at some later point rises very fast as the population becomes established, and then finally levels off as the population saturates its niche. 
 
Humans have been pushing the envelope of our logistic curve for much of our history. Our population rose very slowly over the last couple of hundred thousand years, as we gradually developed the skills we needed in order to deal with our varied and changeable environment,particularly language, writing and arithmetic. As we developed and disseminated those skills our ability to modify our environment grew, and so did our growth rate. 
 
If we had not discovered the stored energy resource of fossil fuels, our logistic growth curve would probably have flattend out some time ago, and we would be well on our way to achieving a balance with the energy flows in the world around us, much like all other species do.  Our numbers would have settled down to oscillate around a much lower level than today, similar to what they probably did with hunter-gatherer populations tens of thousands of years ago.

Unfortunately, our discovery of the energy potential of coal created what mathematicians and systems theorists call a “bifurcation point” or what is better known in some cases as a tipping point. This is a point at which a system diverges from one path onto another because of some influence on events.  The unfortunate fact of the matter is that bifurcation points are generally irreversible.  Once past such a point, the system can’t go back to a point before it.

Given the impact that fossil fuels had on the development of world civilization, their discovery was clearly such a fork in the road.  Rather than flattening out politely as other species’ growth curves tend to do, ours kept on rising.  And rising, and rising. 

What is a sustainable population level?

Now we come to the heart of the matter.  Okay, we all accept that the human race is in overshoot.  But how deep into overshoot are we?  What is the carrying capacity of our planet?  The answers to these questions,after all, define a sustainable population.

Not surprisingly, the answers are quite hard to tease out.  Various numbers have been put forward, each with its set of stated and unstated assumptions –not the least of which is the assumed standard of living (or consumption profile) of the average person.  For those familiar with Ehrlich and Holdren’s I=PAT equation, if “I” represents the environmental impact of a sustainable population, then for any population value “P” there is a corresponding value for “AT”, the level of Activity and Technology that can be sustained for that population level.  In other words, the higher our standard of living climbs, the lower our population level must fall in order to be sustainable. This is discussed further in an earlier article on Thermodynamic Footprints.

To get some feel for the enormous range of uncertainty in sustainability estimates we’ll look at five assessments, each of which leads to a very different outcome.  We’ll start with the most optimistic one, and work our way down the scale.

The Ecological Footprint Assessment

The concept of the Ecological Footprint was developed in 1992 by William Rees and Mathis Wackernagel at the University of British Columbia in Canada.

The ecological footprint is a measure of human demand on the Earth’s ecosystems. It is a standardized measure of demand for natural capital that may be contrasted with the planet’s ecological capacity to regenerate. It represents the amount of biologically productive land and sea area necessary to supply the resources a human population consumes, and to assimilate associated waste. As it is usually published, the value is an estimate of how many planet Earths it would take to support humanity with everyone following their current lifestyle.

It has a number of fairly glaring flaws that cause it to be hyper-optimistic. The “ecological footprint” is basically for renewable resources only. It includes a theoretical but underestimated factor for non-renewable resources.  It does not take into account the unfolding effects of climate change, ocean acidification or biodiversity loss (i.e. species extinctions).  It is intuitively clear that no number of “extra planets” would compensate for such degradation.

Still, the estimate as of the end of 2012 is that our overall ecological footprint is about “1.7 planets”.  In other words, there is at least 1.7 times too much human activity for the long-term health of this single, lonely planet.  To put it yet another way, we are 70% into overshoot.

It would probably be fair to say that by this accounting method the sustainable population would be (7 / 1.7) or about four billion people at our current average level of affluence.  As you will see, other assessments make this estimate seem like a happy fantasy.

The Fossil Fuel Assessment

The main accelerant of human activity over the last 150 to 200 years has been fossil fuel.  Before 1800 there was very little fossil fuel in general use, with most energy being derived from wood, wind, water, animal and human power. The following graph demonstrates the precipitous rise in fossil fuel use since then, and especially since 1950.

This information was the basis for my earlier Thermodynamic Footprint analysis.  That article investigated the influence of technological energy (87% of which comes from fossil fuels) on human planetary impact, in terms of how much it multiplies the effect of each “naked ape”. The following graph illustrates the multiplier at different points in history:

Fossil fuels have powered the increase in all aspects of civilization, including population growth.  The “Green Revolution” in agriculture that was kicked off by Nobel laureate Norman Borlaug in the late 1940s was largely a fossil fuel phenomenon, relying on mechanization,powered irrigation and synthetic fertilizers derived from fossil fuels. This enormous increase in food production supported a swift rise in population numbers, in a classic ecological feedback loop: more food (supply) => more people (demand) => more food => more people etc…

Over the core decades of the Green Revolution from 1950 to 1980 the world population almost doubled, from fewe rthan 2.5 billion to over 4.5 billion.  The average population growth over those three decades was 2% per year.  Compare that to 0.5% from 1800 to 1900; 1.00% from 1900 to 1950; and 1.5% from 1980 until now:

This analysis makes it tempting to conclude that a sustainable population might look similar to the situation in 1800, before the Green Revolution, and before the global adoption of fossil fuels: about 1 billion peopleliving on about 5% of today’s global average energy consumption.

It’s tempting (largely because it seems vaguely achievable), but unfortunately that number may still be too high.  Even in 1800 the signs of human overshoot were clear, if not well recognized:  there was already widespread deforestation through Europe and the Middle East; and desertification had set into the previously lush agricultural zones of North Africa and the Middle East.

Not to mention that if we did start over with “just” one billion people, an annual growth rate of a mere 0.5% would put the population back over seven billion in just 400 years.  Unless the growth rate can be kept down very close to zero, such a situation is decidedly unsustainable.

The Population Density Assessment

There is another way to approach the question.  If we assume that the human species was sustainable at some point in the past, what point might we choose and what conditions contributed to our apparent sustainability at that time?

I use a very strict definition of sustainability.  It reads something like this: “Sustainability is the ability of a species to survive in perpetuity without damaging the planetary ecosystem in the process.”  This principle applies only to a species’ own actions, rather than uncontrollable external forces like Milankovitch cycles, asteroid impacts, plate tectonics, etc.

In order to find a population that I was fairly confident met my definition of sustainability, I had to look well back in history – in fact back into Paleolithic times.  The sustainability conditions I chose were: a very low population density and very low energy use, with both maintained over multiple thousands of years. I also assumed the populace would each use about as much energy as a typical hunter-gatherer: about twice the daily amount of energy a person obtains from the food they eat.

There are about 150 million square kilometers, or 60 million square miles of land on Planet Earth.  However, two thirds of that area is covered by snow, mountains or deserts, or has little or no topsoil.  This leaves about 50 million square kilometers (20 million square miles) that is habitable by humans without high levels of technology.

A typical population density for a non-energy-assisted society of hunter-forager-gardeners is between 1 person per square mile and 1 person per square kilometer. Because humans living this way had settled the entire planet by the time agriculture was invented 10,000 years ago, this number pegs a reasonable upper boundary for a sustainable world population in the range of 20 to 50 millionpeople.

I settled on the average of these two numbers, 35 million people.  That was because it matches known hunter-forager population densities, and because those densities were maintained with virtually zero population growth (less than 0.01% per year)during the 67,000 years from the time of the Toba super-volcano eruption in 75,000 BC until 8,000 BC (Agriculture Day on Planet Earth).

If we were to spread our current population of 7 billion evenly over 50 million square kilometers, we would have an average density of 150 per square kilometer.  Based just on that number, and without even considering our modern energy-driven activities, our current population is at least 250 times too big to be sustainable. To put it another way, we are now 25,000%into overshoot based on our raw population numbers alone. 

As I said above, we also need to take the population’s standard of living into account. Our use of technological energy gives each of us the average planetary impact of about 20 hunter-foragers.  What would the sustainable population be if each person kept their current lifestyle, which is given as an average current Thermodynamic Footprint (TF) of 20?

We can find the sustainable world population number for any level of human activity by using the I = PAT equation mentioned above.

  • We decided above that the maximum hunter-forager population we could accept as sustainable would be 35 million people, each with a Thermodynamic Footprint of 1.
  • First, we set I (the allowable total impact for our sustainable population) to 35, representing those 35 million hunter-foragers.
  • Next, we set AT to be the TF representing the desired average lifestyle for our population.  In this case that number is 20.
  • We can now solve the equation for P.  Using simple algebra, we know that I = P x AT is equivalent to P = I / AT.  Using that form of the equation we substitute in our values, and we find that P = 35 / 20.  In this case P = 1.75.

This number tells us that if we want to keep the average level of per-capita consumption we enjoy in in today’s world, we would enter an overshoot situation above a global population of about 1.75 million people. By this measure our current population of 7 billion is about 4,000 times too big and active for long-term sustainability. In other words, by this measure we are we are now 400,000% into overshoot

Using the same technique we can calculate that achieving a sustainable population with an American lifestyle (TF = 78) would permit a world population of only 650,000 people – clearly not enough to sustain a modern global civilization. 

For the sake of comparison, it is estimated that the historical world population just after the dawn of agriculture in 8,000 BC was about five million, and in Year 1 was about 200 million.  We crossed the upper threshold of planetary sustainability in about 2000 BC, and have been in deepening overshoot for the last 4,000 years.

The Ecological Assessments

As a species, human beings share much in common with other large mammals.  We breathe, eat, move around to find food and mates, socialize, reproduce and die like all other mammalian species.  Our intellec tand culture, those qualities that make us uniquely human, are recent additions to our essential primate nature, at least in evolutionary terms.

Consequently it makes sense to compare our species’ performance to that of other, similar species – species that we know for sure are sustainable.  I was fortunate to find the work of American marine biologist Dr. Charles W. Fowler, who has a deep interest in sustainability and the ecological conundrum posed by human beings.  The following two assessments are drawn from Dr. Fowler’s work.

First assessment

In 2003, Dr. Fowler and Larry Hobbs co-wrote a paper titled, Is humanity sustainable?”  that was published by the Royal Society.  In it, they compared a variety of ecological measures across 31 species including humans. The measures included biomass consumption, energy consumption, CO2 production, geographical range size, and population size.

It should come as no great surprise that in most ofthe comparisons humans had far greater impact than other species, even to a 99%confidence level.  The only measure inwhich we matched other species was in the consumption of biomass (i.e. food).

When it came to population size, Fowler and Hobbs foundthat there are over two orders of magnitude more humans than one would expectbased on a comparison to other species – 190 times more, in fact.  Similarly, our CO2 emissions outdid otherspecies by a factor of 215.

Based on this research, Dr. Fowler concluded that there are about 200 times too many humans on the planet.  This brings up an estimate for a sustainable population of 35 million people.

This is the same as the upper bound established above by examining hunter-gatherer population densities.  The similarity of the results is not too surprising, since the hunter-gatherers of 50,000 years ago were about as close to “naked apes” as humans have been in recent history.

Second assessment

In 2008, five years after the publication cited above, Dr. Fowler wrote another paper entitled Maximizing biodiversity, information and sustainability.”  In this paper he examined the sustainability question from the point of view of maximizing biodiversity.  In other words, what is the largest human population that would not reduce planetary biodiversity?

This is, of course, a very stringent test, and one that we probably failed early in our history by extirpating mega-fauna in the wake of our migrations across a number of continents.

In this paper, Dr. Fowler compared 96 different species, and again analyzed them in terms of population, CO2 emissions and consumption patterns.

This time, when the strict test of biodiversity retention was applied, the results were truly shocking, even to me.  According to this measure, humans have overpopulated the Earth by almost 700 times.  In order to preserve maximum biodiversity on Earth, the human population may be no more than 10 million people – each with the consumption of a Paleolithic hunter-forager.

Urk!

Conclusions

As you can see, the estimates for a sustainable human population vary widely – by a factor of 400 from the highest to the lowest.

https://www.facebook.com/notes/paul-chefurka/carrying-capacity-overshoot-and-sustainability/185335328288318

The Ecological Footprint doesn’t really seem intended as a measure of sustainability.  Its main value is to give people with no exposure to ecology some sense that we are indeed over-exploiting our planet.  (It also has the psychological advantage of feeling achievable with just a little work.)  As a measure of sustainability,it is not helpful.

As I said above, the number suggested by the Thermodynamic Footprint or Fossil Fuel analysis isn’t very helpful either – even a population of one billion people without fossil fuels had already gone into overshoot.

That leaves us with three estimates: two at 35 million, and one of 10 million.

I think the lowest estimate (Fowler 2008, maximizing biodiversity), though interesting, is out of the running in this case, because human intelligence and problem-solving ability makes our destructive impact on biodiversity a foregone conclusion. We drove other species to extinction 40,000 years ago, when our total population was estimated to be under 1 million.

That leaves the central number of 35 million people, confirmed by two analyses using different data and assumptions.  My conclusion is that this is probably the largest human population that could realistically be considered sustainable.

So, what can we do with this information?  It’s obvious that we will not (and probably cannot) voluntarily reduce our population by 99.5%.  Even an involuntary reduction of this magnitude would involve enormous suffering and a very uncertain outcome.  In fact, it’s close enough to zero that if Mother Nature blinked, we’d be gone.

In fact, the analysis suggests that Homo sapiens is an inherently unsustainable species.  This outcome seems virtually guaranteed by our neocortex, by the very intelligence that has enabled our rise to unprecedented dominance over our planet’s biosphere.  Is intelligence an evolutionary blind alley?  From the singular perspective of our own species, it quite probably is. If we are to find some greater meaning or deeper future for intelligence in the universe, we may be forced to look beyond ourselves and adopt a cosmic, rather than a human, perspective.

Discussion

How do we get out of this jam?

How might we get from where we are today to a sustainable world population of 35 million or so?  We should probably discard the notion of “managing” such a population decline.  If we can’t get our population to simply stop growing, an outright reduction of over 99% is simply not in the cards.  People seem virtually incapable of taking these kinds of decisions in large social groups.  We can decide to stop reproducing, but only as individuals or (perhaps) small groups. Without the essential broad social support, such personal choices will make precious little difference to the final outcome.  Politicians will by and large not even propose an idea like “managed population decline”  – not if they want to gain or remain in power, at any rate.  China’s brave experiment with one-child families notwithstanding, any global population decline will be purely involuntary.

Crash?

A world population decline would (will) be triggered and fed by our civilization’s encounter with limits.  These limits may show up in any area: accelerating climate change, weather extremes,shrinking food supplies, fresh water depletion, shrinking energy supplies,pandemic diseases, breakdowns in the social fabric due to excessive complexity,supply chain breakdowns, electrical grid failures, a breakdown of the international financial system, international hostilities – the list of candidates is endless, and their interactions are far too complex to predict.

In 2007, shortly after I grasped the concept and implications of Peak Oil, I wrote my first web article on population decline: Population: The Elephant in the Room.  In it I sketched out the picture of a monolithic population collapse: a straight-line decline from today’s seven billion people to just one billion by the end of this century.
As time has passed I’ve become less confident in this particular dystopian vision.  It now seems to me that human beings may be just a bit tougher than that.  We would fight like demons to stop the slide, though we would potentially do a lot more damage to the environment in the process.  We would try with all our might to cling to civilization and rebuild our former glory.  Different physical, environmental and social situations around the world would result in a great diversity in regional outcomes.  To put it plainly, a simple “slide to oblivion” is not in the cards for any species that could recover from the giant Toba volcanic eruption in just 75,000 years.

Or Tumble?

Still, there are those physical limits I mentioned above.  They are looming ever closer, and it seems a foregone conclusion that we will begin to encounter them for real within the next decade or two. In order to draw a slightly more realistic picture of what might happen at that point, I created the following thought experiment on involuntary population decline. It’s based on the idea that our population will not simply crash, but will oscillate (tumble) down a series of stair-steps: first dropping as we puncture the limits to growth; then falling below them; then partially recovering; only to fall again; partially recover; fall; recover… 

I started the scenario with a world population of 8 billion people in 2030. I assumed each full cycle of decline and partial recovery would take six generations, or 200 years.  It would take three generations (100 years) to complete each decline and then three more in recovery, for a total cycle time of 200 years. I assumed each decline would take out 60% of the existing population over its hundred years, while each subsequent rise would add back only half of the lost population. 

In ten full cycles – 2,000 years – we would be back to a sustainable population of about 40-50 million. The biggest drop would be in the first 100 years, from 2030 to 2130 when we would lose a net 53 million people per year. Even that is only a loss of 0.9% pa, compared to our net growth today of 1.1%, that’s easily within the realm of the conceivable,and not necessarily catastrophic – at least to begin with. 

As a scenario it seems a lot more likely than a single monolithic crash from here to under a billion people.  Here’s what it looks like:

https://www.facebook.com/notes/paul-chefurka/carrying-capacity-overshoot-and-sustainability/185335328288318

It’s important to remember that this scenario is not a prediction. It’s an attempt to portray a potential path down the population hill that seems a bit more probable than a simple, “Crash! Everybody dies.”

It’s also important to remember that the decline will probably not happen anything like this, either. With climate change getting ready to push humanity down the stairs, and the strong possibility that the overall global temperature will rise by 5 or 6 degrees Celsius even before the end of that first decline cycle, our prospects do not look even this “good” from where I stand.

Rest assured, I’m not trying to present 35 million people as some kind of “population target”. It’s just part of my attempt to frame what we’re doing to the planet, in terms of what some of us see as the planetary ecosphere’s level of tolerance for our abuse. 

The other potential implicit in this analysis is that if we did drop from 8 to under 1 billion, we could then enter a population free-fall. As a result, we might keep falling until we hit the bottom of Olduvai Gorge again. My numbers are an attempt to define how many people might stagger away from such a crash landing.  Some people seem to believe that such an event could be manageable.  I don’t share that belief for a moment. These calculations are my way of getting that message out.

I figure if I’m going to draw a line in the sand, I’m going to do it on behalf of all life, not just our way of life.

What can we do? 


To be absolutely clear, after ten years of investigating what I affectionately call “The Global Clusterfuck”, I do not think it can be prevented, mitigated or managed in any way.  If and when it happens, it will follow its own dynamic, and the force of events could easily make the Japanese and Andaman tsunamis seem like pleasant days at the beach.

The most effective preparations that we can make will all be done by individuals and small groups.  It will be up to each of us to decide what our skills, resources and motivations call us to do.  It will be different for each of us – even for people in the same neighborhood, let alone people on opposite sides of the world.

I’ve been saying for a couple of years that each of us will each do whatever we think is appropriate to the circumstances, in whatever part of the world we can influence. The outcome of our actions is ultimately unforeseeable, because it depends on how the efforts of all 7 billion of us converge, co-operate and compete.  The end result will be quite different from place to place – climate change impacts will vary, resources vary, social structures vary, values and belief systems are different all over the world.The best we can do is to do our best.

Here is my advice: 

  • Stay awake to what’s happening around us.
  • Don’t get hung up by other people’s “shoulds and shouldn’ts”.
  • Occasionally re-examine our personal values.  If they aren’t in alignment with what we think the world needs, change them.
  • Stop blaming people. Others are as much victims of the times as we are – even the CEOs and politicians.
  • Blame, anger and outrage is pointless.  It wastes precious energy that we will need for more useful work.
  • Laugh a lot, at everything – including ourselves.
  • Hold all the world’s various beliefs and “isms” lightly, including our own.
  • Forgive others. Forgive ourselves. For everything.
  • Love everything just as deeply as you can.

That’s what I think might be helpful. If we get all that personal stuff right, then doing the physical stuff about food, water, housing,transportation, energy, politics and the rest of it will come easy – or at least a bit easier. And we will have a lot more fun doing it.

I wish you all the best of luck!
Bodhi Paul Chefurka
May 16, 2013

***

Posted in Overshoot, Paul Chefurka, Population | Tagged , , | 7 Comments

Gravity energy storage

Preface. This is interesting, but not commercial. And as my book “When trucks stop running” explains, trucks are the basis of civilization, and can’t run on electric batteries or overhead wires. Even if they could, I explained why a 100% renewable energy grid was impossible, especially because you need 30 days of storage to ride out seasonal shortages of wind and solar. And even if I were wrong, oil decline is likely to begin with 10 years, so we’ll be stuck with whatever solutions are commercial at the time.

Alice Friedemann   www.energyskeptic.com  author of “When Trucks Stop Running: Energy and the Future of Transportation”, 2015, Springer and “Crunch! Whole Grain Artisan Chips and Crackers”. Podcasts: Practical Prepping, KunstlerCast 253, KunstlerCast278, Peak Prosperity , XX2 report

***

Deign, J. 2019. Energy vault funding breathes life into gravity storage. Greentechmedia.com

The speculative field of gravity-based energy storage got a boost recently with news of a strategic investment and new patents.

Swiss-U.S. startup Energy Vault, one of the most high-profile gravity storage players to date, secured financial backing from Cemex Ventures, the corporate venture capital unit of the world’s second-largest building materials giant, and a pledge to help with deployment through Cemex’s “strategic network.”

Meanwhile, the University of Nottingham and the World Society of Sustainable Energy Technologies confirmed the filing of patent applications for a concept called EarthPumpStore, which uses abandoned mines as gravity storage assets.

Implementing the technology across 150,000 disused open-cast mines in China alone could deliver an estimated storage capacity of 250 terawatt-hours , the University of Nottingham said in a press note.

MY NOTE: well whoop-dee-doo. China generates 16.2 trillion terawatt-hours (TWh) a day. That’s 64 billion times more than all of the open-cast mines can provide. Better start digging more holes!

The announcements indicate growing interest in a class of energy storage concepts that appear seductively simple but have yet to gain widespread acceptance.

Most gravity storage concepts are based on the idea of using spare electricity to lift a heavy block, so the energy can be recovered when needed by letting the weight drop down again.

In the case of Energy Vault, the blocks are made of concrete and are lifted up by cranes 33 stories high. EarthPumpStore, meanwhile, envisages pulling containers filled with compacted earth up the sides of open-cast mines.

Gravity is also the force underpinning pumped hydro, the most widespread and cost-effective form of energy storage in the world. But pumped hydro development is slow and costly, requiring sites with specific topographical characteristics and often involving significant permitting hurdles.

The proponents of newer gravity storage options claim that installation and deployment of their technology is quicker, easier and cheaper.

The University of Nottingham, for example, estimates EarthPumpStore would cost about $50 per installed kilowatt-hour, compared to $200 for pumped hydro and $400 for battery storage.

The university also said EarthPumpStore could achieve a round-trip efficiency of more than 90 percent, compared to between 50 percent and 70 percent for pumped hydro, plus an energy storage density up to eight times higher. Other sources have made similar claims. 

In 2017, for example, a study by Imperial College London for the gravity storage technology developer Heindl Energy concluded that Heindl’s concept could achieve a levelized cost of storage of $148 per megawatt-hour, compared to $206 for pumped hydro.

“Based on the given data, gravity storage is most cost-efficient for bulk electricity storage, followed by pumped hydro and compressed air energy storage,” the research concluded. 

Given gravity storage’s apparent simplicity and cost-effectiveness, it is curious that the concept hasn’t taken off. One of the first companies to emerge with a gravity-based idea was Advanced Rail Energy Storage (ARES), a Santa Barbara-based firm that was founded in 2010.

ARES plans to hoist railcar-based weights up a hillside, and in 2016 finally got U.S. Bureau of Land Management approval for a proposed 50-megawatt, 12.5-megawatt-hour project in Nevada. At the time, ARES was expecting the project to be up and running in early 2019.

However, as of last August the company was still securing permits and pushed its go-live date back to 2020. Other gravity storage hopefuls seem to be making equally slow progress, although last year saw two U.K. companies getting funding.

Energy SRS, a collaboration of five U.K. firms and the University of Bristol, got £727,000 (about $922,000 at today’s exchange rate) from the government research and innovation body Innovate U.K.

The funding was for a prototype, which Energy SRS is hoping to scale up by 2020. Meanwhile, another startup, Gravitricity, got a separate Innovate U.K. grant, of £650,000 ($824,000 today), to build a 250-kilowatt prototype of its mineshaft-based gravity concept.

Gravitricity is also aiming for full-scale implementation next year.

Daniel Finn-Foley, principal analyst at Wood Mackenzie Power & Renewables, said concerns over the safety, scalability and round-trip efficiency of lithium-ion batteries could lead to growing interest in alternatives such as gravity storage.

“It could be a key technology in the long term as states continue to mandate carbon-free energy,” he said. “I doubt the 100 percent vision will be solved by dropping lithium-ion batteries everywhere, so seeing new technologies emerge will be key.”

Posted in Energy Storage, Research | Tagged | 9 Comments

Peak stainless steel

Steel and nickel aren’t on the critical mineral list, but nickel ought to be, since this study shows that there is a significant risk that stainless steel production will reach its maximum capacity around 2055 because of declining nickel production, though recycling, and use of other alloys on a very small scale can compensate somewhat.

The model in this study assumes business as usual for metal production and fossil fuel supplies (though the authors note that energy limitations are likely in the future, which will limit mining). If oil begins to decline within 10 years, as many think, shortages of stainless steel and everything else will happen before 2055.

There are two kinds of steel. Stainless which resists corrosion and is more ductile and tough than regular steel, also known as mild or carbon steel.

By weight, stainless steel is the fourth largest metal produced, after carbon steel, cast iron, and aluminum.

But stainless steel is limited by the alloying metals manganese (Mn), chromium (Cr) and nickel (Ni), which have limited reserves.

There are over 150 grades of stainless steel which is used for cutlery, cookware, zippers, construction, autos, handrails, counters, shipping containers, medical instruments and equipment, transportation of chemicals, liquids, and food products, harsh environments with high heat and toxic substances, off-shore oil rigs, wind, solar, geothermal, hydropower, battleships, tanks, submarines, and too many other products to name.

Steel of all kinds is crafted for a specific purpose with alloys added to make it harder, softer, more bendable, stiffer, corrosion resistant and more.  It is used in every single kind of energy resource and vehicle made, wind turbines, solar panels, nuclear power plants, trucks and more as pointed out in the article at the bottom about iron ore.  Renewable evangelists like to point out that steel can be made in electric arc furnaces, but most steel is made from scratch with iron ore, since recycled steel is lower quality, unable to be used by many industries without the special alloys specific to its function. In addition, many parts of the world don’t have the enormous amount of electricity required, or any steel to recycle.

Alice Friedemann  www.energyskeptic.com  Author of Life After Fossil Fuels: A Reality Check on Alternative Energy; When Trucks Stop Running: Energy and the Future of Transportation”, Barriers to Making Algal Biofuels, & “Crunch! Whole Grain Artisan Chips and Crackers”.  Women in ecology  Podcasts: WGBH, Jore, Planet: Critical, Crazy Town, Collapse Chronicles, Derrick Jensen, Practical Prepping, Kunstler 253 &278, Peak Prosperity,  Index of best energyskeptic posts

***

Sverdrup HU et al (2019) Assessing the long-term global sustainability of the production and supply for stainless steel. Biophysical economics and resource quality.

The extractable amounts of nickel are modest, and this puts a limit on how much stainless steel of different qualities can be produced. Nickel is the most key element for stainless steel production.

This study shows that there is a significant risk that the stainless steel production will reach its maximum capacity around 2055 and slowly decline after that. The model indicates that stainless steel of the type containing Mn–Cr–Ni will have a production peak in about 2040, and the production will decline after 2045 because of nickel supply limitations. 

For making stainless steel, four metals are essential and regularly used for making high quality steel, assisted by specialty metals for special properties:

  • Iron for bulk of the stainless steel material
  • Chromium for corrosion resistance
  • Manganese for removing impurities and gain strength and workability
  • Nickel for corrosion resistance, temperature resistance and hardness
  • Molybdenum, cobalt, vanadium and niobium for strength, hardness, corrosion resistance and temperature resistance. Small amounts of nitrogen, phosphorus, silicon or aluminum is sometimes added to these alloys to fine-tune the properties of the material.

For stainless steels, metals like vanadium (occurs as a contaminant in almost all iron ore) are used for toughness and strength, tungsten, tantalum and niobium for extra hardness and high temperature resistance, cobalt for corrosion prevention. World production of stainless steel typically consists of 5–12% manganese, 10–18% chromium, 3–5% nickel and 0.1% molybdenum on the average.

Nickel is an important component in high-quality stainless steel (46% of supply), it is used in nonferrous alloys and super-alloys (34%), electroplating (14%), and 6% is used for other uses. There is no replacement for Nickle that exist, although chromium may be used for some of the functions of nickel in an alloy, and cobalt, molybdenum and niobium may do other alloying functions.

“Could even metals like iron, or manganese or chromium run out if we looked far enough into the future?”

Running their model until 3800 with business-as-usual figures, ” a critical time occurs around 2500 AD. Then most metals resources will have been depleted. Iron will be in abundant supply per person until about 2450, but then a sharp decline sets in. The same happens to manganese and chromium, then are sufficient until about 2500, and then the final decline comes, whereas the supply of nickel will be a trickle after 2300.”

Venditti (2022) Visualizing the World’s largest Iron Ore producers. Visual Capitalist.   https://elements.visualcapitalist.com/visualizing-the-worlds-largest-iron-ore-producers/

Iron ore is 93% of the 2.7 billion tonnes of metals mined in 2021, with 98% of it going towards making steel. Although mined in over 50 countries, just 7 account for 82% of world production.

Country 2021 Production (Tonnes)
Australia… 900,000,000
Brazil……. 380,000,000
China……. 360,000,000
India…….. 240,000,000
Russia….. 100,000,000
Ukraine…… 81,000,000
Canada…… 68,000,000
South Africa 61,000,000
Kazakhstan 64,000,000
Iran……….. 50,000,000

Iron is the fourth most abundant element on the planet after oxygen, silicon, and aluminum, constituting about 5% of the Earth’s crust. Australia produced 35% of the iron ore mined last year.

China consumes the most iron ore, importing 80% of the iron ore it uses each year.

Steel is used extensively in agriculture, solar and wind power, and also in infrastructure for hydroelectric as well as transformers, generators, and electric motors, along with ships, trucks, and trains.

Posted in Infrastructure & Collapse, Mining, Peak Critical Elements | Tagged , , , | 4 Comments

Medicare for All?

Preface.  This is a 3-page review of a 34-page overview Congressional Budget Office report requested by congress on establishing a single-payer health care system. 

IMHO, I don’t see how this can possibly happen.  How can a dysfunctional congress deal with such a complex undertaking, let alone ignore powerful insurance, hospitals, and health care provider lobbyists? Haven’t we learned anything from both Clinton & Obama’s attempts to reform health care with a public option?

Also, although Medicare is seen as a single payer system, many analysts disagree, since “private insurers play a significant role in delivering Medicare benefits outside the traditional Medicare program.” 

Peak oil and health care

But the biggest stumbling block of all is that it really does look like we’re on the cusp of peak oil.  The 2019 BP Statistical review of world energy showed that 98% of all new oil produced in 2018 came from U.S. Fracking, and we’re nowhere “peak demand”, consumption grew by 3.1 million barrels per day (bpd) to a new record of 99.8 million bpd (Rapier 2019).  Since what really matters is peak diesel to keep trucks running, we may be past peak diesel, since fracked oil is far better for plastics than transportation fuel.

So take good care of yourself. There will be far less health care in the future, and eventually nothing but what your local community provides.

Components of single payer system.jpg

Alice Friedemann   www.energyskeptic.com  author of “When Trucks Stop Running: Energy and the Future of Transportation”, 2015, Springer and “Crunch! Whole Grain Artisan Chips and Crackers”. Podcasts: Practical PreppingKunstlerCast 253KunstlerCast278Peak Prosperity , XX2 report

***

CBO. 2019. Key design components and considerations for establishing a single-payer health care system.  United States Congressional Budget Office.

The report does not address all of the issues involved in designing, implementing, and transitioning to a single-payer system, nor does it analyze the budgetary effects of any specific proposal.

Statistics

  29 million people under age 65 were uninsured, 11% of the population.

243 million people under age 65 had health insurance: 160 million people through an employer, 69 million via Medicaid the Children’s Health Insurance Program

Some of the key design considerations for policymakers interested in establishing a single-payer system include the following:

  • How would the government administer a single-payer health plan?
  • Who would be eligible for the plan, and what benefits would it cover?
  • What cost sharing, if any, would the plan require?
  • What role, if any, would private insurance and other public programs have?               
  • Which providers would be allowed to participate, and who would own the hospitals and employ the providers?
  • How would the single-payer system set provider payment rates and purchase prescription drugs?
  • How would the single-payer system contain health care costs?
  • How would the system be financed?

Establishing a single-payer system would be a major undertaking that would involve substantial changes in the sources and extent of coverage, provider payment rates, and financing methods of health care in the United States.

Although a single-payer system could substantially reduce the number of people who lack insurance, the change in the number of people who are uninsured would depend on the system’s design. For example, some people (such as noncitizens who are not lawfully present in the United States) might not be eligible for coverage under a single-payer system and thus might be uninsured.

Single-Payer Health Care Systems

Although single-payer systems can have a variety of different features and have been defined in many ways, health care systems are typically considered single-payer systems if they have these four key features:

  • The government entity (or government-contracted entity) operating the public health plan is responsible for most operational functions of the plan, such as defining the eligible population, specifying the covered services, collecting the resources needed for the plan, and paying providers for covered services
  • The eligible population is required to contribute toward financing the system
  • The receipts and expenditures associated with the plan appear in the government’s budget
  • Private insurance, if allowed, generally plays a relatively small role and supplements the coverage provided under the public plan.

In the United States, the traditional Medicare program is considered an example of an existing single-payer system for elderly and disabled people, but analysts disagree about whether the entire Medicare program is a single-payer system because private insurers play a significant role in delivering Medicare benefits outside the traditional Medicare program.

Questions and complexities

  • Could people opt out?
  • Which services would the system cover, and would it cover long-term services and supports?
  • How would the system address new treatments and technologies?
  • What cost sharing, if any, would the plan require?
  • How would the system purchase and determine the prices of prescription drugs?
  • Would the government finance the system through premiums, cost sharing, taxes, or borrowing?
  • How would the system pay providers and set provider payment rates?
  • What role would private health insurance have?
  • Who would own the hospitals and employ the providers?

Differences Between Single-Payer Health Care Systems and the Current U.S. System

Establishing a single-payer system in the United States would involve significant changes for all participants— individuals, providers, insurers, employers, and manufacturers of drugs and medical devices—because a single-payer system would differ from the current system in many ways, including sources and extent of coverage, provider payment rates, and methods of financing. Because health care spending in the United States currently accounts for about one-sixth of the nation’s gross domestic product, those changes could significantly affect the overall U.S. economy.

Although policymakers could design a single-payer system with an intended objective in mind, the way the system was implemented could cause substantial uncertainty for all participants. That uncertainty could arise from political and budgetary processes, for example, or from the responses of other participants in the system.

The transition toward a single-payer system could be complicated, challenging, and potentially disruptive. To smooth that transition, features of the single-payer system that would cause the largest changes from the current system could be phased in gradually to minimize their impact. Policymakers would need to consider how quickly people with private insurance would switch their coverage to the new public plan, what would happen to workers in the health insurance industry if private insurance was banned entirely or its role was limited, and how quickly provider payment rates under the single-payer system would be phased in from current levels.

Coverage. In a single-payer system that achieved universal coverage, everyone eligible would receive health insurance coverage with a specified set of benefits regardless of their health status. Under the current system, CBO estimates, an average of 29 million people per month—11% of U.S. residents under age 65—were uninsured in 2018.5 Most (or perhaps all) of those people would be covered by the public plan under a single-payer system, depending on who was eligible.

A key design choice is whether noncitizens who are not lawfully present would be eligible. An average of 11 million people per month fell into that category in 2018, and they might not have health insurance under a single-payer system if they were not eligible for the public plan. About half of those 11 million people had health insurance in 2018.

In 2018, a monthly average of about 243 million people under age 65 had health insurance. About two-thirds of them, or an estimated 160 million people, had health insurance through an employer. Roughly another quarter of that population, or about 69 million people, are estimated to have been enrolled in Medicaid or the Children’s Health Insurance Program (CHIP).

Currently, national health care spending—which totaled $3.5 trillion in 2017—is financed through a mix of public and private sources, with private sources such as businesses and households contributing just under half that amount and public sources contributing the rest (in direct spending as well as through forgone revenues from tax subsidies). Shifting such a large amount of expenditures from private to public sources would significantly increase government spending and require substantial additional government resources. The amount of those additional resources would depend on the system’s design and on the choice of whether or not to increase budget deficits. Total national health care spending under a single-payer system might be higher or lower than under the current system depending on the key features of the new system, such as the services covered, the provider payment rates, and patient cost-sharing requirements.

It would probably have lower administrative costs than the current system—following the example of Medicare and of single-payer systems in other countries—because it would consolidate administrative tasks and eliminate insurers’ profits. Moreover, unlike private insurers, which can experience substantial enrollee turnover over time, a single-payer system without that turnover would have a greater incentive to invest in measures to improve people’s health and in preventive measures that have been shown to reduce costs. Whether the single-payer plan would act on that incentive is unknown.

An expansion of insurance coverage under a single-payer system would increase the demand for care and put pressure on the available supply of care.

A single-payer system would affect other sectors of the economy that are beyond the scope of this report. For example, labor supply and employees’ compensation could change because health insurance is an important part of employees’ compensation under the current system.

References

Rapier, R. 2019. The U.S. accounted for 98% of global oil production growth in 2018. Forbes

Posted in Health What to do | Tagged | 2 Comments

Cheddar Power

Preface. Oh how I love cheddar. When I hear that someone is a vegan I stare in disbelief. A life without cheese is a life not worth living, especially a life without cheddar. As a perpetually hungry child, if Mom was in the front room, I’d dash to the back of the house and get cheddar out of the refrigerator and slice off a small piece of cheese. If there is a substitute for oil, oh please let it be cheese!

Alice Friedemann   www.energyskeptic.com  author of “When Trucks Stop Running: Energy and the Future of Transportation”, 2015, Springer and “Crunch! Whole Grain Artisan Chips and Crackers”. Podcasts: Practical Prepping, KunstlerCast 253, KunstlerCast278, Peak Prosperity , XX2 report

***

Paraskova, T. 2019. Cheddar To The Rescue? UK Company Uses Cheese To Power 4,000 Homes. oilprice.com

Say Cheese

A UK dairy in Yorkshire has signed an agreement with a local biogas plant to supply it with a by-product of cheese-making that would be turned into thermal power to heat homes in the area.

The Wensleydale Creamery, which produces the Yorkshire Wensleydale cheese, makes 4,000 tons of cheese every year at its dairy in Hawes in the heart of the Yorkshire Dales.

The company has struck a deal with specialist environment fund manager Iona Capital, under which an Iona biogas plant will produce more than 10,000 MWh of energy per year from whey—a by-product of cheese making, Wensleydale Creamery said on Monday.

Under the deal, Wensleydale Creamery will provide Iona Capital’s Leeming Biogas plant in North Yorkshire with leftover whey from the process of cheese making. The plant will process and turn the whey into “green gas” via anaerobic digestion that will produce thermal power sufficient to heat 800 homes a year.

Iona Capital already has nine such renewable energy plants in Yorkshire, which save the equivalent of 37,300 tons of carbon dioxide (CO2) each year.

“Once we have converted the cheese by-product supplied by Wensleydale into sustainable green gas, we can feed what’s left at the end of the process onto neighbouring farmland to improve local topsoil quality. This shows the real impact of the circular economy and the part intelligent investment can play in reducing our CO2 emissions,” Mike Dunn, co-founder of Iona, said in a statement.

“The whole process of converting local milk to premium cheese and then deriving environmental and economic benefit from the natural by-products is an essential part of our business plan as a proud rural business. It is only possible as a result of significant and continued investments in our Wensleydale Creamery at Hawes and to sign this agreement and have the opportunity to convert a valuable by-product of cheese making into energy that will power hundreds of homes across the region will be fantastic for everyone involved,” Wensleydale Creamery’s managing director, David Hartley, said.   

Posted in Far Out | Tagged | 4 Comments

Pumped Hydro Storage (PHS)

Preface. This is the only commercial way to store energy now (CAES hardly counts with just one plant and salt domes to put more in existing in only 5 states). Though of course hydropower is only in a few states as well, 10 states have 80% of hydropower, and PHS needs to go far above existing reservoirs. There are very few places this could be done.

And the few places that exist are getting huge NIMBY opposition.

Alice Friedemann  www.energyskeptic.com Women in ecology  author of 2021 Life After Fossil Fuels: A Reality Check on Alternative Energy best price here; 2015 When Trucks Stop Running: Energy and the Future of Transportation”, Barriers to Making Algal Biofuels, & “Crunch! Whole Grain Artisan Chips and Crackers”.  Podcasts: Crazy Town, Collapse Chronicles, Derrick Jensen, Practical Prepping, KunstlerCast 253, KunstlerCast278, Peak Prosperity

***

Pumped hydro storage generates power by using electrically powered turbines to move water from a lower level at night uphill to a reservoir above.

During daylight hours when electricity demand is higher, the water is released to flow back downhill to spin electrical turbines. Locations must have both high elevation and space for a reservoir above an existing body of water.

Pumped hydro uses roughly 20–30 % more energy than it produces, with more electricity required to pump the water uphill than is generated when it goes downhill. Nonetheless, pumped hydro enables load shifting, and is important to balance wind and solar power.

Appearances can be deceiving: Pumped hydro is not a Rube Goldberg scheme. Many of you have used a kilowatt or two of pumped hydro yourself. PHS accounts for over 98 % of what little current energy storage exists in the United States, and is the only kind of commercial storage that can provide sustained power over 12 hours (typically, the other 12 hours are spent pumping the water up).

Existing PHS facilities store terawatts of power annually, but account for less than 2 % of annual U.S. power generation. In 2018, the United States had 22.9 gigawatts (GW) of pumped storage hydroelectric generating capacity, compared with 79.9 GW of conventional hydroelectric capacity. This isn’t likely to increase much, since like hydroelectric dams, there are few places to put PHS. Only two have been built since 1995, for a grand total of 43 in the U.S., with most of the technically attractive sites already used (Hassenzahl 1981).

Most were built between 1960 and 1990; nearly half of the pumped storage capacity still in operation was built in the 1970s (EIA 2019).

Existing PHS in the U.S. can store 22 GW, with the potential for another 34 GW more across 22 states, though high cost and environmental issues will prevent many from being built. Additionally, saltwater PHS could be built above the ocean along the West coast, but so far the high cost of doing so, shorter lifespan due to saltwater corrosion, distance from the grid, and concerns of salt seepage into the soil have prevented their development. Underground caverns and floating sea walls are other possibilities, but also aren’t commercial yet.

PHS has a very low energy density. To store the energy contained in just one gallon of gasoline requires over 55,000 gallons to be pumped up the height of Hoover Dam, which is 726 feet high (CCST 2012).

In 2011, pumped hydro storage produced 23 TWh of electricity across the U.S. However, those plants consumed 29 TWh moving water uphill, a net loss of 6 TWh.

So, how many PHS units would it take to give the U.S. that one day of electricity storage, 11.12 TWh? Over 365 days, our 43 existing pumped hydro plants produced two days of energy storage (23 TWh). Thus, the U.S. would need more than 7800 additional plants (365/2 * 43). Rube Goldberg, I can imagine what you would make of this.

FEW PLACES TO PUT MORE

Roger Andrews looked at where PHS seawater reservoirs could be put all over the world and found only three where a combination of favorable shoreline topography and minimal impacts would allow any significant amount of SWPH to be developed – Chile (discussed here), California (discussed here) and, of all places, Croatia (Andrews 2018).

Andrews R (2018) The seawater pumped hydro potential of the world. Energy Matters. http://euanmearns.com/the-seawater-pumped-hydro-potential-of-the-world/

NIMBY

The Navajo are objecting to three PHS in the Black Mesa. They cite the projects’ potential harm to water resources, traditional land uses and wildlife, and the developer’s failure to obtain consent from local communities before seeking federal approval. The projects propose eight new reservoirs across 38,000 acres. Filling them would require 450,000 acre-feet of water, an enormous share of the remaining Colorado River flows. Even under the best-case scenario, up to 8,000 acre-feet would be lost to evaporation each year, which is nearly double the rate of aquifer depletion from historical coal extraction. The applications list the aquifers beneath Black Mesa and the Colorado and San Juan rivers as potential water sources but provide no evidence of availability or legal rights to those sources (CBS 2023).

References

CBS (2023) 18 Navajo Chapters Oppose Huge Pumped Storage Projects Threatening Arizona’s Black Mesa. Center for Biological diversity. https://biologicaldiversity.org/w/news/press-releases/18-navajo-chapters-oppose-huge-pumped-storage-projects-threatening-arizonas-black-mesa-2023-07-14/

CCST. 2012. California’s energy future: electricity from renewable energy and fossil fuels with carbon capture and sequestration. California: California Council on Science and Technology.

Hassenzahl, W.V. ed. 1981. Mechanical, thermal, and chemical storage of energy. London: Hutchinson Ross.

Posted in Dams, Energy Production, Hydropower, Pumped Hydro Storage (PHS) | Tagged , , , , , | 15 Comments