Peak stainless steel

Steel and nickel aren’t on the critical mineral list, but nickel ought to be, since this study shows that there is a significant risk that stainless steel production will reach its maximum capacity around 2055 because of declining nickel production, though recycling, and use of other alloys on a very small scale can compensate somewhat.

The model in this study assumes business as usual for metal production and fossil fuel supplies (though the authors note that energy limitations are likely in the future, which will limit mining). If oil begins to decline within 10 years, as many think, shortages of stainless steel and everything else will happen before 2055.

There are two kinds of steel. Stainless which resists corrosion and is more ductile and tough than regular steel, also known as mild or carbon steel.

By weight, stainless steel is the fourth largest metal produced, after carbon steel, cast iron, and aluminum.

But stainless steel is limited by the alloying metals manganese (Mn), chromium (Cr) and nickel (Ni), which have limited reserves.

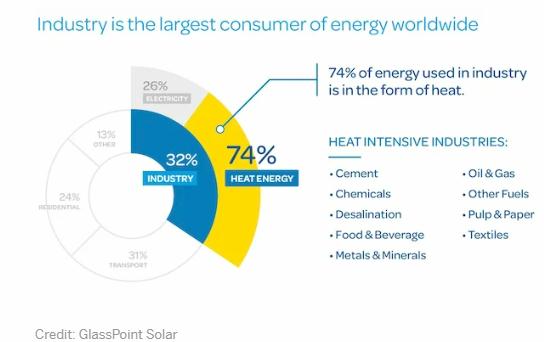
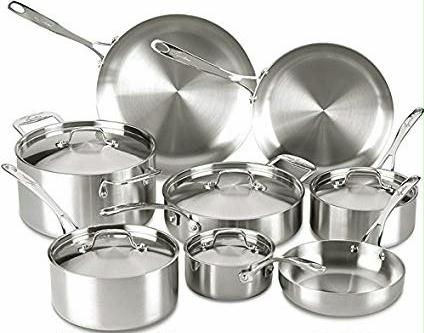
There are over 150 grades of stainless steel which is used for cutlery, cookware, zippers, construction, autos, handrails, counters, shipping containers, medical instruments and equipment, transportation of chemicals, liquids, and food products, harsh environments with high heat and toxic substances, off-shore oil rigs, wind, solar, geothermal, hydropower, battleships, tanks, submarines, and too many other products to name.

Steel of all kinds is crafted for a specific purpose with alloys added to make it harder, softer, more bendable, stiffer, corrosion resistant and more.  It is used in every single kind of energy resource and vehicle made, wind turbines, solar panels, nuclear power plants, trucks and more as pointed out in the article at the bottom about iron ore.  Renewable evangelists like to point out that steel can be made in electric arc furnaces, but most steel is made from scratch with iron ore, since recycled steel is lower quality, unable to be used by many industries without the special alloys specific to its function. In addition, many parts of the world don’t have the enormous amount of electricity required, or any steel to recycle.

Alice Friedemann  www.energyskeptic.com  Author of Life After Fossil Fuels: A Reality Check on Alternative Energy; When Trucks Stop Running: Energy and the Future of Transportation”, Barriers to Making Algal Biofuels, & “Crunch! Whole Grain Artisan Chips and Crackers”.  Women in ecology  Podcasts: WGBH, Jore, Planet: Critical, Crazy Town, Collapse Chronicles, Derrick Jensen, Practical Prepping, Kunstler 253 &278, Peak Prosperity,  Index of best energyskeptic posts

***

Sverdrup HU et al (2019) Assessing the long-term global sustainability of the production and supply for stainless steel. Biophysical economics and resource quality.

The extractable amounts of nickel are modest, and this puts a limit on how much stainless steel of different qualities can be produced. Nickel is the most key element for stainless steel production.

This study shows that there is a significant risk that the stainless steel production will reach its maximum capacity around 2055 and slowly decline after that. The model indicates that stainless steel of the type containing Mn–Cr–Ni will have a production peak in about 2040, and the production will decline after 2045 because of nickel supply limitations. 

For making stainless steel, four metals are essential and regularly used for making high quality steel, assisted by specialty metals for special properties:

  • Iron for bulk of the stainless steel material
  • Chromium for corrosion resistance
  • Manganese for removing impurities and gain strength and workability
  • Nickel for corrosion resistance, temperature resistance and hardness
  • Molybdenum, cobalt, vanadium and niobium for strength, hardness, corrosion resistance and temperature resistance. Small amounts of nitrogen, phosphorus, silicon or aluminum is sometimes added to these alloys to fine-tune the properties of the material.

For stainless steels, metals like vanadium (occurs as a contaminant in almost all iron ore) are used for toughness and strength, tungsten, tantalum and niobium for extra hardness and high temperature resistance, cobalt for corrosion prevention. World production of stainless steel typically consists of 5–12% manganese, 10–18% chromium, 3–5% nickel and 0.1% molybdenum on the average.

Nickel is an important component in high-quality stainless steel (46% of supply), it is used in nonferrous alloys and super-alloys (34%), electroplating (14%), and 6% is used for other uses. There is no replacement for Nickle that exist, although chromium may be used for some of the functions of nickel in an alloy, and cobalt, molybdenum and niobium may do other alloying functions.

“Could even metals like iron, or manganese or chromium run out if we looked far enough into the future?”

Running their model until 3800 with business-as-usual figures, ” a critical time occurs around 2500 AD. Then most metals resources will have been depleted. Iron will be in abundant supply per person until about 2450, but then a sharp decline sets in. The same happens to manganese and chromium, then are sufficient until about 2500, and then the final decline comes, whereas the supply of nickel will be a trickle after 2300.”

Venditti (2022) Visualizing the World’s largest Iron Ore producers. Visual Capitalist.   https://elements.visualcapitalist.com/visualizing-the-worlds-largest-iron-ore-producers/

Iron ore is 93% of the 2.7 billion tonnes of metals mined in 2021, with 98% of it going towards making steel. Although mined in over 50 countries, just 7 account for 82% of world production.

Country 2021 Production (Tonnes)
Australia… 900,000,000
Brazil……. 380,000,000
China……. 360,000,000
India…….. 240,000,000
Russia….. 100,000,000
Ukraine…… 81,000,000
Canada…… 68,000,000
South Africa 61,000,000
Kazakhstan 64,000,000
Iran……….. 50,000,000

Iron is the fourth most abundant element on the planet after oxygen, silicon, and aluminum, constituting about 5% of the Earth’s crust. Australia produced 35% of the iron ore mined last year.

China consumes the most iron ore, importing 80% of the iron ore it uses each year.

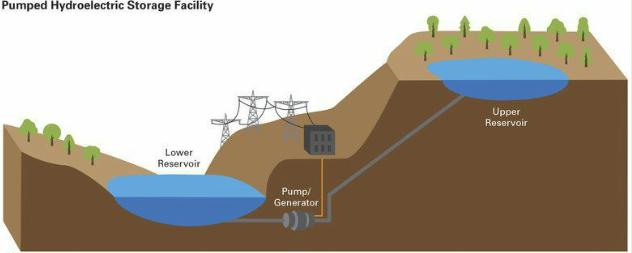
Steel is used extensively in agriculture, solar and wind power, and also in infrastructure for hydroelectric as well as transformers, generators, and electric motors, along with ships, trucks, and trains.

Posted in Infrastructure & Collapse, Mining, Peak Critical Elements | Tagged , , , | 4 Comments

Medicare for All?

Preface.  This is a 3-page review of a 34-page overview Congressional Budget Office report requested by congress on establishing a single-payer health care system. 

IMHO, I don’t see how this can possibly happen.  How can a dysfunctional congress deal with such a complex undertaking, let alone ignore powerful insurance, hospitals, and health care provider lobbyists? Haven’t we learned anything from both Clinton & Obama’s attempts to reform health care with a public option?

Also, although Medicare is seen as a single payer system, many analysts disagree, since “private insurers play a significant role in delivering Medicare benefits outside the traditional Medicare program.” 

Peak oil and health care

But the biggest stumbling block of all is that it really does look like we’re on the cusp of peak oil.  The 2019 BP Statistical review of world energy showed that 98% of all new oil produced in 2018 came from U.S. Fracking, and we’re nowhere “peak demand”, consumption grew by 3.1 million barrels per day (bpd) to a new record of 99.8 million bpd (Rapier 2019).  Since what really matters is peak diesel to keep trucks running, we may be past peak diesel, since fracked oil is far better for plastics than transportation fuel.

So take good care of yourself. There will be far less health care in the future, and eventually nothing but what your local community provides.

Components of single payer system.jpg

Alice Friedemann   www.energyskeptic.com  author of “When Trucks Stop Running: Energy and the Future of Transportation”, 2015, Springer and “Crunch! Whole Grain Artisan Chips and Crackers”. Podcasts: Practical PreppingKunstlerCast 253KunstlerCast278Peak Prosperity , XX2 report

***

CBO. 2019. Key design components and considerations for establishing a single-payer health care system.  United States Congressional Budget Office.

The report does not address all of the issues involved in designing, implementing, and transitioning to a single-payer system, nor does it analyze the budgetary effects of any specific proposal.

Statistics

  29 million people under age 65 were uninsured, 11% of the population.

243 million people under age 65 had health insurance: 160 million people through an employer, 69 million via Medicaid the Children’s Health Insurance Program

Some of the key design considerations for policymakers interested in establishing a single-payer system include the following:

  • How would the government administer a single-payer health plan?
  • Who would be eligible for the plan, and what benefits would it cover?
  • What cost sharing, if any, would the plan require?
  • What role, if any, would private insurance and other public programs have?               
  • Which providers would be allowed to participate, and who would own the hospitals and employ the providers?
  • How would the single-payer system set provider payment rates and purchase prescription drugs?
  • How would the single-payer system contain health care costs?
  • How would the system be financed?

Establishing a single-payer system would be a major undertaking that would involve substantial changes in the sources and extent of coverage, provider payment rates, and financing methods of health care in the United States.

Although a single-payer system could substantially reduce the number of people who lack insurance, the change in the number of people who are uninsured would depend on the system’s design. For example, some people (such as noncitizens who are not lawfully present in the United States) might not be eligible for coverage under a single-payer system and thus might be uninsured.

Single-Payer Health Care Systems

Although single-payer systems can have a variety of different features and have been defined in many ways, health care systems are typically considered single-payer systems if they have these four key features:

  • The government entity (or government-contracted entity) operating the public health plan is responsible for most operational functions of the plan, such as defining the eligible population, specifying the covered services, collecting the resources needed for the plan, and paying providers for covered services
  • The eligible population is required to contribute toward financing the system
  • The receipts and expenditures associated with the plan appear in the government’s budget
  • Private insurance, if allowed, generally plays a relatively small role and supplements the coverage provided under the public plan.

In the United States, the traditional Medicare program is considered an example of an existing single-payer system for elderly and disabled people, but analysts disagree about whether the entire Medicare program is a single-payer system because private insurers play a significant role in delivering Medicare benefits outside the traditional Medicare program.

Questions and complexities

  • Could people opt out?
  • Which services would the system cover, and would it cover long-term services and supports?
  • How would the system address new treatments and technologies?
  • What cost sharing, if any, would the plan require?
  • How would the system purchase and determine the prices of prescription drugs?
  • Would the government finance the system through premiums, cost sharing, taxes, or borrowing?
  • How would the system pay providers and set provider payment rates?
  • What role would private health insurance have?
  • Who would own the hospitals and employ the providers?

Differences Between Single-Payer Health Care Systems and the Current U.S. System

Establishing a single-payer system in the United States would involve significant changes for all participants— individuals, providers, insurers, employers, and manufacturers of drugs and medical devices—because a single-payer system would differ from the current system in many ways, including sources and extent of coverage, provider payment rates, and methods of financing. Because health care spending in the United States currently accounts for about one-sixth of the nation’s gross domestic product, those changes could significantly affect the overall U.S. economy.

Although policymakers could design a single-payer system with an intended objective in mind, the way the system was implemented could cause substantial uncertainty for all participants. That uncertainty could arise from political and budgetary processes, for example, or from the responses of other participants in the system.

The transition toward a single-payer system could be complicated, challenging, and potentially disruptive. To smooth that transition, features of the single-payer system that would cause the largest changes from the current system could be phased in gradually to minimize their impact. Policymakers would need to consider how quickly people with private insurance would switch their coverage to the new public plan, what would happen to workers in the health insurance industry if private insurance was banned entirely or its role was limited, and how quickly provider payment rates under the single-payer system would be phased in from current levels.

Coverage. In a single-payer system that achieved universal coverage, everyone eligible would receive health insurance coverage with a specified set of benefits regardless of their health status. Under the current system, CBO estimates, an average of 29 million people per month—11% of U.S. residents under age 65—were uninsured in 2018.5 Most (or perhaps all) of those people would be covered by the public plan under a single-payer system, depending on who was eligible.

A key design choice is whether noncitizens who are not lawfully present would be eligible. An average of 11 million people per month fell into that category in 2018, and they might not have health insurance under a single-payer system if they were not eligible for the public plan. About half of those 11 million people had health insurance in 2018.

In 2018, a monthly average of about 243 million people under age 65 had health insurance. About two-thirds of them, or an estimated 160 million people, had health insurance through an employer. Roughly another quarter of that population, or about 69 million people, are estimated to have been enrolled in Medicaid or the Children’s Health Insurance Program (CHIP).

Currently, national health care spending—which totaled $3.5 trillion in 2017—is financed through a mix of public and private sources, with private sources such as businesses and households contributing just under half that amount and public sources contributing the rest (in direct spending as well as through forgone revenues from tax subsidies). Shifting such a large amount of expenditures from private to public sources would significantly increase government spending and require substantial additional government resources. The amount of those additional resources would depend on the system’s design and on the choice of whether or not to increase budget deficits. Total national health care spending under a single-payer system might be higher or lower than under the current system depending on the key features of the new system, such as the services covered, the provider payment rates, and patient cost-sharing requirements.

It would probably have lower administrative costs than the current system—following the example of Medicare and of single-payer systems in other countries—because it would consolidate administrative tasks and eliminate insurers’ profits. Moreover, unlike private insurers, which can experience substantial enrollee turnover over time, a single-payer system without that turnover would have a greater incentive to invest in measures to improve people’s health and in preventive measures that have been shown to reduce costs. Whether the single-payer plan would act on that incentive is unknown.

An expansion of insurance coverage under a single-payer system would increase the demand for care and put pressure on the available supply of care.

A single-payer system would affect other sectors of the economy that are beyond the scope of this report. For example, labor supply and employees’ compensation could change because health insurance is an important part of employees’ compensation under the current system.

References

Rapier, R. 2019. The U.S. accounted for 98% of global oil production growth in 2018. Forbes

Posted in Health What to do | Tagged | 2 Comments

Cheddar Power

Preface. Oh how I love cheddar. When I hear that someone is a vegan I stare in disbelief. A life without cheese is a life not worth living, especially a life without cheddar. As a perpetually hungry child, if Mom was in the front room, I’d dash to the back of the house and get cheddar out of the refrigerator and slice off a small piece of cheese. If there is a substitute for oil, oh please let it be cheese!

Alice Friedemann   www.energyskeptic.com  author of “When Trucks Stop Running: Energy and the Future of Transportation”, 2015, Springer and “Crunch! Whole Grain Artisan Chips and Crackers”. Podcasts: Practical Prepping, KunstlerCast 253, KunstlerCast278, Peak Prosperity , XX2 report

***

Paraskova, T. 2019. Cheddar To The Rescue? UK Company Uses Cheese To Power 4,000 Homes. oilprice.com

Say Cheese

A UK dairy in Yorkshire has signed an agreement with a local biogas plant to supply it with a by-product of cheese-making that would be turned into thermal power to heat homes in the area.

The Wensleydale Creamery, which produces the Yorkshire Wensleydale cheese, makes 4,000 tons of cheese every year at its dairy in Hawes in the heart of the Yorkshire Dales.

The company has struck a deal with specialist environment fund manager Iona Capital, under which an Iona biogas plant will produce more than 10,000 MWh of energy per year from whey—a by-product of cheese making, Wensleydale Creamery said on Monday.

Under the deal, Wensleydale Creamery will provide Iona Capital’s Leeming Biogas plant in North Yorkshire with leftover whey from the process of cheese making. The plant will process and turn the whey into “green gas” via anaerobic digestion that will produce thermal power sufficient to heat 800 homes a year.

Iona Capital already has nine such renewable energy plants in Yorkshire, which save the equivalent of 37,300 tons of carbon dioxide (CO2) each year.

“Once we have converted the cheese by-product supplied by Wensleydale into sustainable green gas, we can feed what’s left at the end of the process onto neighbouring farmland to improve local topsoil quality. This shows the real impact of the circular economy and the part intelligent investment can play in reducing our CO2 emissions,” Mike Dunn, co-founder of Iona, said in a statement.

“The whole process of converting local milk to premium cheese and then deriving environmental and economic benefit from the natural by-products is an essential part of our business plan as a proud rural business. It is only possible as a result of significant and continued investments in our Wensleydale Creamery at Hawes and to sign this agreement and have the opportunity to convert a valuable by-product of cheese making into energy that will power hundreds of homes across the region will be fantastic for everyone involved,” Wensleydale Creamery’s managing director, David Hartley, said.   

Posted in Far Out | Tagged | 4 Comments

Pumped Hydro Storage (PHS)

Preface. This is the only commercial way to store energy now (CAES hardly counts with just one plant and salt domes to put more in existing in only 5 states). Though of course hydropower is only in a few states as well, 10 states have 80% of hydropower, and PHS needs to go far above existing reservoirs. There are very few places this could be done.

And the few places that exist are getting huge NIMBY opposition.

Alice Friedemann  www.energyskeptic.com Women in ecology  author of 2021 Life After Fossil Fuels: A Reality Check on Alternative Energy best price here; 2015 When Trucks Stop Running: Energy and the Future of Transportation”, Barriers to Making Algal Biofuels, & “Crunch! Whole Grain Artisan Chips and Crackers”.  Podcasts: Crazy Town, Collapse Chronicles, Derrick Jensen, Practical Prepping, KunstlerCast 253, KunstlerCast278, Peak Prosperity

***

Pumped hydro storage generates power by using electrically powered turbines to move water from a lower level at night uphill to a reservoir above.

During daylight hours when electricity demand is higher, the water is released to flow back downhill to spin electrical turbines. Locations must have both high elevation and space for a reservoir above an existing body of water.

Pumped hydro uses roughly 20–30 % more energy than it produces, with more electricity required to pump the water uphill than is generated when it goes downhill. Nonetheless, pumped hydro enables load shifting, and is important to balance wind and solar power.

Appearances can be deceiving: Pumped hydro is not a Rube Goldberg scheme. Many of you have used a kilowatt or two of pumped hydro yourself. PHS accounts for over 98 % of what little current energy storage exists in the United States, and is the only kind of commercial storage that can provide sustained power over 12 hours (typically, the other 12 hours are spent pumping the water up).

Existing PHS facilities store terawatts of power annually, but account for less than 2 % of annual U.S. power generation. In 2018, the United States had 22.9 gigawatts (GW) of pumped storage hydroelectric generating capacity, compared with 79.9 GW of conventional hydroelectric capacity. This isn’t likely to increase much, since like hydroelectric dams, there are few places to put PHS. Only two have been built since 1995, for a grand total of 43 in the U.S., with most of the technically attractive sites already used (Hassenzahl 1981).

Most were built between 1960 and 1990; nearly half of the pumped storage capacity still in operation was built in the 1970s (EIA 2019).

Existing PHS in the U.S. can store 22 GW, with the potential for another 34 GW more across 22 states, though high cost and environmental issues will prevent many from being built. Additionally, saltwater PHS could be built above the ocean along the West coast, but so far the high cost of doing so, shorter lifespan due to saltwater corrosion, distance from the grid, and concerns of salt seepage into the soil have prevented their development. Underground caverns and floating sea walls are other possibilities, but also aren’t commercial yet.

PHS has a very low energy density. To store the energy contained in just one gallon of gasoline requires over 55,000 gallons to be pumped up the height of Hoover Dam, which is 726 feet high (CCST 2012).

In 2011, pumped hydro storage produced 23 TWh of electricity across the U.S. However, those plants consumed 29 TWh moving water uphill, a net loss of 6 TWh.

So, how many PHS units would it take to give the U.S. that one day of electricity storage, 11.12 TWh? Over 365 days, our 43 existing pumped hydro plants produced two days of energy storage (23 TWh). Thus, the U.S. would need more than 7800 additional plants (365/2 * 43). Rube Goldberg, I can imagine what you would make of this.

FEW PLACES TO PUT MORE

Roger Andrews looked at where PHS seawater reservoirs could be put all over the world and found only three where a combination of favorable shoreline topography and minimal impacts would allow any significant amount of SWPH to be developed – Chile (discussed here), California (discussed here) and, of all places, Croatia (Andrews 2018).

Andrews R (2018) The seawater pumped hydro potential of the world. Energy Matters. http://euanmearns.com/the-seawater-pumped-hydro-potential-of-the-world/

NIMBY

The Navajo are objecting to three PHS in the Black Mesa. They cite the projects’ potential harm to water resources, traditional land uses and wildlife, and the developer’s failure to obtain consent from local communities before seeking federal approval. The projects propose eight new reservoirs across 38,000 acres. Filling them would require 450,000 acre-feet of water, an enormous share of the remaining Colorado River flows. Even under the best-case scenario, up to 8,000 acre-feet would be lost to evaporation each year, which is nearly double the rate of aquifer depletion from historical coal extraction. The applications list the aquifers beneath Black Mesa and the Colorado and San Juan rivers as potential water sources but provide no evidence of availability or legal rights to those sources (CBS 2023).

References

CBS (2023) 18 Navajo Chapters Oppose Huge Pumped Storage Projects Threatening Arizona’s Black Mesa. Center for Biological diversity. https://biologicaldiversity.org/w/news/press-releases/18-navajo-chapters-oppose-huge-pumped-storage-projects-threatening-arizonas-black-mesa-2023-07-14/

CCST. 2012. California’s energy future: electricity from renewable energy and fossil fuels with carbon capture and sequestration. California: California Council on Science and Technology.

Hassenzahl, W.V. ed. 1981. Mechanical, thermal, and chemical storage of energy. London: Hutchinson Ross.

Posted in Dams, Energy Production, Hydropower, Pumped Hydro Storage (PHS) | Tagged , , , , , | 15 Comments

The 10 countries with the most endangered species in the world

I don’t know whether to go to these countries to see these beautiful creatures before they’re extinct, or to spend my money on countries like Costa Rica and Tanzania that have set aside a quarter or more of their land to preserve biodiversity.

An excessive number of people using half the land and what it produces on the planet is what’s driving exitinction. Interesting how many of these nations where species are going to be permanently extinct don’t allow abortions and getting birth control can be difficult. So I’ve added whether a nation allows abortion and has birth control to the statistics.

One of the first acts of the Trump administration in January 2017 was to cut the funding for abortions and contraception, which has made it hard for hundreds of thousands of women to get birth control

Alice Friedemann   www.energyskeptic.com  author of “When Trucks Stop Running: Energy and the Future of Transportation”, 2015, Springer and “Crunch! Whole Grain Artisan Chips and Crackers”. Podcasts: Practical Prepping, KunstlerCast 253, KunstlerCast278, Peak Prosperity, XX2 report

***

Madden, D. 2019. Ranked: the ten countries with the most endangered species in the world. Forbes.

Industry, pollution, agriculture, deforestation, air travel and decreasing habitats are conspiring to make it very hard for thousands of species to survive, let alone flourish. And that truth stretches to every corner of the world, be it forest, mountain, reef, ocean, city or savannah.

The International Union for Conservation of Nature (IUCN) Red List has been the world’s foremost information source on the global conservation status of animal, fungi and plant species since 1964. It currently lists an astounding 27,000 species as at risk of extinction, which is an even more astounding 27% of all species we currently know about. 

  • 40% of all amphibians
  • 34% of conifers
  • 33% of reef corals
  • 31% of sharks and rays
  • 27% of crustaceans
  • 25% of mammals
  • 14% of birds

#1 Mexico: 665 endangered species

71 birds, 96 mammals, 98 reptiles, 181 fish, 219 amphibians

Why? Mexico has one of the highest deforestation rates in the world to make more farmland available to feed an ever growing population, which may double by 2050.  This is because of restrictions on abortions in most states, and abortion not being decriminalized until 2007 and contraceptives prohibited until the late 1960s (Wiki 2019)

#2 Indonesia: 583   191 mammals, 160 birds

Contraception is only available on the black market and abortion in back alley clinics for many women. A legal abortion is hard to obtain (GI 2008)

#3 Madagascar: 553  

Abortion is illegal.

#4 India: 542  

Despite six decades of family planning promotion, contraceptive prevalence rate in India remains poor, particularly in the three North Indian states where 18 percent of the population lives

#5 Columbia: 540  

Only allows abortion for rape, incest, or the mother is at risk, and hard to get. But birth control is available.

#6 USA 475  

#7 Ecuador: 436  

Only allows abortion if the mother is at risk, illegal even in cases of rape, incest, and severe fetal impairment. But birth control is available.

#8 China: 435  

#9 Brazil: 414

Abortion is prohibited in all circumstances, though a woman who was raped or whose life is in danger won’t go to jail.  Birth control is legal.

#10 Peru: 385

Only allows abortion if the mother is at risk. If a woman has an illegal abortion she may spend up to 2 years in prison, and the person who performed the abortion from 1 to 6 years.  Birth control is available. It’s hard to get the morning after pill, and it was discovered that 25% of them are fake.

References

GI. 2008. Abortion in Indonesia. Guttmacher Institute.

Wiki. 2019. Abortion in Mexico and Women in Mexico.

Posted in Biodiversity Loss, Deforestation | Tagged , , , | 3 Comments

The carbon trap by Paul Chefurka

Preface. We are caught in the carbon trap — we utterly depend on fossils that don’t have an electric replacement. Someday people will figure this out the hard way, but Chefurka compassionately points out that there is no one to blame for our situation, and it’s not something we can do anything about.

Here are just a few ways our lives depend on fossils:

  • Petroleum diesel powers the transportation that matters: heavy-duty trucks, rail, and ships
  • Manufacturing depends on process heat and steam generated by fossil fuels    
  • Energy to keep the electric grid up around the clock  
  • The majority of people alive today should thank natural-gas based fertilizers, and oil-based pesticides, herbicides, and insecticides   
  • Half a million products are made out of fossil fuels and with energy from fossil fuels
  • The natural gas that heats homes and businesses.   About 90% of homes and businesses depend on fossil fuels for heat, mainly natural gas  (EIA 2018). Generating heat from electricity today is terrifically wasteful.  Two-thirds of electricity is generated by burning natural gas and coal, and two-thirds of this coal and natural gas energy vanishes as heat, plus another 6-10% is lost on the wires, so only 24 to 28% arrives at homes and businesses.  It’s far better to use fossils onsite to generate heat.

Alice Friedemann  www.energyskeptic.com  Author of Life After Fossil Fuels: A Reality Check on Alternative Energy; When Trucks Stop Running: Energy and the Future of Transportation”, Barriers to Making Algal Biofuels, & “Crunch! Whole Grain Artisan Chips and Crackers”.  Women in ecology  Podcasts: WGBH, Jore, Planet: Critical, Crazy Town, Collapse Chronicles, Derrick Jensen, Practical Prepping, Kunstler 253 &278, Peak Prosperity,  Index of best energyskeptic posts

***

Whether we realize it or not, everyone living on planet Earth today is caught in what I have come to call the “carbon trap”. The nature of the trap is simple, and can be described in one sentence:

Our continued existence depends on the very thing that is killing us – the combustion of our planet’s ancient stocks of carbon.

This unfortunate situation was not intentional, and is no one’s fault.

The trap was constructed well outside of our conscious view or understanding.

Its design came from our evolved desires for status, material comfort and security.

We recognized its seductive promise long before we knew enough science to discover its hidden hook.

It was built with the best of intentions by well-meaning scientists and engineers, whose knowledge of the consequences was both incomplete and clouded by their own evolved desire for a better life.

Most of us, even those who are aware of our predicament, distract ourselves by creating and admiring elaborate and luxurious appointments for our carbon-clad prison.

Many who can see the bars spend their time dreaming of ways to slip through them into the world outside – a world of natural freedom that they can see but never reach.

Those who are fully aware of the trap also understand that we now need it to survive; that leaving it (if that were even possible) would be as fatal as staying inside. We are victims of what complex systems scientists call “path dependence” – where we came from and how we got here puts strict limits on what is now possible for us to do.

One of the things we can’t do is simply open the door and leave. Even the fact that our carbon-barred prison is now on fire can’t change the cold equations. We are condemned to wait here until the walls burn down, when a few soot-blackened survivors may stumble out into the blasted and barren landscape left behind by our self-absorbed construction project.

This is why I believe that the one quality most needed in the world today is compassion.


Posted in Human Nature, Interdependencies, Paul Chefurka | Tagged , , | 13 Comments

How Much Oil is in an Electric Vehicle? by Nicholas LePan

LePan shows how plastics, made from fossil fuels, make up so much of a car, plus lighten the weight so the car can go further on gasoline.

Since fossil fuels are finite, many assume we’ll just make them out of plants in the future. But that’s really hard, biomass has too much other junk that needs to be removed, oxygen, phosphorous, and another 20 or so elements. These need to be removed or the many of the process steps will not work and a low quality plastic produced.

To illustrate the problem, consider that the chemical composition of plants is one reason cellulosic ethanol is not yet commercial. It’s just too difficult to break lignocellulose down into fermentable sugars. Even if you came up with the perfect enzyme for corn stover to break it down, a different hybrid and very likely some other kind of planet entirely might have a dissimilar enough chemistry to keep the enzyme from being effective.

Creating plastics from biomass also has a negative energy return: you’ve got to plant, harvest, deliver biomass to the plastics plant and use it before it composts. Then you’ll need even more biomass to power the dozens of steps (since fossil fuels are finite), fabricate the plastic to the desired shape, deliver it, and install it in an auto.

Plastics are by far the hardest to make, harder than all the other components of a toaster as you can see in this post “Toasters are toast

Alice Friedemann   www.energyskeptic.com  author of “When Trucks Stop Running: Energy and the Future of Transportation”, 2015, Springer and “Crunch! Whole Grain Artisan Chips and Crackers”. Podcasts: Practical Prepping, KunstlerCast 253, KunstlerCast278, Peak Prosperity , XX2 report

***

LePan, N. May 20, 2019. How Much Oil is in an Electric Vehicle? visualcapitalist.com

How Much Oil is in an Electric Vehicle?

How Much Oil is in an Electric Vehicle?

When most people think about oil and natural gas, the first thing that comes to mind is the gas in the tank of their car. But there is actually much more to oil’s role, than meets the eye…

Oil, along with natural gas, has hundreds of different uses in a modern vehicle through petrochemicals.

Today’s infographic comes to us from American Fuel & Petrochemicals Manufacturers, and covers why oil is a critical material in making the EV revolution possible.

Pliable Properties

It turns out the many everyday materials we rely on from synthetic rubber to plastics to lubricants all come from petrochemicals.

The use of various polymers and plastics has several advantages for manufacturers and consumers:

  1. Lightweight
  2. Inexpensive
  3. Plentiful
  4. Easy to Shape
  5. Durable
  6. Flame Retardant

Today, plastics can make up to 50% of a vehicle’s volume but only 10% of its weight. These plastics can be as strong as steel, but light enough to save on fuel and still maintain structural integrity.

This was not always the case, as oil’s use has evolved and grown over time.

Not Your Granddaddy’s Caddy

Plastics were not always a critical material in auto manufacturing industry, but over time plastics such as polypropylene and polyurethane became indispensable in the production of cars.

Rolls Royce was one of the first car manufacturers to boast about the use of plastics in its car interior. Over time, plastics have evolved into a critical material for reducing the overall weight of vehicles, allowing for more power and conveniences.

Timeline:

  • 1916
    Rolls Royce uses phenol formaldehyde resin in its car interiors
  • 1941
    Henry Ford experiments with an “all-plastic” car
  • 1960
    About 20 lbs. of plastics is used in the average car
  • 1970
    Manufacturers begin using plastic for interior decorations
  • 1980
    Headlights, bumpers, fenders and tailgates become plastic
  • 2000
    Engineered polymers first appear in semi-structural parts of the vehicle
  • Present
    The average car uses over 1000 plastic parts

Electric Dreams: Petrochemicals for EV Innovation

Plastics and other materials made using petrochemicals make vehicles more efficient by reducing a vehicle’s weight, and this comes at a very reasonable cost.

For every 10% in weight reduction, the fuel economy of a car improves roughly 5% to 7%. EV’s need to achieve weight reductions because the battery packs that power them can weigh over 1000 lbs, requiring more power.

Today, plastics and polymers are used for hundreds of individual parts in an electric vehicle.

Oil and the EV Future

Oil is most known as a source of fuel, but petrochemicals also have many other useful physical properties.

In fact, petrochemicals will play a critical role in the mass adoption of electric vehicles by reducing their weight and improving their ranges and efficiency. In According to IHS Chemical, the average car will use 775 lbs of plastic by 2020.

Although it seems counterintuitive, petrochemicals derived from oil and natural gas make the major advancements by today’s EVs possible – and the continued use of petrochemicals will mean that both EVS and traditional vehicles will become even lighter, faster, and more efficient.

Posted in Automobiles | Tagged , , , , | 6 Comments

Can concentrated solar power be used to generate industrial process heat?

Preface. The bright future of solar thermal powered factories, makes some important points about using concentrated solar power to generate heat:

“…A large share of energy consumed worldwide is by heat. Cooking, space heating and water heating dominate domestic energy consumption. In the UK, these activities account for 85% of domestic energy use, in Europe for 89% and in the USA for 61%. Heat also dominates industrial energy consumption. In the UK, 76% of industrial energy consumption is heat. In Europe, this is 67%. Few things can be manufactured without heat.

Although it is perfectly possible to convert electricity into heat, as in electric heaters or electric cookers, it is very inefficient to do so. It is often assumed that our energy problems are solved when renewables reach ‘grid parity’ – the point at which they can generate electricity for the same price as fossil fuels. But to truly compete with fossil fuels, renewables must also reach ‘thermal parity‘.

It still remains significantly cheaper to produce heat with oil, gas or coal than with a wind turbine or a solar panel.

In today’s solar thermal plants, solar energy is converted into steam (via a steam boiler), which is then converted into electricity (via a steam turbine that drives an electric generator). This process is just as inefficient as converting electricity into heat: two-thirds of energy gets lost when converted from steam to electricity. If we were to use solar thermal plants to generate heat instead of converting this heat into electricity, the technology could deliver energy 3 times cheaper than it does today.

43% of industrial heat demand in Europe is above 400 °C (752 °F). These include many of the industrial processes that we need to manufacture renewable energy sources (wind turbines, solar panels, flat plate collectors and solar concentrators) as well as other green technologies (like LEDs, batteries and bicycles). Examples include the production of glass (requiring temperatures up to 1,575 °C/2870 F) and cement (1,450 °C / 2640 F), the recycling of aluminum (660 °C / 1220 F) and steel (1,520 °C / 2770 F), the production of steel (1,800 °C / 3275 F) and aluminum (2,000 °C / 3600 F) from mined ores, the firing of ceramics (1,000 to 1,400 °C / 1830 to 2550 F) and the manufacturing of silicon microchips and solar cells (1,900°C / 3450 F )“.

Matt Egan (2019) has an article on CNN titled “Secretive energy startup backed by Bill Gates achieves solar breakthrough“. This big breakthrough will allow a solar oven to generate 1000 C (1800 F). As you can see from the above industrial products that’s not nearly enough.

These concentrated solar power contraptions can only be constructed in areas with almost no water in the atmosphere, mainly the desert Southwest in the U.S.

Heat can’t travel far. it’s too hard to transfer hot fluids like steam more than a few hundred meters, while electricity can be sent for hundreds of miles.  So solar collectors need to be next to the manufacturing plant. 

The CSP in Egan’s article uses mirrors to concentrate sunlight into a very small area. That means Ford, DuPont, U.S. Steel and all other industries that need cement or metal will need to move to the Southwest right next to the CSP plant (so far, CSP plants have cost about $1 billion each) and fight over which piece of a companies product can be made in the tiny area where the solar rays are concentrated during the brief 10 am to 2 pm window when high heat can be generated. 

Oh, you say. Each company can build their own $1 billion CSP plant. That won’t be easy. Siting a CSP plant is difficult, because most of the suitable land is federal, and it can take quite a long time to get permission to build on protected federal land. It’s also hard to get permits for water in these dry regions, since cities and agriculture are usually considered to be more important and CSP competes with agriculture for level land with less than a 1% slope.  CSP locations are far from rivers and lakes, making groundwater the only possible source of water.  In Arizona, it is hard to get permission to obtain groundwater without a grandfathered water right on that land or get a special permit in many regions.

Let’s hope industries don’t need water for anything!  Current estimates indicate that operational CSP plants use at least 620 acre-feet per year.   That’s 765,000 cubic meters of water, 202 million gallons in the desert regions of the Southwest (Arizona, California, and Nevada).   CSP facilities with wet cooling can consume more water per unit of electricity generated than traditional fossil fuel facilities using wet cooling.

Alice Friedemann   www.energyskeptic.com  author of “When Trucks Stop Running: Energy and the Future of Transportation”, 2015, Springer and “Crunch! Whole Grain Artisan Chips and Crackers”. Podcasts: Derrick Jensen, Practical Prepping, KunstlerCast 253, KunstlerCast278, Peak Prosperity , XX2 report

***

Kurup, P., et al. 2015. Initial Investigation into the Potential of CSP Industrial Process Heat for the Southwest United States. National Renewable Energy Laboratory.

Alice Friedemann   www.energyskeptic.com  author of “When Trucks Stop Running: Energy and the Future of Transportation”, 2015, Springer and “Crunch! Whole Grain Artisan Chips and Crackers”. Podcasts: Practical Prepping, KunstlerCast 253, KunstlerCast278, Peak Prosperity , XX2 report

***

Industries use enormous amounts of fossil fuels to generate heat and electricity to make products like steel, cement, chemicals, glass, and refine petroleum, with nearly three-quarters of energy used in the form of heat. Industry uses 30% of all energy, and 83% of that energy is generated by fossil fuels mainly to create process heat directly, indirectly with steam heat, or to generate electricity at the factory for reliability and to operate machine drive equipment (EI 2010).

This image has an empty alt attribute; its file name is CSP-to-generate-high-heat-needed-by-industry.jpg

It is possible for a Parabolic Trough collector (PTC), which looks like a giant upended cattle trough, to make some of this industrial heat and replace some of the fossil fuels used (mainly natural gas).

But the industrial uses this concentrated solar power collection is most useful for are heat applications from 110 to 220 C (230 – 430 F), especially those processes that use pressurized water or steam.

So that leaves quite a few very important industries out, since they use 2000 F heat or more, such as iron, steel, fabricated metals, transportation equipment (cars, trucks), computers, electronics, aluminum, cement, glass, machinery, and foundries.

Industries where solar industrial process heat (SIPH) might be used are paper, dairy, food, beer, chemicals, and washing/cleaning.   No doubt some processes within other industries like plastics and rubber, textiles, and others also have a need for industrial process heat that’s less than 430 F.

NREL isn’t proposing gigantic, billion dollar concentrated solar power collectors like the ones that take up miles of land in the deserts of California, Nevada, and Arizona.

Rather they suggest that much smaller facilities could be built.  Have been built actually, Frito Lay set aside 5 acres to use heat to fry potato chips in Modesto, California.  Prestage Foods in North Carolina also has 7 acres of PTC to heat 100,000 gallons of water a day for their turkey processing operations.  Currently there are 16 other SIPH plants (9 food & dairy, 4 breweries, 2 desalination & water treatment, 1 subway washing).

Another reason these plants need to be small and local is that unlike electricity, it’s too hard to transfer hot fluids like steam more than a few hundred meters, while electricity can be sent for hundreds of miles.  So solar collectors need to be next to the manufacturing plant. 

But SIPH can barely make a dent in the industrial process heat required.  In 2013 a German study found that solar heat generation could only replace 3.4% of overall industrial heat demands.  This 3.4% would require 16 Terawatt hours (TWh) a year, which would require 46 Nevada Solar One plants.  This plant cost $266 million, so that’s $12.2 billion for this small fraction of manufacturing.

Like all electricity generating contraptions, PTC and other concentrated solar power collectors can’t outlast the age of oil, since their life cycle depends on fossil fuels from beginning to end — from mining, ore crushing, metal smelting and fabrication, transportation by diesel trucks, ships, and trains, and finally delivery with een more diesel. If solar collectors were good at generating the 3000 F temperatures needed by iron, steel, and aluminum, or the 2700 F needed by cement these contraptions, then they’d come closer than wind or solar PV towards replacing fossils and being able to make themselves from their own energy, but that simply isn’t the case.

Just look at the materials needed for a 1 Gigawatt Parabolic trough collector:

                                                                High heat

Material               Tons                      > PTC  can generate

Water            12,000,000

Rock                 1,300,000

Iron                        650,000 Yes

NaNO3                 340,000

Cement                                250,000 Yes

Steel                      240,000 Yes

Sodium Nitrate 220,000

Limestone           170,000

Glass                     130,000 Yes        

Silicon sand           92,000

Table 1. Materials needed per GW for a parabolic trough collector (Pihl 2012)

In addition thousands of tons of Copper (3200), Chromium (2200), Foam glass (2500), Magnesium (3000), Manganese (2000), Rock Wool (4700), Soda Ash (18,000), and hundreds of tons of Aluminum (740),  Fibreglass (310), Molybdenum (200), Polypropylene (500), Zinc (650) and many more materials as well.

The years of reserve life for many aren’t far off Iron (33), Copper (39), Manganese (48), Chromium (16), Nickel (49), Molybdenum (43), Niobium (48), and Silver (25), so solar collector contraptions, if not limited by oil, natural gas, and coal for their construction will be limited by their materials.

References

EI. 2010. Manufacturing Energy and Carbon Footprint Sector: All Manufacturing (NAICS 31-33). Energetics Incorporated for the U. S. Department of Energy

Pihl, E., et al. 2012. Material constraings for concentrating solar thermal power.

Related posts:

Posted in Concentrated Solar Power, Energy Infrastructure, Manufacturing & Industrial Heat | Tagged , , , , , , | 6 Comments

Concentrated Solar Power can only exist in deserts and use too much water

What follows is my summary of:

Bracken, N., et al. 2015. Concentrating solar power and water issues in the U.S. Southwest. U.S. department of energy, National renewable energy lab.

Alice Friedemann   www.energyskeptic.com  author of “When Trucks Stop Running: Energy and the Future of Transportation”, 2015, Springer and “Crunch! Whole Grain Artisan Chips and Crackers”. Podcasts: Derrick Jensen, Practical Prepping, KunstlerCast 253, KunstlerCast278, Peak Prosperity , XX2 report

***

Concentrated Solar Power plants can only be built in desert regions with huge amounts of direct sunlight.  But these are usually the most water scarce regions in the nation and nearly all of them are in the deserts of Arizona, California, and Nevada. 

CSP requires water in construction, the steam cycle, process cooling, and cleaning of solar collectors or mirrors.

If the grid were ever to become 100% renewable, CSP would play a key role, because it can be built with thermal storage to keep the grid up long after the sun goes down.

However, only one CSP plant of 39 has thermal storage, so this probably won’t happen.  And at a billion dollars per plant not many more are likely to be built either (i.e. the 392 MW Ivanpah cost $2.2 billion on 3,600 acres). At $7,100/kW per CSP plant, it’s much cheaper to build natural gas ($1,100), Solar PV ($2,900), or coal ($3,600) electricity generating facilities.

No wonder only 0.03% of electricity is generated using CSP.

Yet CSP in a fossil-free world will be essential to generate the very high heat needed in manufacturing, much of it steam heat which requires enormous amounts of water.  The only other source of non-fossil, renewable high heat is charcoal from wood. 

The following industries need heat of up to 3275 F: Chemicals, Forest products, Iron and Steel, Plastics & Rubber, Fabricated metals, Transport Equipment, Computers, electronics & equipment, Aluminum, Cement, Glass, Machinery, Foundries. For most of these products, there is no alternative electric process.

The only industries that can get by without high heat are the food, beverage and textile industries. 

Though water alone is a showstopper, it’s also equally unlikely that industries across America would move to the desert Southwest to build factories even if there were plentiful water.

It is also questionable how sustainable this is. How long would these aquifers last? There would be very little recharge at just a few inches of rain a year, limiting how much water can be withdrawn sustainably.

Siting a CSP plant is difficult, because most of the suitable land is federal, and it can take quite a long time to get permission to build on protected federal land. It’s also hard to get permits for water in these dry regions, since cities and agriculture are usually considered to be more important and CSP competes with agriculture for level land with less than a 1% slope.  CSP locations are far from rivers and lakes, making groundwater the only possible source of water.  In Arizona, it is hard to get permission to obtain groundwater without a grandfathered water right on that land or get a special permit in many regions.

Current estimates indicate that operational CSP plants use at least 620 acre-feet per year.   That’s 765,000 cubic meters of water, 202 million gallons in the desert regions of the Southwest (Arizona, California, and Nevada). 

CSP facilities with wet cooling can consume more water per unit of electricity generated than traditional fossil fuel facilities using wet cooling.

If all of the expected CSP projects are completed, most will be wet-cooled and require 221,000 acre feet a year, with dry-cooled using 18,000 acre feet per year.  Because wet-cooled plants use so much more water than dry-cooled, California and Nevada have tried to limit them, and Arizona may well do so as well.  So 9 of the 15 future CSP projects under construction will be dry-cooled, hybrid-cooled, or use reclaimed water.

But wet-cooled plants are more efficient than dry-cooled, and dry-cooled electricity generation drops off at temperatures above 100°F when generation is needed the most to meet summer peak electricity demand.  Dry-cooled plants also need to employ massive cooling fans to remove heat from the pipe array since air has far less ability to lower heat than water does.  These fans consume electricity being generated at the CSP plant, which not only subtracts from the amount of energy generated, it reduces the thermal efficiency of the steam turbines.

If significant amounts CSP power generated were transmitted to other states, the result would be a virtual export of scarce water to other states.   

Related post:

Concentrated Solar Power: Water Constraints

References

CRS. 2009. Water Issues of Concentrating Solar Power (CSP) Electricity in the U.S. Southwest. Congressional Research Service.

USGAO. September 2012. ENERGY-WATER NEXUS. Coordinated Federal Approach Needed to Better Manage Energy and Water Tradeoffs GAO-12-880 U.S. Government Accountability Office.

Posted in Concentrated Solar Power, Electricity Infrastructure | Tagged , , , | 1 Comment

Saudi oil infrastructure at risk from drone attacks

Preface. This NYT article was published 4 months ago, and its warning just came true. Quite prescient!

Drones make it pretty easy to anonymously attack the thousands of miles of pipelines across the Arabian peninsula, oil tankers, pumping stations, and refineries. The Saudis counter that they’ve spent quite a bit to protect their infrastructure, but now that drones can be launched 1,000 miles away to accurately hit targets, whatever protections they have may not be enough, because they can evade the kingdom’s main air defenses, which are intended to repel missiles and aircraft rather than smaller objects.

At least as great a threat is Iran or some other nation using cyber warfare to damage the petroleum infrastructure of Saudi Arabia and its neighbors.

Peak oil production can not only happen for geological reasons. Politics (war) can also bring peak production about, making the collapse of civilization happen that much sooner, and perhaps a lot of oil left in the ground, which climate activists should love.

Alice Friedemann   www.energyskeptic.com  author of “When Trucks Stop Running: Energy and the Future of Transportation”, 2015, Springer and “Crunch! Whole Grain Artisan Chips and Crackers”. Podcasts: Practical Prepping, KunstlerCast 253, KunstlerCast278, Peak Prosperity , XX2 report

***

Reed, S. May 17, 2019. Saudi Oil Infrastructure at Risk as Small Attacks Raise Potential for Big Disruption. New York Times.

Saudi Arabia spent heavily to protect its oil production lines but rapid changes in technology may mean ports and pipelines are increasingly exposed in the turbulent region.

Across the Arabian peninsula, thousands of miles of pipes run above and below the desert in one of the world’s most sophisticated production lines for pumping oil from the ground and distributing it around the world. This vast system of oil fields, refineries and ports has largely run like clockwork despite political turbulence across the region.

Then a drone strike claimed by Houthi rebels this week forced the Saudis to temporarily halt the flow of a crucial oil artery to the west side of the country. The assault came a day after mysterious incidents damaged two Saudi tankers and two other ships in a key port in the United Arab Emirates.

These were perhaps the most serious attacks on the kingdom’s oil infrastructure since Al Qaeda militants were thwarted trying to blow up a key Saudi facility at Abqaiq in 2006.

While American officials are still trying to determine whether Iran was behind these incidents, the question for the oil market is how well the Saudi and Persian Gulf infrastructure is protected and whether, with tensions building in the region, it could survive a conflict with Iran.

Analysts and executives of Saudi Aramco, the national oil company, say the kingdom has spent heavily to protect the industry that is its lifeblood. Key Saudi installations are tightly guarded and protected by missile batteries and other weaponry. “Security systems were bulked up in the 2000s amid the Al Qaeda threat, including the 2006 attack on the Abqaiq facility,” said Ben Cahill, manager for research & advisory, at Energy Intelligence, a research firm. “The country’s oil fields, refineries and pipelines are blanketed by surveillance and remote sensing.”

In light of that security effort, Mr. Cahill and other analysts concede that it was eye-opening, even shocking, that a drone apparently launched from as far as 500 miles away in Yemen, managed to cross deep into Saudi Arabia and cause damage.

It was also worrisome and even embarrassing that someone managed to damage tankers in waters off Fujairah, a vital port in the United Arab Emirates where ships take on fuel and provisions on their way in and out of the Gulf.

Despite the security spending of the last decade, rapid changes in technology may mean that the Saudi infrastructure is more exposed than previously thought, analysts say. United Nations experts have estimated, for instance, that drones used by the Houthis have a range of nearly 1,000 miles allowing them to reach well into Saudi Arabia. “The simple fact that they managed to reach tankers and a pipeline” is meaningful, said Riccardo Fabiani, a geopolitical analyst at Energy Aspects, a market research firm. “It means they could strike at the heart of Saudi interests if they wanted to.”

Iran is well-placed for inflicting pain in the no-war-no-peace existence in the region. Analysts say it is proficient at using relatively cheap unconventional weapons like drones and speed boats, and at covering its tracks. It can also make use of proxies including the Houthi rebels, who claimed responsibility for the pipeline attack.

Analysts say that drones could prove to be a nuisance for producers like the Saudis. It would be difficult if not impossible to protect an entire pipeline system, and even concentrating air defense units around key points like pumping stations, which were hit this week, would mean taking these defenses from somewhere else.

Drones may also be able to evade the kingdom’s main air defenses, which are intended to repel missiles and aircraft rather than smaller objects. Jeremy Binnie, a Middle East and Africa defense specialist at Jane’s Defense Weekly, said that satellite imagery showed that the key Saudi export terminal at Ras Tanura was guarded by batteries of sophisticated United States-made Hawk surface-to-air missiles. But these weapons “might not be able to engage the UAVs (drones) that Iran has developed with small radar cross sections,” he said.

Another concern is that Iran, which is regarded as skilled in digital hacking, could use cyber warfare to damage the petroleum infrastructure of Saudi Arabia and its neighbors.

At Saudi Aramco, activities like drilling wells, pumping oil to the surface, and loading the fuel on tankers can all be monitored and managed remotely. Such sophistication, though, may also create openings for attack. “A lot of those movements are run out of a central command center at Saudi Aramco headquarters,” said Phillip Cornell, a fellow at the Atlantic Council, a Washington-based research institution, who previously worked at Aramco as a senior corporate planning adviser.

Mr. Cornell said that Aramco officials suspected Iran was responsible for a cyber attack earlier in this decade and that “there has been a lot of investment to reinforce those cyber security defenses.”

However, analysts say the cyber vulnerabilities remain a major worry. “I think cyber is the really underappreciated risk,” said Helima Croft, an oil analyst at RBC Capital markets, an investment bank.


Posted in Middle East, Oil & Gas, Peak Oil | Tagged , , , | Comments Off on Saudi oil infrastructure at risk from drone attacks