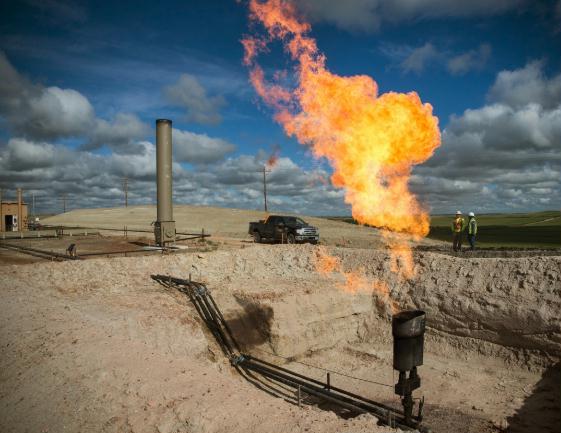
Preface. As early as 2011 experts were questioning how large fracked natural gas reserves were.
The latest IEA 2018 report predicts shale oil/gas could start to decline by 2025, and all global oil as soon as 2023.
Shale oil and gas might not even exist without super low interest rates making it quite easy to borrow money, as Bethany McLean writes in her book “Saudi America”. And even though these companies are $300 billion in debt, as long as they can get money, they’ll continue to drill. Some day the dumb middle-class money will be surprised that their 401K and other high interest mutual funds and bonds have crashed after the next economic crash.
Jeremy Leggett’s slide show on fracking has many interesting observations, including that:
- China has the biggest shale resource in the world on paper, but 80% is below 3,500 meters (11,500 feet), far beyond the range of hydraulic fracturing.” Fracking hasn’t been successful anywhere but in America, and it has arguably not been very successful given how much money has been lost.
- UK shale gas reserves may hold only 5-7 years supply, not the 50 reported in the BGS study.
Developing shale gas in China is much more difficult than in the U.S. due to a lack of adequate infrastructure to remote mountainous regions where most of the Chinese shale resources lie, low well productivity, marginal economics, and deeper wells with severe geological constraints, requiring major technological breakthroughs (Paraskova 2021).
Developing fracked natural gas anywhere but the U.S. is a problem — there is no existing oil and gas pipeline infrastructure, there are not enough fracking workers with expertise in the United States, and virtually none in foreign countries, there is stronger opposition in other nations quite often, the rules of being able to drill on land are much harder to overcome, a lack of fracking sand, and much more. So although China, Poland, Argentina and many other nations may have fracked oil and gas, the cost to develop it will probably prevent this from happening, plus all of the factors above.
Alice Friedemann www.energyskeptic.com Author of Life After Fossil Fuels: A Reality Check on Alternative Energy; When Trucks Stop Running: Energy and the Future of Transportation”, Barriers to Making Algal Biofuels, & “Crunch! Whole Grain Artisan Chips and Crackers”. Women in ecology Podcasts: WGBH, Planet: Critical, Crazy Town, Collapse Chronicles, Derrick Jensen, Practical Prepping, Kunstler 253 &278, Peak Prosperity, Index of best energyskeptic posts
***
Cunningham, N. 2019. The Shale Boom Is About To Go Bust. oilprice.com
The shale industry faces an uncertain future as drillers try to outrun the treadmill of precipitous well declines.
For years, companies have deployed an array of drilling techniques to extract more oil and gas out of their wells, steadily intensifying each stage of the operation. Longer laterals, more water, more frac sand, closer spacing of wells – pushing each of these to their limits, for the most part, led to more production. Higher output allowed the industry to outpace the infamous decline rates from shale wells.
In fact, since 2012, average lateral lengths have increased 44 percent to over 7,000 feet and the volume of water used in drilling has surged more than 250 percent, according to a new report for the Post Carbon Institute. Taken together, longer laterals and more prodigious use of water and sand means that a well drilled in 2018 can reach 2.6 times as much reservoir rock as a well drilled in 2012, the report says.
That sounds impressive, but the industry may simply be frontloading production. The suite of drilling techniques “have lowered costs and allowed the resource to be extracted with fewer wells, but have not significantly increased the ultimate recoverable resource,” J. David Hughes, an earth scientist, and author of the Post Carbon report, warned. Technological improvements “don’t change the fundamental characteristics of shale production, they only speed up the boom-to-bust life cycle,” he said.
For a while, there was enough acreage to allow for a blistering growth rate, but the boom days eventually have to come to an end. There are already some signs of strain in the shale patch, where intensification of drilling techniques has begun to see diminishing returns. Putting wells too close together can lead to less reservoir pressure, reducing overall production. The industry is only now reckoning with this so-called “parent-child” well interference problem.
Also, more water and more sand and longer laterals all have their limits. Last year, major shale gas driller EQT drilled a lateral that exceeded 18,000 feet. The company boasted that it would continue to ratchet up the length to as long as 20,000 feet. But EQT quickly found out that it had problems when it exceeded 15,000 feet. “The decision to drill some of the longest horizontal wells ever in shale rocks turned into a costly misstep costing hundreds of millions of dollars,” the Wall Street Journal reported earlier this year.
Ultimately, precipitous decline rates mean that huge volumes of capital are needed just to keep output from declining. In 2018, the industry spent $70 billion on drilling 9,975 wells, according to Hughes, with $54 billion going specifically to oil. “Of the $54 billion spent on tight oil plays in 2018, 70% served to offset field declines and 30% to increase production,” Hughes wrote.
As the shale play matures, the field gets crowded, the sweet spots are all drilled, and some of these operational problems begin to mushroom. “Declining well productivity in some plays, despite application of better technology, are a prelude to what will eventually happen in all plays: production will fall as costs rise,” Hughes said. “Assuming shale production can grow forever based on ever-improving technology is a mistake—geology will ultimately dictate the costs and quantity of resources that can be recovered.”
There are already examples of this scenario unfolding. The Eagle Ford and Bakken, for instance, are both “mature plays,” Hughes argues, in which the best acreage has been picked over. Better technology and an intensification of drilling techniques have arrested decline, and even led to a renewed increase in production. But ultimate recovery won’t be any higher; drilling techniques merely allow “the play to be drained with fewer wells,” Hughes said. And in the case of the Eagle Ford, “there appears to be significant deterioration in longer-term well productivity through overcrowding of wells in sweet spots, resulting in well interference and/or drilling in more marginal areas that are outside of sweet-spots within counties.”
In other words, a more aggressive drilling approach just frontloads production, and leads to exhaustion sooner. “Technology improvements appear to have hit the law of diminishing returns in terms of increasing production—they cannot reverse the realities of over-crowded wells and geology,” Hughes said.
The story is not all that different in the Permian, save for the much higher levels of spending and drilling. Post Carbon estimates that it the Permian requires 2,121 new wells each year just to keep production flat, and in 2018 the industry drilled 4,133 wells, leading to a big jump in output. At such frenzied levels of drilling, the Permian could continue to see production growth in the years ahead, but the steady increase in water and frac sand “have reached their limits.” As a result, “declining well productivity as sweet-spots are exhausted will require higher drilling rates and expenditures in the future to maintain growth and offset field decline,” Hughes warned.
7/29/2017 ASPO newsletter: Last week a $2 billion private-equity fund heavily invested in oil and gas wells went bust, raising the question of whether this is about to happen to other investors. With oil prices in the $40s, many drilling operators are losing money with every barrel of oil they produce. These losses ultimately flow back to the investors that acquired their oilfield assets back when oil was selling for over $100 a barrel.
If spectacular increases in US oil production are to come in the five to eight years, most analysts say it must come from the Permian Basin which is the only shale oil play currently experiencing rapid growth. The Eagle Ford and Bakken shale oil deposits peaked four years ago and have not enjoyed much growth recently and without a substantial increase in investment, there is little hope that there will be substantial growth in the Gulf of Mexico oil fields.
This leaves the Permian Basin as the one oil play that could give America “energy dominance” by pushing up US shale oil production from 5.5 million b/d to 12 million. For this to happen, there must be enough oil in the Permian oil play that can be exploited at prevailing prices. A recent analysis of likely Permian reserves by Arthur Berman concludes that the total recoverable oil in the Permian Basin is likely to be on the order of 3.7 billion barrels and not the 160 billion barrels that the CEO of Pioneer Natural Resources recently was claiming could be recovered from the Permian. The two leading producers of Permian shale oil are anticipating peak production in 2019, which is not that far away.
3/19/2015 ASPO newsletter: Reining in overseas drilling for shale oil: After spending more than five years and billions of dollars trying to re-create the US shale boom overseas, some of the world’s biggest oil companies are starting to give up amid a world-wide collapse in crude prices. Chevron Corp., Exxon Mobil Corp. and Royal Dutch Shell PLC have packed up nearly all of their hydraulic fracturing wildcatting in Europe, Russia, and China. The reasons vary from sanctions in Russia, a ban in France, a moratorium in Germany and poor results in Poland to crude prices below what it can cost to produce a barrel of shale oil.
Here are just a few of many articles on this topic:
- 2019-11-02 Why the UK government finally gave up on fracking shale for oil and gas. And the related story of why American shale is heading for a financially ruinous crash by Jeremy Leggett
- 2016-4-30 Australian Public Broadcaster ABC unable to look at oil statistics
- May 10, 2015. Einhorn’s Fracking Concerns Are Nothing New, But They Matter For Investors (Part 1). SeekingAlpha.com
- R. Heinberg. Chapter 5 of How Fracking’s False Promise of Plenty Imperils Our Future: The Economics of Fracking: Who Benefits? October 2013.
- Hall, C. Are we Entering the Second Half of the Age of Oil? Some epirical constraints on optimists’ predictions of an oil-rich future. 2013 Geological Society of America.
- Richard Heinberg. 12 Nov 2012. Museletter #246: Gas Bubble Leaking, About to Burst.
- Gail Tverberg. 17 Oct 2012. Why Natural Gas isn’t Likely to be the World’s Energy Savior.
- Jeff Goodell. 1 Mar 2012. Politics: The Big Fracking Bubble: The Scam Behind the Gas Boom. Rolling Stone.
- James Howard Kunstler. 19 Nov 2012. Epic Disappointment.
- David Hughes. 29 May 2011. Will Natural Gas Fuel America in the 21st Century?
- James Stafford. 12 Nov 2012. Shale Gas Will be the Next Bubble to Pop – An Interview with Arthur Berman.
- Peter Coy. 12 Nov 2012. U.S. the New Saudi Arabia? Peak Oilers Scoff. Bloomberg.
- Kelly, S. 29 Apr 2013. Faster Drilling, Diminishing Returns in Shale Plays Nationwide?
“fracked oil is very expensive, requiring circa $80 a barrel to cover the costs of extraction. Production from fracked oil wells drops off quickly, so new wells have to be drilled constantly to maintain production. Until recently information about just how fast our fracked oil wells were depleting was hard to come by, so the hype about the US becoming energy independent and a major oil exporter became conventional wisdom for most.
Nearly all of the growth in U.S. onshore crude production these days is coming from North Dakota’s Bakken field and Texas’s Eagle Ford. They account for nearly 2 million of the 2.4 million b/d increase in oil production that the US has seen in recent years. It sure looks as if the increase in production in these fields will keep up with the rate of decline within the next 12 to 18 months and that US shale oil production will no longer be growing. While it is possible that a surge of investment will increase the drilling to keep up with declines in production from the older wells, this is expensive, and for now it looks as if oil prices are heading for a level where fracked oil production is not profitable. Outside geologists with access to proprietary data on decline rates have been forecasting for some time now that as the number of wells increases and their quality declines, the shale boom will be coming to an end in the next two years. The release of EIA data seems to confirm these predictions.”
David Hughes at the 2013 Geological Society of America: These are heady times for U.S. oil bulls, with projections of production from tight oil rising to five million barrels per day, or more, by 2019, from essentially nothing just a few years ago. This compares to total U.S. oil production of less than seven million barrels per day as recently as 2008. Declarations of near term “energy independence” are commonplace in the main stream media.
Notwithstanding the substantial contribution of this new supply made possible by the combination of multi-stage hydraulic fracturing and horizontal drilling, the U.S. burns more than 18 million barrels per day. Even five million barrels per day of tight oil production is highly unlikely to free the U.S. from the need for imported oil. Furthermore, tight oil fields are characterized by high decline rates and the need for continual high rates of drilling to maintain production levels. The long term sustainability of tight oil production is thus of paramount concern.
An analysis of the Bakken Field, of North Dakota and Montana, and the Eagle Ford Field, of Texas, which together comprise more than half of projected tight oil production, reveals static field production declines of about 40 percent annually. Moreover, these fields are far from homogenous in terms of well productivity, with “sweet spots” of high productivity comprising a small proportion of the touted productive area. These sweet spots are targeted first resulting in the spectacular ramp up in production observed in these plays, but the steep decline rates inevitably take their toll. Production in the Bakken Field, which is the poster child for tight oil, has plateaued in the past few months, and requires 120 new wells each month to maintain production. The Eagle Ford is still growing rapidly, with 3000 new wells added each year, but it is only a question of time before the sweet spots are exhausted.
Tight oil is an important contributor to U.S. energy supply, but its long term sustainability is questionable. It should be not be viewed as a panacea for business-as-usual in future U.S. energy security planning.
[Note: the US EIA states that this California shale has 65% of the total recoverable shale oil resource base in the country, with 400 billion barrels of oil and 15 billion barrels using today’s technology. But it doesn’t look like that will work out].
We now have a second look at the Monterey shale and things don’t look so rosy. First, the geology of California is similar to a bowl of spaghetti with the earth squeezed into folds and steep inclines, not the 20,000 sq. miles of flat-laying shale deposits found in North Dakota. The Monterey shales are thick and complex, and do not lend themselves to drilling the long horizontal wells that can be fracked so productively in other places. Much of the shale oil in California appears to have drained over the years into conventional oil reservoirs and has already been extracted by many of the 238,000 oil wells that have been drilled in the state during the last century.
Our new study by an experienced Canadian geologist, who has already examined the productivity of other shale oil formations in the US, concludes that the government and its contractor’s study is absurdly optimistic about the prospects for shale oil production in California. Despite the use of all the latest drilling and production techniques, oil production in California has fallen from 1.1 million b/d 30 years ago to 500,000 b/d today. It is highly unlikely that this will be turned around given the geology of the region.
The Department of Energy’s report starts with the assumption that California’s shale is much like that in Texas and North Dakota. It posits that the oil industry will only have to drill 28,000 new wells, each yielding ridiculously large 550,000 barrels of oil, to extract California’s shale oil. This is simply not supported by the recent history of drilling in the state and is unlikely to happen. We will be lucky if California’s oil production does not continue to decline, for its geology is simply not the same.
Excerpts from a 32-page report:
Leases were bundled and flipped on unproved shale fields in much the same way as mortgage-backed securities had been bundled and sold on questionable underlying mortgage assets prior to the economic downturn of 2007.
In 2011, shale mergers and acquisitions (M&A) accounted for $46.5 B in deals and became one of the largest profit centers for some Wall Street investment banks. This anomaly bears scrutiny since shale wells were considerably underperforming in dollar terms during this time. Analysts and investment bankers, nevertheless, emerged as some of the most vocal proponents of shale exploitation. By ensuring that production continued at a frenzied pace, in spite of poor well performance (in dollar terms), a glut in the market for natural gas resulted and prices were driven to new lows. In 2011, U.S. demand for natural gas was exceeded by supply by a factor of four. It is highly unlikely that market-savvy bankers did not recognize that by overproducing natural gas a glut would occur with a concomitant severe price decline. This price decline, however, opened the door for significant transactional deals worth billions of dollars and thereby secured further large fees for the investment banks involved. In fact, shales became one of the largest profit centers within these banks in their energy M&A portfolios since 2010. The recent natural gas market glut was largely effected through overproduction of natural gas in order to meet financial analyst’s production targets and to provide cash flow to support operators’ imprudent leverage positions.
Wall Street promoted the shale gas drilling frenzy, which resulted in prices lower than the cost of production and thereby profited [enormously] from mergers & acquisitions and other transactional fees.
U.S. shale gas and shale oil reserves have been overestimated by a minimum of 100% and by as much as 400-500% by operators according to actual well production data filed in various states.
Shale oil wells are following the same steep decline rates and poor recovery efficiency observed in shale gas wells.
The price of natural gas has been driven down largely due to severe overproduction in meeting financial analysts’ targets of production growth for share appreciation coupled and exacerbated by imprudent leverage and thus a concomitant need to produce to meet debt service.
Due to extreme levels of debt, stated proved undeveloped reserves (PUDs) may not have been in compliance with SEC rules at some shale companies because of the threat of collateral default for those operators.
Industry is demonstrating reticence to engage in further shale investment, abandoning pipeline projects, IPOs and joint venture projects in spite of public rhetoric proclaiming shales to be a panacea for U.S. energy policy.
Exportation is being pursued for the differential between the domestic and international prices in an effort to shore up ailing balance sheets invested in shale assets
It is imperative that shale be examined thoroughly and independently to assess the true value of shale assets, particularly since policy on both the state and national level is being implemented based on production projections that are overtly optimistic (and thereby unrealistic) and wells that are significantly underperforming original projections.
for more than a decade the largest oil and gas producers (the “Majors” as they are collectively called) have not been able to materially expand their reserve replacement ratios.14 In fact, approximately one quarter of their reserve growth has come from acquisitions rather than the drill bit, such as ExxonMobil’s acquisition of XTO Energy. This constitutes consolidation rather than organic growth.
To give another example, in 2010 Chevron replaced less than one fourth of the oil and gas it had sold the prior year. This is highly problematic for the future share price of these companies and explains the exuberant share repurchase programs which they have engaged in recently, buying back shares in excess of as much $5 billion a quarter in the case of ExxonMobil. This is, of course, highly problematic for the future health of global economies. It is also problematic for the share prices of the individual fossil fuel companies.
Further, there are various grades and types of hydrocarbons, some much more efficient as fuels than others. Additionally, some hydrocarbons simply require such an expenditure of energy to extract and produce that their use becomes questionable.
In order for a publicly traded oil and gas company to grow extensively, it must manage not only its core business but also the relationship it enjoys with its investment bankers. Thus, publicly traded oil and gas companies have essentially two sets of economics. There is what may be called field economics, which addresses the basic day to day operations of the company and what is actually occurring out in the field with regard to well costs, production history, etc.; the other set is Wall Street or “Street” economics. This entails keeping a company attractive to financial analysts and investors so that the share price moves up and access to the capital markets is assured. “Street” economics has more to do with the frenzy we have seen in shales than does actual well performance in the field.
Before the mortgage crisis, once the extent of the appetite was realized for credit default swaps, representatives of the capital markets worldwide embraced the new products. The fees generated were immense. It was similar with shale. Land was bid up to ridiculous prices with signing bonuses reaching nearly $30,000/acre and leases on unproven fields being flipped for as much as $25,000/acre, multiples of original investment. There seemed an unending appetite.
In another example of parallels: credit default swaps were not traded on any exchange, so transparency became a paramount issue. It proved very difficult to accurately measure the underlying fundamentals with such a lack of transparency. It was the same with shales. Due to the new technology of hydrofracture stimulation, shale results could not be verified for a number of years. There simply was not enough historical production data available to make a reasonable assessment. It wasn’t until Q3 of 2009 that enough production history on shale wells in the Barnett had been filed with the Texas Railroad Commission that well performance could be checked.24 What emerged was significantly different from the operators’ original rosy projections. Of further interest is the fact that once numbers could begin to be verified in a play, operators sold assets quickly. This has followed in each play in the U.S. as it matured. The dismal performance numbers were recognized as a potential drag on company share prices. A good example would be the operators in the Barnett play in Texas. The primary players were Chesapeake Energy(significant portion of assets sold or jv’ed), Range Resources (all Barnett assets sold), Encana,( all Barnett assets sold) and Quicksilver Resources (company attempting to monetize all Barnett assets via MLP or asset sale since 2011. In that time frame, stock has plunged from about $15/share to $2.50/ share).
The issue of well performance disclosure has continued to mask problems in shale production. States such as Pennsylvania and Ohio do not release well performance data on a timely basis, which makes it very difficult to get a true picture of actual well history.
WRITE-DOWNS
In the lead up to the mortgage crisis, there were hints of things to come in the form of asset write downs.
Similar hints have been emerging with regard to shale (several examples listed)
This is of particular interest. Pipeline projects are expensive and require that a steady and consistent stream of gas or oil can be counted on for a long period of time in order to recoup initial capital outlay. Once initial capital is recouped, however, they tend to be cash cows. Given the steep decline curves for shale oil that are now readily apparent, it appears that operators recognize that the Bakken will not be a long-term play. As such, they are not prepared to invest the needed capital upfront for a pipeline: again, a distinct lack of confidence in the long term viability of shales.
December 2013. DRILLING CALIFORNIA. A Reality Check on the Monterey Shale By J. David Hughes
it is not clear that hydraulic fracking techniques like those used on the Bakken and Eagle Ford will work on the Monterey shale.
Bakken/Eagle Ford
- Deposits less than a few hundred feet thick
- Flat and gently dip
- Bakken: 20,000 square miles
- Eagle Ford: 8,000 Square miles
Monterey
- Complex and unpredictable
- Much thicker deposits of up to 2,000 feet
- Much deeper – anywhere from the surface to 18,000 feet down
- 2,000 square miles
- 1,363 wells have been drilled in shale reservoirs of the Monterey Formation. Oil production from these wells peaked in 2002, and as of February 2013 only 557 wells were still in production.3 Most of these wells appear to be recovering migrated oil, not “tight oil” from or near source rock as is the case in the Bakken and Eagle Ford plays.
The EIA/INTEK report assumed that 28,032 tight oil wells could be drilled over 1,752 square miles (16 wells per square mile) and that each well would recover 550,000 barrels of oil. The data suggest, however, that these assumptions are extremely optimistic for the following reasons:
- Initial productivity per well from existing Monterey wells is on average only a half to a quarter of the assumptions in the EIA/INTEK report. Cumulative recovery of oil per well from existing Monterey wells is likely to average a third or less of that assumed by the EIA/INTEK report.
- Existing Monterey shale fields are restricted to relatively small geographic areas. The widespread regions of mature Monterey shale source rock amenable to high tight oil production from dense drilling assumed by the EIA/INTEK report (16 wells per square mile) likely do not exist.
Thus the EIA/INTEK estimate of 15.4 billion barrels of recoverable oil from the Monterey shale is likely to be highly overstated. Certainly some additional oil will be recovered from the Monterey shale, but this is likely to be only modest incremental production—even using modern production techniques such as high volume hydraulic fracturing and acidization. This may help to temporarily offset California’s longstanding oil production decline, but it is not likely to create a statewide economic boom.
Art Berman: There is about eight years’ worth of shale gas supply available in the United States. The math: If you divide the “technically recoverable resource” of about 1,900 Tcf (trillion cubic feet) of gas, as identified by the Potential Gas Committee’s (PGC’s) report by annual U.S. consumption, you come up with 90 years. However, the PGC’s report says the “probable recoverable resource” is only 550 Tcf— 25% of the “technically recoverable resource. Then, if you divide the 550 Tcf “probable recoverable resource” by 3, which represents the amount of the resource that is actually provided by shale gas, you get about 180 Tcf. (Nov-Dec 2012. A contrarian on Shale Gas. Amerian Public Power Association.)
August 2013. Shale truth interview Arthur Berman Segments 1, 2, 3, 4, 5
Some paraphrased excerpts from these videos:
The high rate of drilling means someone is willing to spend money and there is gas, but not necessarily a lot of profit. My concern is – what if there’s an economic contraction? They’re spending far more than their earnings, they have to find money to drill more wells. Twice as much as they’re making. A person couldn’t sustain that, and neither can they if capital goes away. The assumption is they must be making money. No, other reasons are to keep your leases, maintain production growth so Wall St thinks you’re a good company and stock price doesn’t go down. If people give E&P money, they’ll spend it. Lots of wells doesn’t persuade me they’re making money.
Question: if not profitable, then what do you think it will take for politicians and public to understand that?
Art: There’s not big money being made, but being spent. They think that over time they’ll figure out a way to make money at it, their experts see demand growing and price increasing, especially in north America where we’ve nearly gone through our oil reserves. So our economy will be more and more NG oriented. There is a lot of gas but most isn’t commercial, but if prices go up, then more will be profitable. By the end it will be the Exxon, Chevron, Anardako, Apache, Statoil, with the deep pockets, to get through this non-profitable period. Everyone is losing money right now. I’ve looked at all their balance sheets, none are making money. If you’re making money it ought to show up in the SEC filings. Chesapeake for 2012 is clearly the shale gas leader, they started it, have the most land, the 2nd largest reserves of natural gas after Exxon, but their SEC filing is a train wreck, they lost a Billion last year, had to write down reserves, 3/4 of earnings are from asset sales, not operations. If CHK is a paragon, then we’re in trouble. Forget about reserves, resources — clearly no one is making any money.
Q: We hear about a GLUT of shale NG?
No, it’s been flat since Dec 2011, for 15 months flat. do we have an oversupply? Not really, we have an equilibrium that’s keeping prices somewhat low, though they’ve doubled since April. The question is how long will it take until there’s less NG than we demand, then price will come up. I think it’ll be sooner than the others are predicting. over the past 7 decades we’ve had 5 complete fiascos based on predictions everyone agreed on. Now that it’s cheap forever, what about when we were building LNG to import it? Now we think the situation is reversed, no more problems.
Shale is about 35% of our NG supply. Where’s the 65%? Conventional, in terminal decline. No one is drilling those wells. 2/3 of our gas is declining, and shale is not increasing. Barnett, Haynesville, etc., only the Marcellus is continuing to increase.
Q: What should we do?
Change our behavior. No silver bullet suolutions. There are no solutions. The solutions, if they are out there, are very long term. so only 2 things to do: efficiency – use the fuels we have more efficiently. The more important thing is our own behavior – how do we use energy – how many drive alone to work? Leave lights on, not enough insulation — simple things, not solar panels. People don’t feel like they need to conserve when they hear we’re energy independent. Even if we had 100 years of gas, why should we use it up fast?
Several years ago there were the real estate shenanigans, subprime, securitized mortgages, credit default swaps, and so on responsible for economic collapse. This is similar to some of the shale gas ventures. There are some striking comparisons. We’re told it’ll get better and bigger forever and ever, that S&P/Moody’s mortgages grade A investments but they were wrong, now all the experts say everyone’s making money in shale gas.
But look at the financial position of CHK or Enron, It’s a kind of a train wreck. Many natural gas companies are run well and expect they’ll make money -but whether we believe that – I’m just raising a cautionary note. I believe the financial collapse had as much to do with energy as real estate. oil got to nearly $150/barrel at same time subprime reached its crescendo, that has an effect — Energy isn’t a sector separate from economics, politics – it’s what ties everything together.
Bill Powers: The U.S. has nowhere close to a 100-year supply.
In his new book “Cold, Hungry and in the Dark: Exploding the Natural Gas Supply Myth”, Powers concludes the USA has a 5 to 7 year supply of shale gas. People and companies who benefit economically are behind the promotion of the shale gas myth. In reality, many corporations are taking write-downs of their reserves. (Peter Byrne. 8 Nov 2012. US Shale Gas Won’t Last Ten Years: Bill Powers. The Energy Report.)
James Howard Kunstler, 24 Sep 2012 “Duty”
“In all the monumental yammer of the media sages surrounding the candidates they follow, and among the freighted legions of meticulously trained economists who try so hard to fit their equations and models over the spilled chicken guts of daily events, there is no sense of the transience of things. Tom Friedman over at The New York Times still thinks that the petroleum-saturated present he calls “the global economy” is a permanent condition of human life, and so does virtually every elected and appointed official in Washington, not to mention every broadcaster in Manhattan. … Someone told all these clowns about 14 months ago that we will be able to keep running WalMart on shale oil and shale gas virtually forever, and they swallowed the story whole, and then force-fed it down the distracted public’s throat. In reality – that alternative universe to flat-screen America – all the mechanisms that allow us to keep running this wondrous show teeter on a razor’s age of extreme fragility. We’re one bomb-vest or High Frequency Trading keystroke away from a possible dark age…”
whether the latest financial news is giddy or dismal, whether oil prices are up or down, the game of growing the economy by increasing the production of affordable transport fuel is now officially over. Previously, we enjoyed both a growing economy and low fuel prices, with the latter feeding the former; now we see “cheap” oil only when the economy is in a tailspin of demand destruction.
Yes, “fracking” has given America temporarily inexpensive and abundant natural gas—so why not oil? In the case of natural gas, record-high prices back in 2006-2007 (due to depletion of conventional gas deposits) led to truly heroic rates of drilling and a temporary supply glut. Gas has become so cheap in fact that the shale gas industry is imploding, starting with Chesapeake Energy, the biggest fracker of them all. Producers are losing money on each well, so they’re pulling back on drilling even if that hurts their company’s share value (which it does). Next we’ll see a consolidation of the industry, rising prices, and falling production—against nearly everyone’s recent expectations. This is all clearly and persuasively explained in David Hughes’s recent report for Post Carbon Institute, “
Will Natural Gas Fuel America for the 21st Century?”
The media-storm touting America’s energy resurgence has been truly surreal. During the past 12 months oil prices were at their highest sustained level in history, while the rate of world crude oil production has been flat-lined for seven years. Available oil exports are disappearing from world markets as exporting countries use ever more of their product domestically. The data shout “Peak Oil!” but news markets demand happy talk. And so pundits seize upon a temporary production increase in North Dakota achieved by fracking oil-bearing shale as a “game changer.” Once again we’re told that technology will save us!
In reality, virtually all the easy, cheap oil has already been found and put into production; what’s left to find and produce will be hard, nasty, and expensive. Oil-bearing shales have been known to geologists for decades, and fracking has been part of the technical arsenal of the industry since the 1980s, but the cost of development was considered too high. Meanwhile, despite its “miraculous” growth in domestic oil production, the United States saw its trade deficit in oil increase to $327 billion in 2011, accounting for 58 percent of the total trade deficit, the highest-ever annual share.
Not necessarily. As the economy tanks, that will cut demand for oil and the price will fall below the new-supply break-even level; when that happens, companies will cancel or delay new projects (as they did in late 2008 when the per-barrel price fell to $40). But if, for the moment, the economic news looks good, demand will grow and oil prices must inevitably return to levels that justify new supply. And those price levels are just high enough to begin undermining economic growth, as a spate of recent economic research has shown.
Huffington Post, 27 Mar 2013: Deep water and tight oil (like what comes from the Bakken and Eagle Ford) have extremely high depletion rates.
Deep water wells deplete about 10-20 percent a year. Tight oil depletes at about 40 percent annually the first few years. Think about that latter number, where most of our new oil extraction is coming from. What if you had a part-time job but within two years you would only be making about a quarter of your current income. Probably need a new part time job, right? But that one does the same thing. Before you know it, you need 40,000 part time jobs. But even that doesn’t help, because they’re all still depleting at 40 percent. Give a thought to how much you would have to work to maintain your original income after five years, then ten years, then twenty years… Source: The Reward for Being Right About Peak Oil: Scorn Heaped With Derision
The International Energy Agency 2012 World Energy Outlook forecast that US shale oil production would continue to grow more rapidly than expected for the rest of the decade, leading to the US becoming the world’s largest oil producer by 2012 and largely energy independent (though not for oil) by 2035.
The world’s press trumpeted the energy crisis was now way in the future and that all would be well for the next 20 years. The few writers that consulted people in the peak oil community buried their skeptical comments at the bottom of their stories.
The issue is how much longer shale oil production can continue to grow at the spectacular rates of the past few years before it too peaks and starts to decline. Oil production from the Bakken Shale in North Dakota is about 660,000 b/d, Eagle Ford in Texas about 600,000 b/d and growing. Some say the 2 fields will produce 2 million b/d in the next year or so. The IEA seems to be saying that tight oil production in the US will peak at about 5 million b/d around 2020.
Most people in the peak oil community who have looked into the issue have major problems with these forecasts, believing that a peak in shale oil production around 3 million b/d is more realistic. Remember, demand is increasing at about 750,000 b/d each year, so 8 years from now an additional 6 million b/d of new production will be required worldwide plus another 3-4 million b/d will be needed to replace the depletion from existing fields every year.
The first problem with the IEA’s estimate is the rapid depletion of fracked oil wells. Despite limited experience with this relatively new technology, some are calculating that production from many of these wells is dropping by over 40% or more a year.
We know the average daily production from North Dakota’s 4,630 producing wells is currently 143 b/d. If we assume that the Bakken oil fields are to produce 2.5 million b/d by the end of the decade then it will need some 18,000 wells, each producing the average of 140 b/d. While this is a not an inconceivable number, when one takes into account that most, if not all of these wells will have be redrilled twice in the next 8 years, the number becomes improbable. We shall have to drill more and more wells just to maintain the same level of production.
The second problem with the optimism over tight oil is the very high cost of the horizontal drilling and fracking of these wells, which may run 3 to 4 times that of a conventional well. Some people put the cost of producing a barrel of oil from the Bakken at $80-90, which is just about where oil is currently selling in the region. Should the global economy continue to contract, the selling price of fracked oil could well fall below the cost of production, bringing a marked slowdown to further drilling.
Roger Blanchard: A Closer Look at Bakken and U.S. Oil Production:
- Oil production outside of Texas and North Dakota has actually declined in the last few years
- Bakken extends over a large area of North Dakota, Montana and Saskatchewan, but just 4 counties in North Dakota are 80.8% of all the oil production. Even within that area, some spots are better than others.
- “Oil wells in the Bakken region decline rapidly. From data I’ve seen, the average decline in the first year is ~60%. The only way to maintain or increase Bakken oil production is to rapidly increase the number of wells. As the industry has to drill in less fruitful areas, being able to maintain production will become an increasing challenge.”
- “I expect oil production in the Bakken to peak in 2013 to 2015. I expect Texas oil production to have a secondary peak around 2014 (Texas oil production peaked in 1972 at 3.57 mb/d while it’s presently ~1.5 mb/d). If oil production in both Texas and North Dakota begins to decline around 2015, I expect U.S. oil production as a whole to begin to decline in that same time frame.” (my comment: Blanchard also says that oil production is declining now in the Gulf of Mexico!)
ASPO Newsletter Nov 26, 2012 Who do you believe, Likvern or North Dakota official?
Rune Likvern
- performed an in-depth analysis of data from fracked wells in North Dakota and concluded that the fracked wells are depleting so fast production from the region is unlikely to get much beyond 600,000-700,000 b/d.
- the average Bakken well produces 85,000 barrels of oil in its first year
- production steady due to accelerating rate of drilling at about 143 b/d. September to september # of wells: 590 2009-2010 1010 2010-2011 1762 2011-2012
- Each well costs $10 million – how long can that be sustained?
- Hess oil costs was $13 million per well drilled/fracked
- Unless the geology is significantly different, what happens in the Bakken over the next few years will be similar to Texas shales. A recent study of 1000 wells in the Eagle Ford, Texas field shows that each well will produce about 120,000 barrels over its lifetime. This is a long way from the 600,000 barrels North Dakota claims each well will yield.
Director of the North Dakota Oil & Gas Division:
- production may reach any where from 900,000 to 1.2 million b/d in the next 3 years and sustain this level until 2020 or even 2025 before tapering off to 650-700,000 b/d by 2050.
- the average Bakken well produces 329,000 barrels of oil in its first year
- Predicts a revenue 3 times higher over the lifetime of a well than Likvern:Over a 45-year lifetime, each well will produce 615,000 barrels of oil, easily covering the $9 million it costs to drill and frack. if avg prd is 329,000 barrels first year, even spectacular rates of depletion allows a well to produce 600,000 barrels in 5 or 6 years. If Likvern is right and the average well yields 85,000 barrels the first year, then it would only 200,000 barrels.
- Platts estimates each well generates $20 million in profits
An energy expert (I don’t have permission to give attribution) on oil and gas shales:
- Barnett (once our great natural gas savior) has peaked (at least for now)
- Haynesville has peaked
- Montana Bakken oil has peaked and is half way down
- North Dakota is increasing rapidly but gets most of its oil out of two sweet spots — Bakken is not nearly as big as it appears on maps… so far all the oil drilling is concentrated in 3 sweet spots: Parshall, Nesson anticline and Elm Coulee Montana. These areas, about 5-10 percent of of the Bakken area on the map, are packed with oil wells and there are essentially none in other areas and according to USGS those other wells produce little oil.
- The question is: is it all only about sweet spots? How many more sweet spots are there? …early estimate of the EROI of these sites is about same as US oil now (~10:1) FOR THE SWEET SPOTS only.
- Also from a Texas oil man: “Few are making profits in Eagle Ford. Its a vast Ponzi scheme“
Chris Nelder: “… the decline rates of shale gas wells are steep. They vary widely from play to play, but the output of shale gas wells commonly falls by 50% to 60% or more in the first year of production. This is why I have called it a treadmill: you have to keep drilling furiously to maintain flat output.
In the U.S., the aggregate decline of natural gas production from both conventional and unconventional sources is now 32% per year, so 22 bcf/d of new production must be added every year to keep overall production flat, according to Canadian geologist David Hughes. That’s close to the total output of U.S. shale gas, after nearly a decade of its development. It will require thousands more shale gas and tight oil wells to keep domestic gas production flat.”
American Geophysical Union conference 2012: TITLE: The Future of Fossil Fuels: A Century of Abundance or a Century of Decline?
ABSTRACT: Horizontal drilling, hydraulic fracturing, and other advanced technologies have spawned a host of new euphoric forecasts of hydrocarbon abundance. Yet although the world’s remaining oil and gas resources are enormous, most of them are destined to stay in the ground due to real–]world constraints on price, flow rates, investor appetite, supply chain security, resource quality, and global economic conditions. While laboring under the mistaken belief that it sits atop a 100–]year supply of natural gas, the U.S. is contemplating exporting nearly all of its shale gas production even as that production is already flattening due to poor economics. Instead of bringing “energy independence” to the U.S. and making it the top oil exporter, unrestricted drilling for tight oil and in the federal outer continental shelf would cut the lifespan of U.S. oil production in half and make it the world’s most desperate oil importer by mid–]century. And current forecasts for Canadian tar sands production are as unrealistic as their failed predecessors. Over the past century, world energy production has moved progressively from high quality resources with high production rates and low costs to lower quality resources with lower production rates and higher costs, and that progression is accelerating. Soon we will discover the limits of practical extraction, as production costs exceed consumer price tolerance. Oil and gas from tight formations, shale, bitumen, kerogen, coalbeds, deepwater, and the Arctic are not the stuff of new abundance, but the oil junkie’s last dirty fix. This session will highlight the gap between the story the industry tells about our energy future, and the story the data tells about resource size, production rates, costs, and consumer price tolerance. It will show why it’s time to put aside unrealistic visions of continued dependence on fossil fuels, face up to a century of decline, and commit ourselves to energy and transportation transition.
Bill Powers: “There is production decline in the Haynesville and Barnett shales. Output is declining in the Woodford Shale in Oklahoma. Some of the older shale plays, such as the Fayetteville Shale, are starting to roll over. As these shale plays reverse direction and the Marcellus Shale slows down its production growth, overall U.S. production will fall. At the same time, Canadian production is falling. And Canada has historically been the main natural gas import source for the U.S. In fact, Canada has already experienced a significant decline in gas production — about 25%, since a peak in 2002 — and has dramatically slowed its exports to the United States.”
Art Berman: in 2011 published a report showing industry reserves had been overstated by at least 100% based on detailed review of both individual well and group decline profiles for Barnett, Fayetteville, and Haynesville Shale plays.
[Natural] gas may not be as easy and cheap to extract from shale formations deep underground as [energy] companies are saying, according to hundreds of industry e-mails and internal documents and an analysis of data from thousands of wells.
In the e-mails, energy executives, industry lawyers, state geologists and market analysts voice skepticism about lofty forecasts and question whether companies are intentionally, and even illegally, overstating the productivity of their wells and the size of their reserves. Many of these e-mails also suggest a view that is in stark contrast to more bullish public comments made by the industry, in much the same way that insiders have raised doubts about previous financial bubbles.
“Money is pouring in” from investors even though shale gas is “inherently unprofitable,” an analyst from PNC Wealth Management, an investment company, wrote to a contractor in a February e-mail. “Reminds you of dot-coms.
“The word in the world of independents is that the shale plays are just giant Ponzi schemes and the economics just do not work,” an analyst from IHS Drilling Data, an energy research company, wrote in an e-mail on Aug. 28, 2009.
Company data for more than 10,000 wells in three major shale gas formations raise further questions about the industry’s prospects. There is undoubtedly a vast amount of gas in the formations. The question remains how affordably it can be extracted.
The data show that while there are some very active wells, they are often surrounded by vast zones of less-productive wells that in some cases cost more to drill and operate than the gas they produce is worth. Also, the amount of gas produced by many of the successful wells is falling much faster than initially predicted by energy companies, making it more difficult for them to turn a profit over the long run.
If the industry does not live up to expectations, the impact will be felt widely…if natural gas ultimately proves more expensive to extract from the ground than has been predicted, landowners, investors and lenders could see their investments falter, while consumers will pay a price in higher electricity and home heating bills.
There are implications for the environment, too. The technology used to get gas flowing out of the ground — called hydraulic fracturing, or hydrofracking — can require over a million gallons of water per well, and some of that water must be disposed of because it becomes contaminated by the process. If shale gas wells fade faster than expected, energy companies will have to drill more wells or hydrofrack them more often, resulting in more toxic waste.
The e-mails were obtained through open-records requests or provided to The New York Times by industry consultants and analysts who say they believe that the public perception of shale gas does not match reality.
Studying the Data
Ms. Rogers, a former stockbroker with Merrill Lynch, said she started studying well data from shale companies in October 2009 after attending a speech by the chief executive of Chesapeake, Aubrey McClendon. The math was not adding up, her research showed that wells were petering out faster than expected.
In May 2010, the Federal Reserve Bank of Dallas called a meeting to discuss the matter after prodding from Ms. Rogers. One speaker was Kenneth B. Medlock III, an energy expert at Rice University, who described a promising future for the shale gas industry in the United States. When he was done, Ms. Rogers peppered him with questions.
Might growing environmental concerns raise the cost of doing business? If wells were dying off faster than predicted, how many new wells would need to be drilled to meet projections?
Mr. Medlock conceded that production in the Barnett shale formation — or “play,” in industry jargon — was indeed flat and would probably soon decline.
Bubbling Doubts
Some doubts about the industry are being raised by people who work inside energy companies, too.
“In these shale gas plays no well is really economic right now, they are all losing a little money or only making a little bit of money.” Around the same time the geologist sent this e-mail, Mr. McClendon, Chesapeake’s chief executive, told investors, “It’s time to get bullish on natural gas.
In September 2009, a geologist from ConocoPhillips, one of the largest producers of natural gas in the Barnett shale, warned in an e-mail to a colleague that shale gas might end up as “the world’s largest uneconomic field.”
Forecasting these reserves is a tricky science. Early predictions are sometimes lowered because of drops in gas prices, as happened in 2008. Intentionally overbooking reserves, however, is illegal because it misleads investors. Industry e-mails, mostly from 2009 and later, include language from oil and gas executives questioning whether other energy companies are doing just that.
The e-mails do not explicitly accuse any companies of breaking the law. But the number of e-mails, the seniority of the people writing them, the variety of positions they hold and the language they use — including comparisons to Ponzi schemes and attempts to “con” Wall Street — suggest that questions about the shale gas industry exist in many corners.
“Do you think that there may be something suspicious going with the public companies in regard to booking shale reserves?” a senior official from Ivy Energy, an investment firm specializing in the energy sector, wrote in a 2009 e-mail.
A former Enron executive wrote in 2009 while working at an energy company: “I wonder when they will start telling people these wells are just not what they thought they were going to be?” He added that the behavior of shale gas companies reminded him of what he saw when he worked at Enron.
Production data, provided by companies to state regulators and reviewed by The Times, show that many wells are not performing as the industry expected. In three major shale formations — the Barnett in Texas, the Haynesville in East Texas and Louisiana and the Fayetteville, across Arkansas — less than 20 percent of the area heralded by companies as productive is emerging as likely to be profitable under current market conditions, according to the data and industry analysts.
Richard K. Stoneburner, president and chief operating officer of Petrohawk Energy, said that looking at entire shale formations was misleading because some companies drilled only in the best areas or had lower costs. “Outside those areas, you can drill a lot of wells that will never live up to expectations,” he added.
Although energy companies routinely project that shale gas wells will produce gas at a reasonable rate for anywhere from 20 to 65 years, these companies have been making such predictions based on limited data and a certain amount of guesswork, since shale drilling is a relatively new practice.
Most gas companies claim that production will drop sharply after the first few years but then level off, allowing most wells to produce gas for decades. Gas production data reviewed by The Times suggest that many wells in shale gas fields do not level off the way many companies predict but instead decline steadily.
“This kind of data is making it harder and harder to deny that the shale gas revolution is being oversold,” said Art Berman, a Houston-based geologist who worked for two decades at Amoco and has been one of the most vocal skeptics of shale gas economics.
The Barnett shale, which has the longest production history, provides the most reliable case study for predicting future shale gas potential. The data suggest that if the wells’ production continues to decline in the current manner, many will become financially unviable within 10 to 15 years.
A review of more than 9,000 wells, using data from 2003 to 2009, shows that — based on widely used industry assumptions about the market price of gas and the cost of drilling and operating a well — less than 10% of the wells had recouped their estimated costs by the time they were 7 years old.
In private exchanges, many industry insiders are skeptical, even cynical, about the industry’s pronouncements. “All about making money,” an official from Schlumberger, an oil and gas services company, wrote in a July 2010 e-mail to a former federal regulator about drilling a well in Europe, where some United States shale companies are hunting for better market opportunities.
“Looks like crap,” the Schlumberger official wrote about the well’s performance, according to the regulator, “but operator will flip it based on ‘potential’ and make some money on it.”
David Hughes at the 2012 American Geophysical Union conference 2012: Shale Gas and Tight Oil: A Panacea for the Energy Woes of America?
ABSTRACT: Shale gas has been heralded as a game changer in the struggle to meet America’s demand for energy. The Pickens Plan of Texas oil and gas pioneer T.Boone Pickens suggests that gas can replace coal for much of U.S. electricity generation, and oil for, at least, truck transportation. Industry lobby groups such as ANGA declare that the dream of clean, abundant, home grown energy is now reality. In Canada, politicians in British Columbia are racing to export the virtual bounty of shale gas via LNG to Asia despite the fact that Canadian gas production is down 16% from its 2001 peak). And the EIA has forecast that the U.S. will become a net exporter of gas by 20213. Similarly, recent reports from Citigroup and Harvard suggest that an oil glut is on the horizon thanks in part to the application of fracking technology to formerly inaccessible low permeability tight oil plays. The fundamentals of well costs and declines belie this optimism. Shale gas is expensive gas. In the early days it was declared that continuous plays like shale gas were manufacturing operations, and that geology didn’t matter. One could drill a well anywhere, it was suggested, and expect consistent production. Unfortunately, Mother Nature always has the last word, and inevitably the vast expanses of purported potential shale gas resources contracted to core areas, where geological conditions were optimal. The cost to produce shale gas ranges from $4.00 per thousand cubic feet (mcf) to $10.00, depending on the play. Natural gas production is a story about declines which now amount to 32% per year in the U.S. So 22 billion cubic feet per day of production now has to be replaced each year to keep overall production flat. At current prices of $2.50/mcf, industry is short about $50 billion per year in cash flow to make this happen. As a result I expect falling production and rising prices in the near to medium term. Similarly,
tight oil plays in North Dakota and Texas have been heralded as a new Saudi Arabiah of oil. Growth in production has been spectacular, but currently amounts to just one million barrels per day which is less than 15% of US oil and other liquids production. Tight oil is offsetting declines in conventional crude oil production as well as contributing to a modest production increase from the 40 year US crude oil production low of 2008. The mantra that natural gas is a transition fuel to a low carbon future is false. The environmental costs of shale gas extraction have been documented in legions of anecdotal and scientific reports. Methane and fracture fluid contamination of groundwater, induced seismicity from fracture water injection, industrialized landscapes and air emissions, and the fact that near term emissions from shale gas generation of electricity are worse than coal. Tight oil also comes with environmental costs but has been a saviour in that it at least temporarily arrested a terminal decline in US oil production. A sane energy security strategy for America must focus on radically reducing energy consumption through investments in infrastructure that provides alternatives to our current high energy throughput. Shale gas and tight oil will be an important contributors to future energy requirements, given that other gas and oil sources are declining, but there is no free lunch.
2012 American Geophysical Union conference 2012: Charles A. Hall. Quantity vs quality of oil: Implications for the future economy
ABSTRACT: There has considerable interest recently in various indications of important changes in the technology of oil production and its impact on US oil production. The data indicate a clear increase in oil production for the US after 40 years of year by year decline. This has led some commentators to predict that the US will become a net oil exporter before long. Maps showing the enormous extent of e.g. the Bakken formation in North Dakota and Montana, and our ability to now exploit this oil using the new techniques of horizontal drilling and fracking, gives the impression that there are enormous new oil reserves that can satisfy our wants indefinitely. Other assessments indicate that the amount of oil still available globally is 3, 4 or more times the usual assessments of about 1 trillion barrels. But “oil” is not a single substance, but rather a suite of materials of widely varying qualities and hence utility. One important index is the energy return on investment (EROI), the ratio of energy returned from energy used to get it. EROI reflects the balance of the countervailing impacts of depletion and technology and ultimately determines the price of a fuel. This ratio is declining all around the world, and gives a practical limit to how much oil we can exploit at an energy and economic profit. Bringing quality of oil into the equation gives a much more restrictive estimate of how much oil we are likely to be able to exploit for fuel.
The “shale revolution” has been often touted as a game changer in energy production (1). Indeed, during the past few years, the increasing production trend of shale (or “tight”) gas in the US has generated a wave of optimism invading the media and the Web. However, not everyone has joined the chorus and several commentators have predicted that the trend would be short lived (see, e.g. Sorrell (2), Laherrere (3), Hughes (4), and Turiel (5)). Some have flatly stated that the effort in gas production in the US is simply a financial bubble, destined to deflate soon (see e.g. Orlov (6) and Berman (7)). Some, such as R. P. Siegel (8) even argue that the bursting of the gas bubble might bring about a financial collapse not unlike the one of 2008.
While the optimism about the future of natural gas seems to be still prevalent, the data show that the gas bubble may be already bursting. The most recent data from EIA (9) show that that the total US gas production has not been growing for the past 1-2 years and that it shows signs to be declining. Fitted with a Gaussian curve, it shows a peak taking place around the end of 2012.
The declining trend is not yet very pronounced and specific data about shale gas production after 2011 are not available in the EIA site (9). However, since the production of conventional gas has been declining since 2007, the production of shale gas may not be declining yet, but it is surely not growing any more at the rates that were common just a few years ago.
In any case, there are data indicating that the decline of total gas production in the US was expected. Drilling rigs for gas has been plummeting down during the past few years, as shown in the following figure (data from Baker and Hughes (10)
Obviously, one can’t extract anything without having drilled first to find it. Since the lifetime of shale gas wells is of the order of a few years, it was unavoidable that the drop in the number of gas drilling rigs would generate in a production decline; which is what we are seeing today.
Basically, these data seem to confirm the interpretation that we are facing a financial “gas bubble”, rather than a robust trend of development of new resources. The gas glut produced by the rush to gas of the past few years has lowered prices to the point that companies have been extracting gas without making any profit, actually losing money in the process (7). That couldn’t last forever.
In the near future, the decline in gas production in the US may lead to an increase in prices which, in turn, may direct the industry to restart drilling for gas. But it remains to be seen if prices high enough to generate a profit are affordable for consumers. In any case, the idea of a “gas revolution” that will bring for us an age of abundance is rapidly fading.
In the end, what we are doing with gas is simply one more step along a path that we are forced to follow. With the gradual disappearance of high grade mineral resources, we must extract the minerals we need from lower grade resources, and this is more expensive and more polluting. That’s exactly what happening with gas but it is much more general. As described in the most recent report of the Club of Rome (Plundering the Planet (11)), the gradual depletion of high grade mineral resources is leading us to a world where mineral commodities will be rarer and more expensive. We will have to adapt to this empty new world.
1. http://belfercenter.ksg.harvard.edu/files/Oil-%20The%20Next%20Revolution.pdf
2. http://www.theoildrum.com/node/9327
3 http://www.theoildrum.com/node/9495
4. http://shalebubble.org/drill-baby-drill/
5. http://crashoil.blogspot.it/2010/12/un-mar-de-gas-natural.html
6. http://cluborlov.blogspot.com.es/2012/05/shale-gas-view-from-russia.html
7. http://www.youtube.com/watch?v=cDDseuvO2SM&feature=share&list=PL3yVl0q9sFIwgSJfLSBEA3pLrDsxMDMwe
8. http://www.triplepundit.com/2013/02/shale-gas-bubble-threatens-second-economic-collapse/
9. http://www.eia.gov/naturalgas/
10. http://www.bakerhughes.com/rig-count
11. http://www.clubofrome.org/?p=6166
————————————————————————————————-
References
Paraskova T (2021) Why China can’t replicate America’s shale boom. oilprice.com