New Yorker review of Eric Schlosser’s “Command and Control”

Preface.  This book has been on my reading list for several years now, but I have to admit I am lazy, lazy – the 656 pages is twice the length of most books.  And it would be hard to write a better review than this…

It is sheer luck that WWIII or nuclear explosins haven’t happened yet by accident, by miscalculation of the other side’s intentions,  bombs dripped by mistake, bombers crashing, or computers miscalculating.  There were 1200 nuclear weapons alone between 1950 and 1968 involved in significant accidents.

I heard McNamara speak at U.C. Berkeley after the movie “Fog of War” by Errol Morris was shown.  He said it’s up to us to do what we can to stop nuclear proliferation, and indeed it seems as important as any other cause you might choose to get involved in, and especially since it has more potential than climate change to drive humans and other life extinct.

Alice Friedemann   www.energyskeptic.com  author of “When Trucks Stop Running: Energy and the Future of Transportation”, 2015, Springer and “Crunch! Whole Grain Artisan Chips and Crackers”. Podcasts: Practical Prepping, KunstlerCast 253, KunstlerCast278, Peak Prosperity , XX2 report

***

Louis Menand. September 30, 2013. Nukes of Hazard. Eric Schlosser’s “Command and Control. the New Yorker.

On January 25, 1995, at 9:28 a.m.Moscow time, an aide handed a briefcase to Boris Yeltsin, the President of Russia. A small light near the handle was on, and inside was a screen displaying information indicating that a missile had been launched four minutes earlier from somewhere in the vicinity of the Norwegian Sea, and that it appeared to be headed toward Moscow. Below the screen was a row of buttons. This was the Russian “nuclear football.” By pressing the buttons, Yeltsin could launch an immediate nuclear strike against targets around the world. Russian nuclear missiles, submarines, and bombers were on full alert. Yeltsin had forty-seven hundred nuclear warheads ready to go.

The Chief of the General Staff, General Mikhail Kolesnikov, had a football, too, and he was monitoring the flight of the missile. Radar showed that stages of the rocket were falling away as it ascended, which suggested that it was an intermediate-range missile similar to the Pershing II, the missile deployed by NATO across Western Europe. The launch site was also in the most likely corridor for an attack on Moscow by American submarines. Kolesnikov was put on a hot line with Yeltsin, whose prerogative it was to launch a nuclear response. Yeltsin had less than six minutes to make a decision.

The Cold War had been over for four years. Mikhail Gorbachev had resigned on December 25, 1991, and had handed over the football and the launch codes to Yeltsin. The next day, the Soviet Union voted itself out of existence. By 1995, though, Yeltsin’s popularity in the West was in decline; there was tension over plans to expand NATO; and Russia was bogged down in a war in Chechnya. In the context of nuclear war, these were minor troubles, but there was also the fact, very much alive in Russian memory, that seven and a half years earlier, in May, 1987, a slightly kooky eighteen-year-old German named Mathias Rust had flown a rented Cessna, an airplane about the size of a Piper Cub, from Helsinki to Moscow and landed it a hundred yards from Red Square. The humiliation had led to a mini-purge of the air-defense leadership. Those people did not want to get burned twice.

After tracking the flight for several minutes, the Russians concluded that its trajectory would not take the missile into Russian territory. The briefcases were closed. It turned out that Yeltsin and his generals had been watching a weather rocket launched from Norway to study the aurora borealis. Peter Pry, who reported the story in his book “War Scare” (1999), called it “the single most dangerous moment of the nuclear missile age.” Whether it was the most dangerous moment or not, the weather-rocket scare was one of hundreds of incidents after 1945 when accident, miscommunication, human error, mechanical malfunction, or some combination of glitches nearly resulted in the detonation of nuclear weapons.

During the Cold War, there were a few occasions, such as the Cuban missile crisis, in 1962, when one side or the other was close to a decision that was likely to start a nuclear war. There were also some threats to go nuclear, though they were rarely taken completely seriously. In 1948, during a dispute with the Soviets over control of Berlin, Harry Truman sent B-29s to England, where they would be in range of Moscow. They were not armed with atomic bombs, but they were intended as a signal that the United States would use atomic weapons to defend Western Europe.

In 1956, during the Suez crisis, Nikita Khrushchev threatened to attack London and Paris with missiles if Britain and France did not withdraw their forces from Egypt. And, in 1969, Richard Nixon ordered B-52s armed with hydrogen bombs to fly routes up and down the coast of the Soviet Union—part of his “madman theory,” a strategy intended to get the North Vietnamese to believe that he was capable of anything, and to negotiate for peace. (The madman strategy was no more effective than anything else the United States tried, short of withdrawal, in the hope of bringing an end to the Vietnam War.)

But most of the danger that human beings faced from nuclear weapons after the destruction of Hiroshima and Nagasaki had to do with inadvertence—with bombs dropped by mistake, bombers catching on fire or crashing, missiles exploding, and computers miscalculating and people jumping to the wrong conclusion. On most days, the probability of a nuclear explosion happening by accident was far greater than the probability that someone would deliberately start a war.

In the early years of the Cold War, many of these accidents involved airplanes. In 1958, for example, a B-47 bomber carrying a Mark 36 hydrogen bomb, one of the most powerful weapons in the American arsenal, caught fire while taxiing on a runway at an airbase in Morocco. The plane split in two, the base was evacuated, and the fire burned for two and a half hours. But the explosives in the warhead didn’t detonate; that would have set off a chain reaction. Although the King of Morocco was informed, the accident was otherwise kept a secret.

Six weeks later, a Mark 6 landed in the back yard of a house in Mars Bluff, South Carolina. It had fallen when a crewman mistakenly grabbed the manual bomb-release lever. The nuclear core had not been inserted, but the explosives detonated, killing a lot of chickens, sending members of the family to the hospital, and leaving a thirty-five-foot crater. Although it was impossible to keep that event a secret, the Strategic Air Command (sac), which controlled the airborne nuclear arsenal, informed the public that the incident was the first of its kind. In fact, the previous year, a hydrogen bomb, also without a core, had been accidentally released near Albuquerque and exploded on impact.

Soon after the successful Soviet launch of Sputnik, in 1957, missiles became the preferred delivery vehicle for nuclear warheads, but scary things kept happening. In 1960, the computer at the North American Air Defense Command (NORAD) in Colorado Springs warned, with 99.9-per-cent certainty, that the Soviets had just launched a full-scale missile attack against North America. The warheads would land within minutes. When it was learned that Khrushchev was in New York City, at the United Nations, and when no missiles landed, officials concluded that the warning was a false alarm. They later discovered that the Ballistic Missile Early Warning System at Thule Airbase, in Greenland, had interpreted the moon rising over Norway as a missile attack from Siberia.

In 1979, NORAD’s computer again warned of an all-out Soviet attack. Bombers were manned, missiles were placed on alert, and air-traffic controllers notified commercial aircraft that they might soon be ordered to land. An investigation revealed that a technician had mistakenly put a war-games tape, intended as part of a training exercise, into the computer. A year later, it happened a third time: Zbigniew Brzezinski, the national-security adviser, was called at home at two-thirty in the morning and informed that two hundred and twenty missiles were on their way toward the United States. That false alarm was the fault of a defective computer chip that cost forty-six cents.

A study run by Sandia National Laboratories, which oversees the production and security of American nuclear-weapons systems, discovered that between 1950 and 1968 at least twelve hundred nuclear weapons had been involved in “significant” accidents. Even bombs that worked didn’t work quite as planned. In Little Boy, the bomb dropped on Hiroshima on August 6, 1945, only 1.38 per cent of the nuclear core, less than a kilogram* of uranium, fissioned (although the bomb killed eighty thousand people). The bomb dropped on Nagasaki, three days later, was a mile off target (and killed forty thousand people). A test of the hydrogen bomb in the Bikini atoll, in 1954, produced a yield of fifteen megatons, three times as great as scientists had predicted, and spread lethal radioactive fallout over hundreds of square miles in the Pacific, some of it affecting American observers miles away from the blast site.

These stories, and many more, can be found in Eric Schlosser’s “Command and Control” (Penguin), an excellent journalistic investigation of the efforts made since the first atomic bomb was exploded, outside Alamogordo, New Mexico, on July 16, 1945, to put some kind of harness on nuclear weaponry. By a miracle of information management, Schlosser has synthesized a huge archive of material, including government reports, scientific papers, and a substantial historical and polemical literature on nukes, and transformed it into a crisp narrative covering more than fifty years of scientific and political change. And he has interwoven that narrative with a hair-raising, minute-by-minute account of an accident at a Titan II missile silo in Arkansas, in 1980, which he renders in the manner of a techno-thriller:

Plumb watched the nine-pound socket slip through the narrow gap between the platform and the missile, fall about seventy feet, hit the thrust mount, and then ricochet off the Titan II. It seemed to happen in slow motion. A moment later, fuel sprayed from a hole in the missile like water from a garden hose.

“Oh man,” Plumb thought. “This is not good.”

“Command and Control” is how nonfiction should be written.

Schlosser is known for two popular books, “Fast Food Nation,” published in 2001, and “Reefer Madness,” an investigative report on black markets in marijuana, pornography, and illegal immigrants that came out in 2003. Readers of those books, and of Schlosser’s occasional writings in The Nation, are likely to associate him with progressive politics. They may be surprised to learn that, insofar as “Command and Control” has any heroes, those heroes are Curtis LeMay, Robert McNamara, and Ronald Reagan (plus an Air Force sergeant named Jeff Kennedy, who was involved in responding to the wounded missile in the Arkansas silo). Those men understood the risks of just having these things on the planet, and they tried to keep them from blowing up in our faces.

Until the late nineteen-sixties, nuclear rhetoric was far ahead of nuclear reality. In 1947, two years after the war in Europe ended, the United States had a hundred thousand troops stationed in Germany, and the Soviet Union had 1.2 million. Truman saw the atomic bomb as a great equalizer (the Soviets had not yet developed one), and he allowed Stalin to understand that the United States would use it to stop Soviet aggression in Western Europe. Truman was subsequently startled to find out from the head of the Atomic Energy Commission, David Lilienthal, that the United States had exactly one atomic bomb in its stockpile. The bomb was unassembled, but Lilienthal thought that it could probably be made operative.

It was during the Eisenhower Administration that nuclear weapons became the centerpiece of American military planning. Eisenhower thought that the defense budget was out of control, and building nuclear bombs is cheaper than maintaining a large conventional armed force. His Administration also believed that the doctrine of “massive retaliation”—the promise to meet Soviet aggression with an overwhelming nuclear response—was a deterrent that would keep the peace.

When John F. Kennedy ran for President, in 1960, he charged the Eisenhower Administration with having permitted a “missile gap” to develop between the United States and the Soviet Union—an issue that may have helped Kennedy win a very close election. But, as Eisenhower knew from spy-plane reconnaissance, there was no missile gap in the Soviets’ favor. In 1960, the Soviet Union had just four confirmed intercontinental ballistic missiles. And although Air Force intelligence informed Kennedy, after he took office, that the Soviets might have a thousand ICBMs by the middle of 1961, by the end of that year they had sixteen. In 1962, the Soviet Union had about thirty-three hundred nuclear weapons in its arsenal, and the United States had more than twenty-seven thousand. The Soviets had 36 ICBMs; the Americans had 203.

Soviet nuclear capability was regularly exaggerated by American intelligence in the 1950s, and it was in the interest of the armed services, and particularly the Air Force (not a hero in Schlosser’s story), not to correct the record. For more than ten years, the American government poured money into the manufacture of nuclear weapons, the American public was regularly frightened by warnings about the dangers of a nuclear attack that was always made to appear imminent, and defense intellectuals produced papers and books in which they thought about the unthinkable—how to prepare for, how to avoid, and how to survive a nuclear war.

The threat was largely, although not completely, imaginary. The Soviets didn’t have the capability that nuclear-war scenarios assumed, and there was no good reason to believe that anyone’s nuclear weapons would work the way they were designed to. The Kennedy Administration estimated that seventy-five per cent of the warheads on Polaris missiles (the missiles carried in submarines) would not detonate.

Even the war plans were flawed. An atomic explosion kills by shock waves, by radioactive fallout, and by fire. But, as Lynn Eden explained in “Whole World on Fire” (2004), American military planners never took fire into account when they made estimates of bomb damage. They therefore systematically underestimated the projected effects of nuclear bombing, and that led to the production of far more warheads than anyone needed.

But the threat, even though partly imagined, permitted the military to compile an arsenal that forced the Soviets to compile an arsenal to match it—and thereby to make the threat real. By the early 1970s, the Soviet Union had more long-range missiles than the United States did. By then, the public was no longer transfixed by the spectacle of imminent nuclear war, but the world was a far more dangerous place than it had been in the years of civil-defense exercises and back-yard fallout shelters.

Schlosser’s story brings out the pas-de-deux character of Cold War relations, the habit each side had of copying whatever move the other side had just made. Every strategic advantage was answered with its double. The reason the United States wanted nuclear superiority was not to knock out the Soviet Union but to keep the peace: it wanted the Soviet Union to know that if it ever started a nuclear war it would lose. The Soviets, unsurprisingly, saw the matter differently, so, every time the United States did something that gave it an edge, the Soviets responded, and the edge vanished. The search for stability was inherently destabilizing.

When the United States, in the 1950s, cut back on conventional forces in order to rely on nukes, for example, the Soviets did the same. The Warsaw Pact was the Soviet version of NATO. After the United States created the Strategic Air Command and made it the spearhead of the country’s military power, the Soviets created the Strategic Rocket Forces. When the United States developed the capacity to survive a first strike, the Soviets did the same. The monkeys chased each other up the tree.

The pattern was true even of Cold War domestic policy. In 1947, Truman created, by executive order, a loyalty program for federal employees. A week later, the Central Committee of the Communist Party established the Soviet honor courts, charged with investigating Western influences on Soviet life. The House Un-American Activities Committee began investigating Communists in Hollywood at the same time that Stalin and his cultural commissar, Andrei Zhdanov, started cracking down on artists and writers.

Every move intended to prevent a deliberate nuclear war therefore ended up increasing the risk of an accidental one. Schlosser’s point is not that there was some better way to run a Cold War. It is that the more extensive, elaborate, and fine-tuned the nuclear-weapons system became, the greater its exposure to the effects of an accident. For the system to work—for the warnings to be timely, communications to be transparent, missiles to launch, explosives inside the warheads to detonate, and nuclear cores to fission—everything has to be virtually perfect. The margin for error is tiny. And nothing is perfect.

Schlosser cites Charles Perrow’s “Normal Accidents” (1984) as an inspiration for his book. Perrow argued that in systems characterized by complex interactions and by what he called “tight coupling”—that is, processes that cannot readily be modified or turned off—accidents are normal. They can be expected. And they don’t lend themselves to very satisfying postmortems, since it is often difficult to explain just what stage it was in the cascade of bad events that made them irreversible.

Who was at fault in the Norwegian weather-rocket scare? The Norwegians had, in fact, notified the Russians several weeks in advance of the launch. They hadn’t specified a day, because the launch would depend on weather conditions. Either that notice was sent to the wrong parties in Russia or (which seems more likely) whoever received the notice didn’t grasp the implications or simply forgot to forward it to military authorities.

A mis-sent message is one of the most common errors in the world. Schlosser reminds us that during the Cuban missile crisis messages to Moscow from the Soviet Ambassador in Washington were written by hand and given to a Western Union messenger on a bicycle. “We at the Embassy could only pray,” the Ambassador, Anatoly Dobrynin, later said, “that he would take it to the Western Union office without delay and not stop to chat on the way with some girl.” (It was because of this that, after the crisis was over, the hot line linking the White House and the Kremlin was installed.)

And so, for six minutes in 1995, the future of the species hung in the balance because a mid-level Russian official left work early, or neglected to find a proper procedure for dealing with a message that someone was sending up a rocket, at an unspecified time, to look at the northern lights. It’s like the 46-cent computer chip. There was no redundancy built into the system. If one piece failed, the whole system was imperiled.

The Arkansas incident, in 1980, is well chosen as an illustration of Schlosser’s point. Objects fall inside silos all the time, he says. The chance that a falling socket would puncture the skin of a Titan II missile was extremely remote—but not impossible. When it happened, it triggered a set of mechanical and human responses that quickly led to a nightmare of confusion and misdirection. Once enough oxidizer leaked out and the air pressure inside the tank dropped, the missile would collapse, the remaining oxidizer would come into contact with the rocket fuel, and the missile would explode. Because a nineteen-year-old airman performing regular maintenance accidentally let a socket slip out of his wrench, a Titan II missile became a time bomb, and there was no way to turn off the timer.

And the missile was armed. Schlosser says that the explosive force of the warhead on a Titan II is nine megatons, which is three times the force of all the bombs dropped in the Second World War, including the atomic bombs that destroyed Hiroshima and Nagasaki. If it had detonated, most of the state of Arkansas would have been wiped out.

Few systems are more tightly coupled than the arsenal controlled by the nuclear football. Once the launch codes are entered, a chain of events is set in motion that is almost impossible to interrupt. The “Dr. Strangelove” scenario is quite realistic. The American nuclear-war plan, known as the Single Integrated Operational Plan (SIOP), provided for only one kind of response to an attack: full-scale nuclear war. It was assumed that tens of millions of people would die. There were no post-attack plans. For forty years, this was the American nuclear option. No doubt, the Soviets’ was identical.

Henry Kissinger called the SIOP a “horror strategy.” Even Nixon was appalled by it. Schlosser says that when General George Butler became the head of the Strategic Air Command, in 1991, and read the SIOP he was stunned. “This was the single most absurd and irresponsible document I had ever reviewed in my life,” he told Schlosser. “I came to fully appreciate the truth. . . . We escaped the Cold War without a nuclear holocaust by some combination of skill, luck, and divine intervention, and I suspect the latter in greatest proportion.”

The dangerous people in Schlosser’s story are the people who try to enhance the readiness of nuclear weaponry by reducing the controls on its use. The good people are not the anti-nuke activists. Schlosser is quite dismissive of them, especially the Western Europeans who protested against the Pershing IIs intended to protect them but not against the Soviet missiles right across the border that were aimed at them night and day.

Schlosser’s good people bring order to the system of nuclear armaments or try to find means of limiting its potential effects. When Curtis LeMay became the head of sac, in 1948, the United States was already committed to an announced policy of resisting Communist aggression anywhere in the world—the Truman Doctrine—and to using the threat of atomic weapons as a deterrent. But LeMay found sac to be a lax, undisciplined, and underequipped organization. Training was poor and security measures were almost nonexistent.

LeMay had commanded a bomber group in the Second World War, flying in the lead plane, and his toughness was legendary. He thought the term “limited war” was an oxymoron. His theory of war was that if you kill enough people on the other side they will stop fighting. He fired the top officers at sac and instituted a rigid system of rules and procedures, checklists and practice runs, and turned sac into a model of efficiency. Schlosser suggests that these reforms saved many lives.

Schlosser notes with some regret that LeMay became a symbol of military buffoonery after George C. Scott portrayed him as General Buck Turgidson, in “Dr. Strangelove,” and that he then made a mistake by running for Vice-President, in 1968, on a ticket with the segregationist George Wallace. At a press conference, LeMay declined to rule out the use of nuclear weapons in Vietnam. This position was consistent with his view that war must always be all-out, and, a year later, Nixon sent a signal that he was willing to use hydrogen bombs against the North Vietnamese. But Americans had lost their tolerance for nuclear brinkmanship. This was Strangelove talk.

Schlosser thinks that although Robert McNamara, too, had become one of the most despised figures in American politics by the time he resigned as Lyndon Johnson’s Secretary of Defense, in 1968, he had worked hard to limit the use of nuclear weapons. He had improved American early-warning systems; he had tried, with minimal success, to revise the siop; and he worked to have the Soviets understand that the United States would attack only military targets, encouraging them to do the same. But Vietnam brought him down.

Schlosser is careful not to give Ronald Reagan too much credit for defusing the arms race. He thinks that Reagan’s offer to eliminate all nuclear weapons during his famous summit meeting with Gorbachev in Reykjavik, in 1986, was partly a response to changes in American public opinion regarding nukes. But he also thinks that, although Reagan’s offer went nowhere (because he refused to cancel the Strategic Defense Initiative, the anti-missile system known as Star Wars), Reykjavik was “a turning point in the Cold War.” It convinced Gorbachev that the United States would not attack the Soviet Union, which enabled him to pursue his reform agenda, and eventually led to the removal of all intermediate-range missiles from Western Europe.

David Holloway, a historian of the period, once raised the question whether the nuclear arms race was a product of the Cold War or a cause. The bomb is inextricable from Cold War history because it was present at the very start. Truman’s principal reason for deciding to drop the bomb on Japan was to bring the war in the Pacific to a quick end, but his secondary one was to erect a psychological obstacle to any Soviet plans for postwar expansion. He wanted the Soviets to understand that the United States had no qualms about answering aggression with atomic weapons. (Ending the war quickly was itself a way to prevent the Soviets from acquiring territory in the Pacific while fighting was under way there, and then colonizing it, as they did in Eastern Europe.)

Cold wars are historically common events. They are just ways of gaining geopolitical advantage without military battles. In the seventeenth century, Louis XIV fought cold wars with his European neighbors and with the papacy. What made the American Cold War different was not the bomb itself but the idea of the bomb, the bomb as the symbol of ultimate commitment. That idea is what locked the East-West antagonism into place, and raised the stakes in every disagreement. The bomb may have prevented military conflict between the superpowers; it did not prevent the many superpower proxy wars—in Korea, Vietnam, Nicaragua, Afghanistan—in which millions of people died. In the end, the Soviet Union gave up, something that no one had predicted. But today many smaller powers have nuclear weapons, and even in the unlikely event that no leader of one of those nations ever decides to use them, out of fear or anger, there is always the possibility—in the long run, there is the inevitability—of an accident.

Posted in Nuclear Books, Nuclear War | Tagged , , , | 3 Comments

What on earth is exergy?

Preface. This is one of the best explanations of exergy I’ve been able to find.  This paper makes the case that exergy ought to be considered by just about every industry and government to achieve greater energy efficiency, and makes the case that in many ways exergy is a more valuable measure than energy use when combined with mineral depletion.

My favorite example was:

“The need to take the quality of energy into account can be shown with a simple everyday example.  Take an office space and a car battery. The energy contained in the movement of air molecules in a 68 degree 20 cubic meter office is more than the energy stored in three standard 12 volt car batteries. But you can only use the energy in the air to keep yourself warm, while the energy in the batteries will start your car, cook your lunch, and run your computer.  The reason is that even if their quantities are the same, the quality – or usefulness – of the energy in the air and in the battery is different. In the air, the energy is randomly distributed, not readily accessible, and not easily used for anything other than keeping you warm.  But the electric battery energy is concentrated, controllable, and available for all sorts of uses. This difference is taken into account by exergy.”

But you really ought to go to the original source: https://www.scienceeurope.org/wp-content/uploads/2016/06/SE_Exergy_Brochure.pdf since I’ve left out the explanatory charts, graphs, and about a quarter of the information, especially the pages of how exergy should be used in policy-making, which those of you who are trying to slow down or lessen the impact of the Great Simplification might find the most interesting.

Alice Friedemann   www.energyskeptic.com  author of “When Trucks Stop Running: Energy and the Future of Transportation”, 2015, Springer and “Crunch! Whole Grain Artisan Chips and Crackers”. Podcasts: Practical Prepping, KunstlerCast 253, KunstlerCast278, Peak Prosperity , XX2 report

***

Brockway, P., et al. 2016. In a resource-constrained world: Think Exergy, not energy. Science Europe.

Exergy

It’s necessary to measure improved energy and resource efficiencies, but how? Of course, the amount of energy and raw materials that go into making something, or that go into services such as heating, communication, or transport, can be easily measured.  However, that does not consider the quality of the energy nor the rarity of the materials used. In order to account for the quality and not just the quantity of energy, as well as factoring in the raw materials used, we need to measure exergy.

Exergy can be considered to be useful energy, or the ability of energy to do work. Exergy can be measured not only for individual processes, but also for entire industries, and even for whole national economies. It provides a firm basis from which to judge the effect of policy measures taken to improve energy and resource efficiency, and to mitigate the effects of climate change.

Exergy as a Measure of Energy Quality

The need to take the quality of energy into account can be shown with a simple everyday example.  Take an office space and a car battery. The energy contained in the movement of air molecules in a 68 degree 20 cubic meter office is more than the energy stored in three standard 12 volt car batteries. But you can only use the energy in the air to keep yourself warm, while the energy in the batteries will start your car, cook your lunch, and run your computer.  The reason is that even if their quantities are the same, the quality – or usefulness – of the energy in the air and in the battery is different. In the air, the energy is randomly distributed, not readily accessible, and not easily used for anything other than keeping you warm.  But the electric battery energy is concentrated, controllable, and available for all sorts of uses. This difference is taken into account by exergy.

Thermodynamics is the Science of Energy

The concept of exergy is inextricably contained within the basic physical laws governing energy and resources, called thermodynamics.  These laws cannot be ignored: they are fundamental . Two of the basic laws in thermodynamics need to be considered:

First – Energy is conserved.

Second – heat cannot be fully converted into useful energy.  This second law concerns the concept of exergy. Every energy-conversion process destroys exergy. Take for example a conventional fossil fuel power station. Such a station transforms the chemical energy stored in coal to produce steam in a boiler, which is then converted by a turbine into mechanical energy and finally by a generator into electricity. in this process, only 30–35% of the chemical energy contained in the coal is converted into electrical energy; the remaining 65–70% is lost in the form of heat. Exergy analysis of this power generation plant identifies the boiler and turbine as the major sources of exergy loss. In order to improve the exergy efficiency, the boiler and turbine systems need to be altered through technical design and operational changes.

Exergy as a Measure of Resource Quality

Exergy can also be applied in order to take the quality of resources into account. A diluted resource is much more difficult to use than a concentrated one, as it first has to be collected or refined. The measure to take the concentration of a resource into account is its chemical potential (or chemical exergy).  The chemical potential of pure iron is much higher than the chemical potential of an iron ore diluted by other rocks.

An exergy consideration of any process takes into account the chemical potential of the resources used in the process. The problem with chemical potentials, however, is that it is only possible to measure their difference. In order to study the chemical potential of a specific resource, a reference point is needed. An interesting proposal as a reference point for natural minerals is the concept of ‘thanatia’, a hypothetical version of our planet where all mineral deposits have been exploited and their materials have been dispersed throughout the crust. Using thanatia as a model, it is possible to determine the exergy content of the Earth’s resources. By adding up all exergy expenditures, the rarity of resources and their products can be assessed.

Exergy Destruction in the Process Industry

Industry is a large user of both material and energy resources. Typically, an industrial production process needs the input of materials and of energy to transform those materials into products. Much of these inputs end up being discarded: in the case of materials as waste, and in the case of energy as heat. This is exergy destruction, since – recalling the Second Law of thermodynamics – not all inputs can be fully recovered as useful energy.

Methanol, for example, is a primary liquid petrochemical manufactured from natural gas. It is a key component of hundreds of chemicals that are integral parts of our daily lives such as plastics, synthetic fibers, adhesives, insulation, paints, pigments, and dyes. Before methanol production even begins, 10% of the natural gas is used to warm the chemical reactor. Subsequently, during production further reactor losses amount to 50%. This contributes to the exergy destruction footprint of methanol production and of all its products.

How can we Increase the Energy Efficiency of Production?

While exergy destruction for any process is never zero, it can be minimized. Every process has a characteristic exergy-destruction footprint. Knowledge of this footprint can be used to rationalize resource choices before production begins and to monitor the use of energy and resources during production. In a full life-cycle approach, it can be used to consider the total energy and resource ‘cost’ of a product: essentially its exergy-destruction footprint.

An example of a process where reducing exergy destruction can increase energy efficiency is distillation. Distillation is the most commonly applied separation technology in the world, responsible for up to 50% of both capital and operating costs in industrial processes. It is a process used to separate the different substances from a liquid mixture by selective evaporation and condensation. Commercially, distillation has many applications; in the previous example of methanol production, it is used to purify the methanol by removing reaction byproducts from it, such as water. The conventional separation of chemicals by distillation occurs in a column that is heated from below by a boiler, with the desired product (referred to as the condensate) produced from a condenser at the top. The exergy efficiency of this distillation setup is about 30%.

The obvious question is whether the same distillation results can be achieved with a higher exergy efficiency by operating the column differently. The answer to that question is yes, as there are better ways to add heat to the column than by a boiler. The boiler and condenser can be replaced by a series of heat exchangers along the column, producing a more exergy-efficient heating pattern. This arrangement minimizes the exergy destruction in the system, reducing the exergy footprint of the process. In this way, the same product can be obtained with only 60% of the original exergy loss.  This of course requires investment in replacing or retrofitting the technology, but in the long run such costs are compensated by lower operating costs.  Financial benefits aside, the potential impact of technological development driven by exergy analysis on the energy  and material efficiency of industry,  is enormous.

The Exergy Destruction Footprint – Developing More Environmental friendly Technologies

When exergy analysis is performed on a process, the exergy losses can be identified and the exergy-destruction footprint can be minimized. In the fossil fuel industry, single- and two-stage crude oil distillation are used to obtain materials from crude oil for fuels and for chemical feedstocks.

A single-stage system consists of a single heating furnace and a distillation column; a two-stage system adds another furnace (to heat the product of the first unit) and a second column.  Tests have shown that the two stage system has a much higher efficiency – 31.5% versus 14 for a single stage process.  This is because the two stage system can be better controlled than the one-stage system.  Adding more stages gives even better control.

It is important to keep in mind that there is no production without an exergy destruction footprint. 

A Large-scale Problem Needs a Common-scale Solution

In 2013, industry accounted for 25% of the EU’s total final energy consumption, making it the third-largest end-user after buildings and transport. Over 50% of industry’s total final energy consumption is attributed to just three sectors: iron and steel, chemical and pharmaceutical, and petroleum and refineries.

Between 2001 and 2011, EU industry reduced its energy intensity by 19%. However, significant efficiency potential remains. As previous examples of several industrial processes have shown, exergy analysis offers a guide to the development of more energy-efficient technologies and provides an objective basis for the comparison of sustainable alternatives. Energy analysis explains that electric and thermal energy are equivalent according to the First Law of thermodynamics, and that heating by an electric resistance heater can be 100% efficient. Exergy analysis, however, explains that heating by an electric heater wastes useful energy. When we know about this kind of waste, we can start to reduce it by minimizing exergy destruction. While the given examples have focused on industrial processes, exergy analysis can also tackle the energy and resource efficiency of larger consumers of energy, such as the buildings and transport sectors. It is important to highlight that exergy analysis can be used not only to quantify the historical resource use, efficiency and environmental performance, but also to explore future transport pathways, building structures and industrial processes.

As explained in the Opinion Paper “A common Scale for Our common Future: Exergy, a thermodynamic metric for Energy”, a major roadblock for implementing – or even finding – solutions to our societal challenges is the fact that energy and resource efficiency are commonly defined in economic, environmental, physical, and even political terms. Exergy is the resource of value, and considering it as such requires a cultural shift to the thermodynamic-metric approach of energy analysis. Exergy provides an apolitical scale to guide our judgement on the road to sustainability. Exergy is first step to a common-scale solution  to our large-scale problems.

ADOPTING EXERGY EFFICIENCY AS THE COMMON NATIONAL ENERGY-EFFICIENCY METRIC

Energy Efficiency as a Key Climate Policy: the Need to Measure Progress with Exergy

Improving the efficiency of energy use and transitioning to renewable energy are the two main climate policies aimed at meeting global carbon-reduction targets. The 2009 renewable Energy Directive mandates that 20% of energy consumed in the EU should be renewable by 2020.  At the same time, the EU’s 2012 Energy Efficiency Directive sets a 20% reduction target for energy use. Progress towards the renewable-energy target is straightforward to measure, since national energy use by renewable sources is collected and readily available. Indeed, for many citizens, the proportion of domestic electrical energy generated from renewable sources appears clearly defined on their electricity bills. In contrast, national-scale energy efficiency remains unclear and a qualitative comparison of renewable sources is lacking. A central problem is that there is no single, universal definition of national energy efficiency. In this void, a wide range of metrics is inconsistently adopted, based on economic activity, physical intensity or hybrid economic– physical indicators.

None of these methods are based on thermodynamics, however, making them inherently incapable of measuring energy efficiency in a meaningful way. As such, they are unable to contribute to evidence-based policy making or to measure progress towards energy efficiency targets. The EU is not alone, there is currently no national-scale thermodynamic based reporting of energy efficiency by any country in the world. Second-law thermodynamic efficiency – in other words, exergy efficiency – stands alone in offering a common scale for national, economy-wide energy efficiency measurement, applicable at all scales and across all sectors.

NATURAL RESOURCE CONSUMPTION

From Gaia to Thanatia: How to Assess the Loss of Natural Resources

As technology today uses an increasing number of elements from the periodic table, the demand for raw materials profoundly impacts on the mining sector. As ever lower grades of ore are being extracted from the earth, the use of energy, water and waste rock per unit of extracted material increases, resulting in greater environmental and social impact. Globally, the metal sector requires about 10% of the total primary energy consumption, mostly provided by fossil fuels. By 2050, the demand for many minerals, including gold, silver, indium, nickel, tin, copper, zinc, lead, and antimony, is predicted to be greater than their current reserves. Regrettably, many rare elements are profusely used, with limited recycling.

The loss of natural resources cannot be expressed in money, which is a volatile unit of measurement that is too far removed from the objective reality of physical loss. Neither can it be expressed in tonnage or energy alone, as these do not capture quality and value. Exergy can solve such shortcomings and be applied to resource consumption through the idea of ‘exergy cost’: the embodied exergy of any material, which takes the concentration of resources into account measured with reference to the ‘dead state’ of thanatia.

Thanatia – from the greek  personification of  Death – is a hypothetical dead state of the anthroposphere, conceiving an ultimate landfill where all mineral resources are irreversibly lost and dispersed, or in other words, at an evenly distributed crustal composition. If our society is squandering the natural resources that the Sun and geological evolution of the Earth have stored, we are converting their chemical exergy into a degraded environment that progressively becomes less able to support usual economic activities and eventually will fail to sustain life itself. The end state would be thanatia, a possible end to the ‘anthropocene’ period. It does not represent the end of life on our planet, but it does imply that mineral resources are no longer available in a concentrated form.

An Essential approach to making better use of our mineral resources: the application of mineral exergy rarity

The exergy of a mineral resource as calculated with thanatia as a reference can be measured as the minimum energy that could be used to extract that resource from bare rocks, instead of from its current mineral deposit. This is an essential approach, since the European commission’s communication ‘towards a circular Economy: a Zero Waste Programme for Europe’, states that “valuable materials are leaking from our economies” and that “pressure on resources is causing greater environmental degradation and fragility, Europe can benefit economically and environmentally from making better use of those resources.” Applied to minerals we can define a ‘mineral Exergy rarity’ (in kWh) as “the amount of exergy resources needed to obtain a mineral commodity from bare  rocks, using prevailing technologies”. Tthe ‘exergy rarity’ concept is thus able to quantify the rate of mineral capital depletion, taking a completely resource exhausted planet as a reference. This rarity assessment allows for a complete vision of mineral resources via a cradle-to-grave analysis. Exergy rarity is, in fact, a measure of the exergy-destruction footprint of a mineral, taking thanatia as a reference.

Given a certain state of technology, the exergy rarity is an identifying property of any commodity incorporating metals. Hence, exergy rarity (in kWh/kg) may be assessed for all mineral resources and artefacts thereof, from raw materials and chemical substances to electric and electronic appliances, renewable energies, and new materials. Especially those made with critical raw materials, whose recycling and recovery technologies should further enhance. Such thinking is a step towards “a better preservation of the Earth’s resources endowment and the use of the Laws of Thermodynamics for the assessment of energy and material resources as well as the planet’s dissipation of useful energy”. More than ever, the issue of dwindling resources needs an integrated global approach. Issues such as assessing exhaustion, dispersal, or scarcity are absent from economic considerations. An annual exergy content account of not only production, but of the depletion and dispersion of raw materials would enable a sound management of our material resources. Unfortunately, similar to the problem of inconsistent national energy-efficiency measurement, there is also a lack of consistency in natural-resource assessment, which is necessary for effective policy making.

It is time to charge for exergy use rather than for energy use. in the future, consumers should be informed about products and services in terms of their exergy content and destruction footprints in much the same way as they are about carbon emissions, and pay the price accordingly. that gives a scientific basis for charging for loss of valuable resources.

The energy and exergy used in production, operation and destruction must be paid back during life time in order to be sustainable. LCEA shows that solar thermal plants have much longer exergy payback time than energy payback time, 15.4 and 3.5 years respectively. Energy based analysis may lead to false assumptions in the evaluation of the sustainability of renewable energy systems.

References

  1. Science Europe Scientific committee for the Physical, chemical and mathematical Sciences, “a common Scale for Our common Future: Exergy, a thermodynamic metric for Energy, http://scieur.org/op-exergy
  2. a. valero capilla and a. valero Delgado, “thanatia: the Destiny of the Earth’s mineral resources, a thermodynamic cradle-to-cradle assessment”, World Scientific Publishing: Singapore, 2014.
  3. S. Kjelstrup, D. bedeaux, E. Johannessen, J. gross, “non-Equilibrium thermodynamics for Engineers”, World Scientific, 2010, see chapter 10 and references therein.
  4. h. al-muslim, i. Dincer and S.m. Zubair, “Exergy analysis of Single- and two-Stage crude Oil Distillation units”, Journal of Energy resources technology 125(3), 199–207, 2003. 5. SEt-Plan Secretariat, SEt-Plan actiOn n°6, DraFt iSSuES PaPEr, “continue efforts to make Eu industry less energy intensive and more competitive”, 25/01/2016,    https://setis.ec.europa.eu/system/files/issues_paper_action6_ee_industry.pdf
  5. European Parliament. Directive 2009/28/Ec of the European Parliament and of the council of 23 april 2009. Official Journal of the European union L140/16, 23.04.2009, pp. 16–62.
  6. European Parliament. Directive 2012/27/Eu of the European Parliament and of the council of 25 October 2012 on energy efficiency. Official Journal of the European union L315/1, 25.10.2012.
  7. P.E. brockway, J.r. barrett, t.J.  Foxon, and J.K.  Steinberger, “Divergence of trends in   uS and uK aggregate exergy efficiencies 1960–2010”, Environmental Science and   technology 48, 9874–9881, 2014.
  8. P.E. brockway, J.K. Steinberger, J.r. barrett, and t.J. Foxon, “understanding china’s past and future energy demand: an exergy efficiency and decomposition analysis”, applied Energy 155, 892– 903, 2015.
  9. Presentation of the “World Energy Outlook – 2015 Special report on Energy and climate”, presented by the international Energy agency’s Executive Director Fatih birol at the Eu Sustainable Energy Week, 2015.
  10. C.J. Koroneos, E.a. nanaki and g.a. xydis, “Sustainability indicators for the use of resources –the Exergy approach”, Sustainability 4, 1867–1878, 2012.
  11. http://eur-lex.europa.eu/legal-content/En/txt/?uri=cELEx%3a52014Dc0398 13. appeal to un and Eu by researchers who attended the 12th biannual Joint European thermodynamics conference, held in brescia, italy, from July 1, international Journal of thermodynamics 16(3), 2013.
  12. Federal nonnuclear energy research and development act of 1974,Public Law 93–577, http://legcounsel.house.gov/comps/Federal%20nonnuclear%20 Energy%20research%20and%20Development%20act%20Of%201974.pdf
  13. D. Favrat, F. marechal and O. Epelly, “the challenge of introducing an exergy indicator in a local law on energy”, Energy, 33, 130–136, 2008.
Posted in Exergy | 2 Comments

Solar PV requires too much land to replace fossils

Preface. This is a brief summary of the Capellan-Perez paper that calculates the land needed to use solar to replace electricity as well as the land needed if solar were to replace all of societies use of energy (i.e. transportation, manufacturing, industry, heating of homes and buildings, and so on).  The land needed in 40 different nations was estimated for each of these cases.

Another study I stumbled on looking for more insight into this paper estimates that 16 of 48 states in the U.S. have insufficient land for solar power to replace fossil fuels (Li 2018).

The authors estimates of the land needed, while five to ten times higher than other researchers, is still quite generous.  They don’t subtract land total unsuitable for solar farms, which require:  level ground, preferably south-facing, near high transmission capacity lines, within a power grid that can handle the excess capacity produced, not in a sensitive or protected area, and able to overcome all opposition such as military objections, NIMBY, and financially feasible, since often in areas with several solar farms speculators drive up land prices. So whatever their land estimates, the actual suitable land is probably much less.

Here is the press release from Universidad de Valladolid that does a good job of summarizing the paper which I found at the last minute:

“While fossil fuels represent concentrated underground deposits of energy, renewable energy sources are spread and dispersed along the territory. Hence, the transition to renewable energies will intensify the global competition for land. In this analysis, we have estimated the land-use requirements to supply all currently consumed electricity and final energy with domestic solar energy for 40 countries (27 member states of the European Union (EU-27), and 13 non-EU countries: Australia, Brazil, Canada, China, India, Indonesia, Japan, South Korea, Mexico, Russia, Turkey, and the USA). We focus on solar since it has the highest power density and biophysical potential among renewables.

The results show that for many advanced capitalist economies the land requirements to cover their current electricity consumption would be substantial, the situation being especially challenging for those located in northern latitudes with high population densities and high electricity consumption per capita. Replication of the exercise to explore the land-use requirements associated with a transition to a 100% solar powered economy indicates this transition may be physically unfeasible for countries such as Japan and most of the EU-27 member states. Their vulnerability is aggravated when accounting for the electricity and final energy footprint, i.e., the net embodied energy in international trade. If current dynamics continue, emerging countries such as India might reach a similar situation in the future.

Overall, our results indicate that the transition to renewable energies maintaining the current levels of energy consumption has the potential to create new vulnerabilities and/or reinforce existing ones in terms of energy, food security and biodiversity conservation.”

Alice Friedemann   www.energyskeptic.com  author of “When Trucks Stop Running: Energy and the Future of Transportation”, 2015, Springer and “Crunch! Whole Grain Artisan Chips and Crackers”. Podcasts: Practical Prepping, KunstlerCast 253, KunstlerCast278, Peak Prosperity , XX2 report

***

Capellan-Perez, I., et al. 2017. Assessing vulnerabilities and limits in the transition to renewable energies: Land requirements under 100% solar energy scenarios. Renewable and Sustainable Energy Reviews 77: 760-782 

https://www.researchgate.net/publication/316643762_Assessing_vulnerabilities_and_limits_in_the_transition_to_renewable_energies_Land_requirements_under_100_solar_energy_scenarios

The transition to renewable energies will intensify the global competition for land because wind and solar energy are highly dispersed and need large areas to capture this energy.  Yet most analyses have concluded that land will not pose a problem.  We focus on solar alone because it has a higher power density than wind, hydro, or biomass.

In this paper we estimate the land-use requirements to supply all currently consumed electricity and final energy with domestic solar energy for 40 countries considering two key issues that are usually not taken into account: (1) the need to cope with the variability of the solar resource from the highs of summer to the lows of winter, and (2) a realistic estimate of the land solar technologies will occupy.

Our results show that for many advanced capitalist economies the land requirements to cover their current electricity consumption would be substantial, the situation being especially challenging for those located in northern latitudes with high populations and electricity consumption per capita.

Assessing the implications in terms of land availability (i.e., land not already used for human activities), to generate electricity only, the EU-27 requires half of its available land.

If solar power were to supply all energy used, not just electricity – in other words, the energy contained in oil, coal, and natural gas used for transportation, industry, chemicals, cement, steel, mining, and myriad other endeavors, there isn’t enough land in Japan and most of the EU-27 states.

Why?  Because the power density of solar is such a tiny fraction of what fossils provide us now. Fossils are very concentrated energy that can be consumed at high power rates of up to 11,000 electric averaged watts per square meter  (We/m2).  But the net power density of solar power plants is just 2–10 We/m2) which is 1,100 to 5,500 times less than fossils.   Wind requires even more space than solar at 0.5–2 We/m2, and hydropower as well with 0.5–7 We/m2, with biomass coming in dead last ~0.1 We/m2 at over one hundred thousand times less energy per square meter.

Solar power is intermittent and has high seasonal variability, so a redundant capacity as well as storage capacity is essential.  So for redundant capacity, if one megawatt of solar is produced on 6-8 acres of land, at least three times more land would be needed to gather solar power for the majority of the day (in the united states solar availability is on average 4.8 hours/day) when there’s little or no sun and during winter.  Additional land would be also be needed for energy storage, especially for the only commercial solution that exists, hydroelectric and pumped hydro storage, whose reservoirs take up a great deal of land.  For these reasons and many others, the authors estimate that a realistic land area is five to ten times higher than what other scientists have estimated.

The authors also note that their calculations are very conservative since they don’t take into account the International Energy Agency (IEA) estimate that world electricity demand will grow 2.1% per year on average between 2012 and 2040 (i.e., +80% cumulative growth in the period). In that case the amount of land needed is much higher than our estimate for current electricity consumption.

Another disadvantage of solar PV farms is that they compete with agriculture for land, both of which need level land, and solar can also reduce biodiversity where ever it’s placed.

When the authors say “available land”, that means solar farms are competing for all the other uses we have for land, to build homes, infrastructure, grow fiber, food, and so on.

Conclusion

Solar to replace all electricity generation only

Our findings show that the land needed is substantial, especially for those in northern latitudes with high population densities and high electricity consumption per capita such as the Netherlands, Belgium, the UK, Luxembourg, South Korea, Germany, Finland, Taiwan, Denmark and Japan (10–50% of available land). Moreover, accounting for the electricity footprint, i.e., for the net energy embodied in international trade (the energy used in China and India would need to come back to these 40 nations to provide power in a world fueled only by solar power), which increases the amount of land to 11 to 60%.

Solar to replace all energy used by societ

This is not possible for many nations within their own borders, especially the Netherlands, Luxembourg, Belgium, the UK, Denmark, Germany, South Korea, Taiwan, Finland, Japan, Ireland, Czech Republic, Sweden, Poland, Estonia and Italy.

End note: I had some trouble understanding this paper, partly because of the English used, and the academic language nearly all papers are written in, which is always a battle to translate.  I’m sure I missed a lot of good stuff because of it, so read the paper if this interests you.

Reference

Li, Y., et al. 2018. Land availability, utilization, and intensification for a solar powered economy. Proceedings of the 13th international symposioum on process systems engineering.


Posted in Solar | Tagged , , , , , | 8 Comments

75% of Earth’s land is degraded threatening 3.2 billion people

Source: United Nations University


Preface. By 2050 95% of Earth’s land could be degraded and reducing or even preventing food production, forcing hundreds of millions to migrate.

More than 75% of our planet has been altered by humans, a figure that will likely rise to more than 90% by 2050, according to the first comprehensive assessment of land degradation and its impacts. The report, released this week by the Intergovernmental Science-Policy Platform on Biodiversity and Ecosystem Services, was prepared by more than 100 experts from around the world. Crops and livestock affect the greatest area—a third of all land—by contributing to soil erosion and water pollution. Wetlands are among the most impacted of ecosystems; 87% have been destroyed over the past 3 centuries (Science 2018).  An even longer and more detailed report than that in the National Geographic below is here.

Alice Friedemann  www.energyskeptic.com  Author of Life After Fossil Fuels: A Reality Check on Alternative Energy; When Trucks Stop Running: Energy and the Future of Transportation”, Barriers to Making Algal Biofuels, & “Crunch! Whole Grain Artisan Chips and Crackers”.  Women in ecology  Podcasts: WGBH, Jore, Planet: Critical, Crazy Town, Collapse Chronicles, Derrick Jensen, Practical Prepping, Kunstler 253 &278, Peak Prosperity,  Index of best energyskeptic posts

***

Leahy S (2018) 75% of Earth’s Land Areas Are Degraded. A new report warns that environmental damage threatens the well-being of 3.2 billion people.  National Geographic.

More than 75% of Earth’s land areas are substantially degraded, undermining the well-being of 3.2 billion people, according to the world’s first comprehensive, evidence-based assessment. These lands that have either become deserts, are polluted, or have been deforested and converted to agricultural production and are also the main causes of species extinctions.

If this trend continues, 95% of the Earth’s land areas could become degraded by 2050. That would potentially force hundreds of millions of people to migrate, as food production collapses in many places, the report warns. (Learn more about biodiversity under threat.)

“Land degradation, biodiversity loss, and climate change are three different faces of the same central challenge: the increasingly dangerous impact of our choices on the health of our natural environment,” said Sir Robert Watson, chair of the Intergovernmental Science-Policy Platform on Biodiversity and Ecosystem Services (IPBES), which produced the report (launched Monday in Medellin, Colombia).

IPBES is the “IPCC for biodiversity”—a scientific assessment of the status of non-human life that makes up the Earth’s life-support system. The land degradation assessment took three years and more than 100 leading experts from 45 countries.

Rapid expansion and unsustainable management of croplands and grazing lands is the main driver of land degradation, causing significant loss of biodiversity and impacting food security, water purification, the provision of energy, and other contributions of nature essential to people. This has reached “critical levels” in many parts of the world, Watson said in an interview.

Underlying Causes

Wetlands have been hit hardest, with 87% lost globally in the last 300 years. Some 54% have been lost since 1900. Wetlands continue to be destroyed in Southeast Asia and the Congo region of Africa, mainly to plant oil palm.

Underlying drivers of land degradation, says the report, are the high-consumption lifestyles in the most developed economies, combined with rising consumption in developing and emerging economies. High and rising per capita consumption, amplified by continued population growth in many parts of the world, are driving unsustainable levels of agricultural expansion, natural resource and mineral extraction, and urbanization.

Land degradation is rarely considered an urgent issue by most governments. Ending land degradation and restoring degraded land would get humanity one third of the way to keeping global warming below 2°C, the target climate scientists say we need to avoid the most devastating impacts. Deforestation alone accounts for 10 percent of all human-induced emissions.

Reference

News at a Glance. 2018. Alarm over land degradation. Science 359: 1444.

Posted in Biodiversity Loss, Limits To Growth, Peak Food | Tagged , , , | Comments Off on 75% of Earth’s land is degraded threatening 3.2 billion people

One less worry: the magnetic field flipping between north and south poles is not the end of the world

Preface.  The geomagnetic field reversal of polarity has occurred thousands of times in the geological past. We are overdue for another. Indeed, Earth’s dipole has decreased in strength by nearly 10% since it was first measured in 1840. It could happen within the next 2,000 years.

If the magnetic poles flip, it is likely solar radiation storms will crash power grids, satellites, and electronic communications for 10,000 years based on what we know of past reversals.

But not to worry, by 2100 there won’t be an electric grid, satellites, and electronic communications because there won’t be enough oil, coal, and natural gas left to run them.  Or wind and solar power, which also depend on fossils every single step of their life cycle.

By the time the poles flip, we’ll be back to horse drawn carriages, so not having GPS won’t be a big deal.   In a world that’s gone back to wood as the main energy and infrastructure resource, as in all past civilizations before fossils, no one is likely to even even notice the magnetic field is weak. Though we should feel sorry for migrating birds, it might throw them for a loop.

Theoretical physicist Richard Feynman once tried to describe what a magnetic field looked like: “Is it any different from trying to imagine a room full of invisible angels? No, it’s not like imagining invisible angels. It requires a much higher degree of imagination to understand the electromagnetic field than to understand invisible angels.”

Perhaps Feynman would have a better idea of what a magnetic field looks like if he’d gone to the arctic circle in the winter — auroras are electromagnetic fields shimmering and dancing across the night sky.

Though Feynman’s superstitious image is apt because the study of magnetism used to be part of religion, magic and natural philosophy. If the author had written this book a few hundred years ago, she might have been burned at the stake for her heresy.

Sure, if the poles flipped within the next 50 years, it would be a real disaster, just see my posts on an electromagnetic pulse here for details.  But the odds are good your great grandchild won’t even know it’s happened.

Alice Friedemann   www.energyskeptic.com  author of “When Trucks Stop Running: Energy and the Future of Transportation”, 2015, Springer and “Crunch! Whole Grain Artisan Chips and Crackers”. Podcasts: Derrick Jensen, Practical Prepping, KunstlerCast 253, KunstlerCast278, Peak Prosperity , XX2 report

***

Buffett, B. 2018. A candid portrait of the scientists studying Earth’s declining magnetism warns of potential peril if the poles swap places. Science.

A book review of Alanna Mitchel, 2018, “The Spinning Magnet: The Electromagnetic Force That Created the Modern World–and Could Destroy It”, Dutton.

Earth’s magnetic field protects the environment from the harsh conditions of space and its strength has been declining since Carl Friedrich Gauss measured this in the 1830s. The decline suggests that the magnetic field may flip in less than 2,000 years.  The last time this happened was 780,000 years ago.

The outcome would be a substantial lowering of our protective shield.Should that happen again, the weak magnetic field would wreak havoc on our power grids and other infrastructure.

Recent examples of failures in this protective barrier (Kappenman 1997) serve to highlight the problem. A large solar storm in March 1989 sent high levels of charged particles streaming toward Earth. These particles impinged on the magnetic field and induced electric currents through power grids in Quebec, Canada. The ensuing blackout affected 6 million customers. A reduction in the field strength would allow charged particles to penetrate deeper into the Earth system, causing greater damage with even modest solar storms. A substantial and sustained collapse of the magnetic field during a reversal would likely end our present system of power distribution.

Throughout the book, there is a clear and effective attempt to cast a spotlight on the individuals who have contributed to our understanding of Earth’s magnetic field. Mitchell has a sharp eye for mannerisms and a vivid way of bringing personalities to the page. Her explanations are aimed at a nontechnical audience, and the analogies she uses to describe complex scientific ideas are always entertaining. For example, a crowded washroom at a “beer-soaked” sporting event serves as the starting point for an illustration of Pauli’s exclusion principle. Her enthusiasm for the book’s subject matter shines throughout.

There is little doubt that the magnetic field will reverse again. In the meantime, The Spinning Magnet gives readers a nontechnical description of electromagnetism and a measured assessment of the possible consequences for our modern world if it does so in the near future.

Reference

Kappenman, J. G., et al. 1997. Space weather from a user’s perspective: Geomagnetic storm forecasts and the power industry. American Geophysics Union 78: 37-45

Posted in Electric Grid & EMP Electromagnetic Pulse | Tagged , | Comments Off on One less worry: the magnetic field flipping between north and south poles is not the end of the world

Crash alert: China’s resource crisis could be the trigger

Preface.  Way to go Nafeez Ahmed, your second home run of reality based reporting on the energy crisis this week.  There are countless economists within the mainstream media predicting an economic crisis worse than in 2008, but they totally ignore energy. How refreshing to see an article where energy is front and center in explaining why there may be an economic crash in the future.

Alice Friedemann   www.energyskeptic.com  author of “When Trucks Stop Running: Energy and the Future of Transportation”, 2015, Springer and “Crunch! Whole Grain Artisan Chips and Crackers”. Podcasts: Derrick Jensen, Practical Prepping, KunstlerCast 253, KunstlerCast278, Peak Prosperity , XX2 report

Nafeez Ahmed. September 12, 2018. The next financial crash is imminent, and China’s resource crisis could be the trigger. Over three decades, the value of energy China extracts from its domestic oil, gas and coal supplies has plummeted by half. Medium.com

China’s economic slowdown could be a key trigger of the coming global financial crisis, but one of its core drivers — China’s dwindling supplies of cheap domestic energy — is little understood by mainstream economists.

All eyes are on China as the world braces itself for what a growing number of financial analysts warn could be another global economic recession.

In a BBC interview to mark the 10th anniversary of the global financial crisis, Bank of England Governor Mark Carney described China as “one of the bigger risks” to global financial stability.

The Chinese “financial sector has developed very rapidly, and it has many of the same assumptions that were made in the run-up to the last financial crisis,” he warned:

“Could something like this happen again?… Could there be a trigger for a crisis — if we’re complacent, of course it could.”

Since 2007, China’s debts have quadrupled. According to the IMF, its total debt is now about 234 percent of gross GDP, which could rise to 300 percent by 2022. British financial journalist Harvey Jones catalogues a range of observations from several economists essentially warning that official data might not reflect how bad China’s economy is actually decelerating.

The great hope is that all this is merely a temporary blip as China transitions from a focus on manufacturing and exports toward domestic consumption and services.

Meanwhile, China’s annual rate of growth continues to decline. The British Foreign Office (FCO) has been monitoring China’s economic woes closely, and in a recent spate of monthly briefings this year has charted what appears to be its inevitable decline.

Last month, the FCO’s China Economics Network based out of the British Embassy in Beijing documented that China’s economy had “further softened… with indicators weakening across the board”.

The report found that: “Investment, industrial production, and retail sales all weakened, despite easing measures”; and noted that high-level Chinese measures to sustain economic growth were running out of steam.

China’s economic slowdown, moreover, coincides with brewing expectations that Wall Street’s longest running stock market bull run could be about to end soon.

One analysis of this sort came from Wall Street veteran Mark Newton, former Chief Technical Analyst at multi-billion dollar hedge fund Greywolf Capital, and prior to that a Morgan Stanley technical strategist.

Newton predicts that US stocks are close to peaking out, leading to a massive 40–50 percent plunge starting in the spring of 2019 or by 2020 at the latest. He explained that:

“Technically there have started to be warning signs with regards to negative momentum divergence (an indicator that can signal a pending trend reversal), which have appeared prior to most major market tops, including 2000 and 2007.”

Newton’s forecast is similar to a prediction made by US economist Professor Robert Aliber of the University of Chicago Booth School of Business. Earlier this year, INSURGE reported exclusively on Aliber’s forecast of a 40-50 percent stock market crash (in or shortly after 2018), based on examining the dynamic of previous banking crises.

The vulnerability of both the US and Chinese economies — not to mention the string of other vulnerabilities in numerous other countries from Brexit to Turkey to Italy — demonstrates that whatever the actual trigger might be, the resulting impact is likely to have a domino effect across multiple interconnected vulnerabilities.

This could well lead to a global financial crash scenario far worse than what began in 2008.

But financial analysts have completely missed a deeper biophysical driver of China’s economic descent: energy.

Last October, INSURGE drew attention to new scientific study led by the China University of Petroleum in Beijing, which found that China is about to experience a peak in its total oil production as early as 2018.

Without finding an alternative source of “new abundant energy resources”, the study warned, the 2018 peak in China’s combined conventional and unconventional oil will undermine continuing economic growth and “challenge the sustainable development of Chinese society.”

These conclusions have been corroborated by a new paper published this February in the journal Energy, once again led by a team at the China University of Petroleum.

The study applies the measure of Energy Return On Investment (EROI), a simple but powerful ratio to calculate how much energy is being invested to extract a particular quantity of energy.

The team attempted a more refined EROI calculation, noting that standard calculations look at energy obtained at the wellhead compared to what is used to extract it; whereas a more precise measure would look at energy available at ‘point of use’ (so, after extraction from the wellhead, processing and transportation until it is actually used for something tangible in society).

Using this approach to EROI, the study finds that over a period of around three decades (between 1987 and 2012), the value of the energy extracted from China’s domestic fossil fuel base declined by more than half from 11:1 to 5:1.

This means that more and more energy is being expended to extract a decreasing amount of energy: a process that is gradually undermining the rate of economic growth.

A similar finding extends to China’s coal consumption:

“In 1987, the energy production sectors consumed 1 ton standard coal equivalent (TCE) energy inputs for every 10.01 TCE of produce net energy. However, in 2012, this number declined to 4.25.”

The study uses this data to simulate the impact on China’s GDP, and concludes that China’s declining GDP is directly related to the declining EROI or energy value of its domestic hydrocarbon resource base.

But it isn’t just China experiencing an EROI decline. This is a global phenomenon, one that was recently noted by a scientific report to the United Nations that I covered for VICE, which warned that the global economy as a whole is shifting to a new era of declining resource quality.

This doesn’t mean we are ‘running out’ of fossil fuels — but it means that as the resource quality of those fuels decline, we increase the costs on our environment and systems of production, all of which increasingly impact on the health of the global economy.

As long as mainstream economic institutions remain blind to the fundamental biophysical basis of economics, as masterfully articulated by Charles Hall and Kent Klitgaard in their seminal book, Energy and the Wealth of Nations: An Introduction to BioPhysical Economics, they will remain in the dark about the core structural reasons why the current configuration of global capitalism is so prone to recurrent crisis and collapse.

Dr. Nafeez Ahmed is the founding editor of INSURGE intelligence. Nafeez is a 17-year investigative journalist, formerly of The Guardian where he reported on the geopolitics of social, economic and environmental crises. Nafeez reports on ‘global system change’ for VICE’s Motherboard, and on regional geopolitics for Middle East Eye. He has bylines in The Independent on Sunday, The Independent, The Scotsman, Sydney Morning Herald, The Age, Foreign Policy, The Atlantic, Quartz, New York Observer, The New Statesman, Prospect, Le Monde diplomatique, among other places. He has twice won the Project Censored Award for his investigative reporting; twice been featured in the Evening Standard’s top 1,000 list of most influential Londoners; and won the Naples Prize, Italy’s most prestigious literary award created by the President of the Republic. Nafeez is also a widely-published and cited interdisciplinary academic applying complex systems analysis to ecological and political violence.


Posted in Crash Coming Soon, EROEI remaining oil too low, Peak Oil | Tagged , , , , | Comments Off on Crash alert: China’s resource crisis could be the trigger

The coming crash in 2020 from high diesel prices for cleaner emission of oceangoing ships

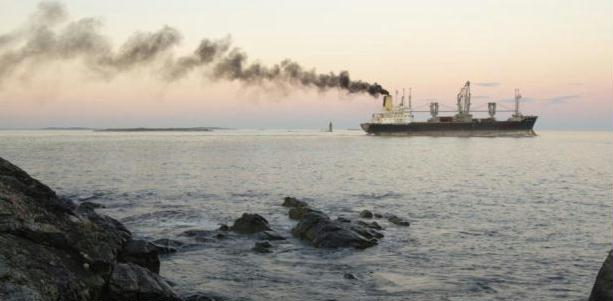
Preface.  Ships made globalization possible, and play an essential role in our high standard of living, carrying 90% of global goods traded. But the need for a new, cleaner fuel may cause the next economic crisis.  Currently ships can burn anything, shipping fuel is almost asphalt, but will be less so if cleaned up for emissions. What follows are excerpts from P. K. Verleger’s 2018 article “$200 Crude, the economic crisis of 2020, and policies to prevent catastrophe”.

Update Feb 2021: covid-19 has knocked petroleum use down so much that the jet and diesel portions of crude oil are being added to marine fuels.  These are more expensive fractions of a barrel. But blending can cause problems. Using too much kerosene can lower the temperature at which fuels catch fire, a serious risk for vessels (Loh and Koh 2020).

Here are a few summary paragraphs from this paper:

The global economy likely faces an economic crash of horrible proportions in 2020 due to a lack of  low-sulfur diesel fuel for oceangoing ships when a new International Maritime Organization rule takes place January 1, 2020. Until now, ships have burned “the dregs” of crude oil, full of sulfur and other pollutants, because it was the least expensive fuel available.

The economic collapse I predict will occur because the world’s petroleum industry lacks the capacity needed to supply additional low-sulfur fuel to the shipping industry while meeting the requirements of existing customers such as farmers, truckers, railroads, and heavy equipment operators.

Operators of simple refineries, in theory, could survive the IMO 2020 transition by changing the crude oil they process to “light sweet” crudes that can yield high volumes of low sulfur distillate, crudes such as those from Nigeria.  There is, though, a market constraint to this option. Volumes of low-sulfur crude oil are limited, and supplies are less certain because these crudes are produced primarily in Nigeria, a country that suffers frequent, politically induced market disruptions. Thus, when the inflexible refiners begin bidding for Nigerian oil, prices will rise, perhaps as much as three or four-fold.

IEA economists explained at the time that the oil price rise from 2007 to 2008 resulted in part from the frenzied bidding for limited quantities of low-sulfur crude oil, especially supplies from Nigeria. Then, as today, many refineries could not manufacture low-sulfur diesel from other crude-oil types, such as the Middle East’s light crude oils, because they lacked the needed equipment. In 2008, such refiners contentiously bid for low-sulfur crude, driving prices higher as they sought to avoid closure. This inability to process higher-sulfur crude oils created a peculiar situation. Ships loaded with such crudes were stranded on the high seas because the cargo owners could not find buyers.

At the same time, prices for light sweet crudes rose to record levels. The desperate need for low-sulfur crudes caused buyers to bid their prices higher and higher. This situation will reoccur in 2020. The global refining industry will not be able to produce the additional volumes of low-sulfur diesel and low-sulfur fuel oil required by the maritime industry. In some cases, refiners will close because they cannot find buyers for the high-sulfur fuel they had sold as ship bunkers. In others, refiners will seek lighter, low-sulfur crude oils, bidding up prices as they did in 2008. This price increase may be double the 2008 rise, however, because the magnitude of the fuel shift is greater and the refining industry is less prepared.

The crude price rise will send all product prices higher. Diesel prices will lead, but gasoline and jet fuel will follow. US consumers could pay as much as $6 per gallon for gasoline and $8 or $9 per gallon for diesel fuel.

Below are excerpts about peak diesel from this article: Antonio Turiel, Ugo Bardi. 2018. For whom is peak oil coming? If you own a diesel car, it is coming for you! Cassandra’s legacy.

Six years ago we commented on this same blog that, of all the fuels derived from oil, diesel was the one that would probably see its production decline first. The reason why diesel production was likely to recede before that of, for example, gasoline had to do with the fall in conventional crude oil production since 2005 and the increasing weight of the so-called “unconventional oils,” bad substitutes not always suitable to produce diesel.

…since 2007 (and therefore before the official start of the economic crisis) the production of fuel oils has declined.

Surely, in this shortage, we can start noting the absence of some 2.5 Mb/d of conventional oil (more versatile for refining and therefore more suitable for the production of fuel oil), as we were told by the International Energy Agency in his last annual report. This explains the urgency to get rid of the diesel that has lately shaken the chancelleries of Europe: they hide behind real environmental problems (which have always troubled diesel, but which were always given less than a hoot) to try to make a quick adaptation to a situation of scarcity. A shortage that can be brutal, since no prevention was performed for a situation that has long been seen coming.

the production of heavy gas oil has been dropping from 2007, when there was not as much regulatory interest as there seems to be now. There is one aspect of the new regulations that I think is interesting to highlight here: from 2020 onwards, all ships will have to use fuel with a lower sulfur content. Since, typically, the large freighters use very heavy fuel oils, that requirement, they say, makes one fear that a shortage of diesel will occur. In fact, from what we have discussed in this post, what seems to be happening is that heavy fuel oils are declining very fast and ships will have no choice but to switch to diesel. That this is going to cause problems of diesel shortage is more than evident. It is an imminent problem, even more than the peaks in oil prices that, according to what the IEA announces, will appear by 2025.

fracking oil only serves to make gasoline and that is why the diesel problem remains.

That is why, dear reader, when you are told that the taxes on your diesel car will be raised in a brutal way, now you know why. Because it is preferred to adjust these imbalances with a mechanism that seems to be a market (although this is actually less free and more adjusted) rather than telling the truth. The fact is that, from now on, what can be expected is a real persecution against cars with an internal combustion engine (gasoline will be next, a few years after diesel).

And more from this author in a different article:

conventional oil crude arrived to a peak in 2005 (followed by minimum attempts in 2012, 2015 and 2016confirming a plateau, note of the translator. Data from Art Berman). This is a recognized fact, even by the International Energy Agency (IEA) in its World Energy Outlook (WEO) of 2010

This conventional crude oil is still the most of the oil we consume today worldwide; more than 70%, but their production is declining: in 2005 69,5 Mb/d were being produced. Today some 67 Mb/d. That is, some 2.5 Mb/d less.

The conventional oil crude is the easiest to extract and also the most versatile; the oil that has more wide uses. Specifically, it is the most adequate to refine diesel from it.

To compensate the conventional crude oil, the good one, several oil substitutes were gradually introduced. There are the most diverse ones: biofuels, bitumen,Light Tight Oil, Liquid fuels from natural gas….all of them have two common characteristics: they are most costly to be extracted and their production is quite limited, it cannot rise much.

Besides, most of these so called “non conventional oils” are not suitable to refine or distillate diesel. That’s why we have the present problems with diesel. The more the conventional oil crude production will fall, more will the diesel production drop.

In addition, the latest EIA 2018 report says that if oil companies continue to not invest in oil exploration and production as they have been the past few years, in 20205 we are likely to be short 34 million barrels per day — about a third of all liquid fuels we consume today.

Some statistics:

By value, more than 70% of global trade makes part of its journey by ship, by volume 80%, using 4% of global oil, or 3.3 million barrels a day of the nastiest gunk at the bottom of the oil barrel.

Bunker fuel is also known as high-sulfur fuel oil because it contains up to 3,500 times as much sulfur as the diesel you put in your Volkswagen. Although sulfur’s not a greenhouse gas, it triggers acid rain, which contributes to ocean acidification, and ship exhaust intensifies thunderstorms, so shipping lanes get extra lightning. Sulfur emissions cause respiratory problems and lung disease in humans, especially those who live near ports. It’s such a problem, the IMO estimates the new sulfur-curtailing rule will prevent more than 570,000 premature deaths in the next 5 years.

Alice Friedemann   www.energyskeptic.com  author of “Life After Fossil Fuels: A Reality Check on Alternative Energy”, 2021, Springer; “When Trucks Stop Running: Energy and the Future of Transportation”, 2015, Springer, Barriers to Making Algal Biofuels, and “Crunch! Whole Grain Artisan Chips and Crackers”. Podcasts: Collapse Chronicles, Derrick Jensen, Practical Prepping, KunstlerCast 253, KunstlerCast278, Peak Prosperity , XX2 report

***


Verleger, P. K., Jr. July 2018. $200 Crude, the economic crisis of 2020, and policies to prevent catastrophe.   Pkverlegerllc.com

The proverb “For want of a nail” ends by warning that a kingdom was lost “all for want of a horseshoe nail.” The proverb dates to 1230. As Wikipedia explains, the aphorism warns of the importance of logistics, of having sufficient supplies of critical materials.  The global economy likely faces an economic crash of horrible proportions in 2020, not for want of a nail but want of low-sulfur diesel fuel. The lack of adequate supplies promises to send the price of this fuel— which is critical to the world’s agricultural, trucking, railroad, and shipping industries—to astoundingly high levels. Economic activity will slow and, in some places, grind to a halt. Food costs will climb as farmers, unable to pay for fuel, reduce plantings. Deliveries of goods and materials to factories and stores will slow or stop. Vehicle sales will plummet, especially those of gas-guzzling sport utility vehicles (SUVs). One or more major US automakers will face bankruptcy, even closure. Housing foreclosures will surge in the United States, Europe, and other parts of the world. Millions will join the ranks of the unemployed as they did in 2008. All for the want of low-sulfur diesel fuel or gasoil.   Wikipedia [https://tinyurl.com/n7sb629].

The International Maritime Organization (IMO) decreed that oceangoing ships must adopt measures to limit sulfur emissions or burn fuels containing less than 0.5 sulfur—in other words, switch to low-sulfur diesel fuel. The sulfur rule takes effect January 1, 2020.

The economic collapse I predict will occur because the world’s petroleum industry lacks the capacity needed to supply additional low-sulfur fuel to the shipping industry while meeting the requirements of existing customers such as farmers, truckers, railroads, and heavy equipment operators. These users purchase diesel fuel or gasoil, the petroleum product that accounts for the largest share of products consumed. In most countries, they must buy low-sulfur diesel fuel to reduce pollution.

Economists at the International Energy Agency, have warned that these prices must increase 20 to 30%.

While higher prices are worrisome, they should not by themselves lead to a major recession. After all, diesel fuel prices have increased more than 30% at various times this decade. However, these estimates assume that crude prices do not change.

Difficulties will arise because crude oil is not a homogeneous commodity like, for example, bottles of Jack Daniels Kentucky sour mash. Instead, crude oils vary regarding their qualities and composition, and these differences exceed those of most other goods.

Two important distinguishing factors among crude oils are how much sulfur they contain and the diesel fuel volume they produce when refined.  Some crude oils—the light sweet varieties—contain minimal sulfur and produce large amounts of low-sulfur diesel. A far greater number—the heavy sour crudes— contain a higher percentage of sulfur and do not produce diesel that meets environmental sulfur content standards without expensive additional processing.

While many world refineries can produce low-sulfur diesel fuel from heavy sour crudes, a large number have not been equipped to do this yet and thus cannot help in meeting the IMO 2020 requirements.

Much of the incremental crude that will be supplied in 2019 as world production increases will be Arab Heavy. The distillate produced from this crude contains between 1.8 and 2% sulfur.

Much of the sulfur in crude is not removed during refining but rather ends up in “fuel oil,” the “dregs” or residue left over after all the high-value products have been distilled out. It is the cheapest liquid fuel available. It is also viscous (it must be heated before use) and contains many pollutants, particularly sulfur, that are harmful to humans, animals, and plants. Since the turn of the 21st century, most fuel oil has been consumed by the shipping industry due to the environmental restrictions on other uses. It was only a matter of time before those restrictions came to marine fuel.

In order to make enough clean fuel available to vessels, very large price hikes may be required to suppress non-maritime use.

Refiners will need to “destroy” or find new markets for up to two million barrels per day of high-sulfur fuel oil. Some of it will be sold to oil-burning power plants such as those in the Middle East. These plants could and likely will shift to residual fuel oil to save money

Other volumes of high-sulfur fuel oil will be sold to refiners configured with cokers, where they will be “destroyed,” to use the oil industry’s language. Cokers split heavy fuel or heavy crude into light products and coke. ExxonMobil’s new coker at its Antwerp refinery, for example, will “turn high sulfur oils created as a byproduct of the refining process into various types of diesel, including shipping fuels that will meet new environmental laws.”4 These units will be critical in converting fuel that can no longer be burned in ships into marketable products. The rub is that cokers are very expensive (ExxonMobil’s will cost more than $1 billion) and require significant construction time.

The magnitude of the coming oil market transformation is unprecedented. This historic increase in demand for low-sulfur diesel combined with the equally historic need to dispose of unwanted fuel oil that will, absent moderating actions by nations and the IMO, cause an economic collapse in 2020.

Today, the high sulfur fuel oil price is roughly 90% of the crude price. In 2020, it could fall as low as 10% of the crude price. As a result, the price of low-sulfur distillate, which today sells for 120% of the crude price, would need to rise to perhaps 200% of the crude price to compensate the owners of refineries with limited flexibility that can produce some low-sulfur diesel along with equal or larger volumes of high sulfur fuel oil. Should prices of low-sulfur distillate fail to rise to such levels, these facilities will have to close.

Owners of simple refineries could attempt to procure a different crude feedstock. The only way for these refineries to vary their output is by changing the crude processed. Some crude oils, as mentioned, produce more low-sulfur diesel and less high-sulfur fuel oil than others. Operators of simple refineries, in theory, could survive the IMO 2020 transition by changing the crude oil they process to “light sweet” crudes that can yield high volumes of low sulfur distillate, crudes such as those from Nigeria.  There is, though, a market constraint to the third option. Volumes of low-sulfur crude oil are limited, and supplies are less certain because these crudes are produced primarily in Nigeria, a country that suffers frequent, politically induced market disruptions. Thus, when the inflexible refiners begin bidding for Nigerian oil, prices will rise, perhaps as much as three or four-fold.

Economist James Hamilton asserts strongly, for instance, that the oil price increase in 2008 would have caused a recession on its own. The price rise had already exacerbated a significant downturn in the US automobile industry. General Motors, Ford, and Chrysler had begun closing plants and laying off workers early in the year as sales of SUVs and many autos all but stopped due to lack of demand.

IEA economists explained at the time that the oil price rise from 2007 to 2008 resulted in part from the frenzied bidding for limited quantities of low-sulfur crude oil, especially supplies from Nigeria. Then, as today, many refineries could not manufacture low-sulfur diesel from other crude-oil types, such as the Middle East’s light crude oils, because they lacked the needed equipment. In 2008, such refiners contentiously bid for low-sulfur crude, driving prices higher as they sought to avoid closure. This inability to process higher-sulfur crude oils created a peculiar situation. Ships loaded with such crudes were stranded on the high seas because the cargo owners could not find buyers.

At the same time, prices for light sweet crudes rose to record levels. The desperate need for low-sulfur crudes caused buyers to bid their prices higher and higher. This situation will reoccur in 2020. The global refining industry will not be able to produce the additional volumes of low-sulfur diesel and low-sulfur fuel oil required by the maritime industry. In some cases, refiners will close because they cannot find buyers for the high-sulfur fuel they had sold as ship bunkers. In others, refiners will seek lighter, low-sulfur crude oils, bidding up prices as they did in 2008. This price increase may be double the 2008 rise, however, because the magnitude of the fuel shift is greater and the refining industry is less prepared.

The crude price rise will send all product prices higher. Diesel prices will lead, but gasoline and jet fuel will follow. US consumers could pay as much as $6 per gallon for gasoline and $8 or $9 per gallon for diesel fuel.

The high petroleum product prices will have two impacts. First, prices of everything consumed in the economy will rise. Second, high prices will force consumers to spend less on other goods and services, which will depress demand for airline travel, restaurant dinners, and new automobiles, to mention just a few. The potential impact of higher fuel prices on everything purchased across the economy is obvious. They will raise costs in the agricultural sector, leading to higher food prices. They will boost delivery costs and airline ticket prices.

Sadly, the economic losses could be much greater than any experienced in the prior five decades. The US economy will be further handicapped by the federal government’s debt. The ratio of US debt to GDP has increased from 60% in 2008 to 103% today

The increase in debt, combined with the tax cuts enacted in 2017, leaves the country with little room to address a recession. Instead, a large oil price increase could lead to an extraordinarily difficult downturn.

The government might find it impossible to fund an infrastructure program. Many states might be unable to provide income supplements to the unemployed. Emerging market nations would suffer as well. These nations would be especially exposed because they already face significant economic weakness as a strengthening dollar and rising US interest rates cause large declines in bond and equity markets in countries such as Brazil and Turkey.

If it were a country, the global shipping industry would rank as the 6th largest emitter of greenhouse gasses worldwide.

The IMO adopted a rule in 2008 that contemplated removing most sulfur from fuels used in the world’s oceangoing vessels, which number more than sixty thousand.

Oil production in Venezuela, a major player in the global oil market, collapsed. OPEC, Russia, and several other producing countries reduced output to force inventory liquidations and raise prices. To top it off, in 2018 the United States seems intent on reinstating sanctions on Iran, possibly removing a crude supply source that might be essential in cushioning price increases. These events and actions will all influence market developments in 2020 when the IMO rule becomes effective.

The amount of crude available for refining has a direct impact on the availability of diesel fuel. At the most basic level, world refiners can produce roughly 560,000 barrels of diesel from every million barrels of crude refined, according to Morgan Stanley analysts, so 1.8 million barrels per day of crude must be refined to produce one million barrels per day of diesel.

Global crude production of one hundred million barrels per day in 2020 would require an 8% increase in output from 2017. The annual rate of increase would need to be 3% per year, three times the rate of increase for the last decade. Achieving this boost will be difficult, if not impossible, should the changes in the global supply situation noted at the start of the section— Venezuela’s production decline, OPEC’s output restraint, and the reinstatement of US sanctions on Iran—remain unchanged.

The collapse of Venezuela’s oil production was not anticipated in 2016. Oil output from the country totaled around two million barrels per day when the IMO program was ratified. Two years later, output has declined to 1.5 million barrels per day. By 2020, Venezuela may be producing no crude, which would remove 1.5 million barrels per day from the global market.

Taken together, the loss of Venezuelan output, the inventory reduction engineered by OPEC, Russia, and a few other producers, and the renewed sanctions on Iran will subtract 2.5 to three million barrels per day from the market.

These estimates assume consumers in every country accept the higher prices. This assumption is questionable, however. Recently, truck drivers in Brazil brought the nation to a standstill while demanding lower diesel prices. Eventually, the Brazilian government gave in to the drivers’ demands when gasoline stations ran dry and grocery store shelves emptied. The president cut the diesel price twelve percent, reduced the road tolls paid by trucks, and offered other benefits to end the strike. Truck drivers in other countries could respond in the same way to high prices.

Believe it or not, this prediction must be viewed as optimistic even though the economic consequences of oil selling for $130 per barrel would be terrible. It is optimistic because it assumes market disruptions will be limited to a loss of Iranian crude and the collapse of Venezuelan output. It also assumes the pipeline constraints that keep US “light tight” crude oil (LTO) away from the market today will be resolved and that world refiners will be able to process the LTOs. Finally, it assumes that production in Canada, Libya, and Nigeria continues uninterrupted and that no other disruptive events occur.

US LTOs may create problems for refineries even if they get to market. These crudes are very light. Many refiners must blend other crudes with them before processing. The analysis here assumes this obstacle will be overcome.

A large oil price increase could create a catastrophe where debt cannot be serviced, and a situation such as the Asian debt crisis of 1997 could result.

Any action taken would probably occur after the economic collapse was well under way, just as the financial problems that caused the 2008 meltdown were only addressed after 2008.

These members see global warming as a serious issue and strongly favor the Paris Accords adopted in 2016. The United States withdrew from that agreement in 2017. Thus, one can envision the IMO members refusing to moderate the 2020 rule unless the United States reverses course and ratifies the Paris climate agreement. The United States has no control over the IMO and so can do nothing on its own. It is part of a very small minority there.

The Trump administration’s trade policy will further weaken the willingness of other nations to ease restrictions to help the US. The United States has followed an aggressive unilateral trade strategy since Donald Trump became president. His administration’s policies have left many frustrated and angry. The upcoming economic squeeze tied to the IMO rule provides them a way to even the score.

Economic policies being followed by the Trump administration threaten to reduce the amount of goods moving in international trade. Ironically, a trade war could decrease the amount of fuel used in international commerce, which would lessen the sulfur rule’s impact.

The IMO regulation on marine-fuel sulfur content, if left unchanged, will likely have widespread impacts on the petroleum sector. Crude oil prices could rise to $160 per barrel or higher as the rule takes effect, assuming no market disruptions. Prices could rise much higher with any disruption, even a moderate one. The higher prices will slow economic growth. If they breach $200 per barrel, they would likely lead to a recession or worse.

References

Low E, Koh A (2020) Jet Fuel Finds Once Unthinkable Home. Bloomberg.

Posted in By People, Crash Coming Soon, Peak Oil, Ships and Barges | Tagged , , , | 3 Comments

India wants to build dangerous fast breeder reactors

Preface. India was planning to build six fast breeder reactors in 2016, but now in 2018, they’ve reduced the number to 2.  This is despite the high cost, instability, danger, and accidents of the 16 previous world-wide attempts that have shut down, including the Monju fast breeder in Japan, which began decommissioning in 2018.

Breeders that produce commercial power don’t exist. There are only four small experimental prototypes operating.

Breeder reactors are much closer to being bombs than conventional reactors – the effects of an accident would be catastrophic economically and in the number of lives lost if it failed near a city (Wolfson).

Alice Friedemann   www.energyskeptic.com  author of “When Trucks Stop Running: Energy and the Future of Transportation”, 2015, Springer and “Crunch! Whole Grain Artisan Chips and Crackers”. Podcasts: Derrick Jensen, Practical Prepping, KunstlerCast 253, KunstlerCast278, Peak Prosperity , XX2 report

Ramana, M. V. 2016. A fast reactor at any cost: The perverse pursuit of breeder reactors in India. Bulletin of the Atomic Scientists.

Projections for the country’s nuclear capacity produced by India’s Department of Atomic Energy (DAE) call for constructing literally hundreds of breeder reactors by mid-century. For a variety of reasons, these projections will not materialize, making the pursuit of breeder reactors wasteful.

But first, some history. The DAE’s fascination with breeder reactors goes back to the 1950s. The founders of India’s atomic energy program, in particular physicist Homi J. Bhabha, did what most people in those roles did around that time: portray nuclear energy as the inevitable choice for providing electricity to millions of Indians and others around the world. At the first major United Nations-sponsored meeting in Geneva in 1955, for example, Bhabha argued for “the absolute necessity of finding some new sources of energy, if the light of our civilization is not to be extinguished, because we have burnt our fuel reserves. It is in this context that we turn to atomic energy for a solution… For the full industrialization of the under-developed countries, for the continuation of our civilization and its further development, atomic energy is not merely an aid; it is an absolute necessity.” Consequently, Bhabha proposed that India expand its production of atomic energy rapidly.

There was a problem though. India had a relatively small amount of good quality uranium ore that could be mined economically. But it was known that the country did have large reserves of thorium, a radioactive element that was considered a “great potential source of energy.” But despite all the praises one often hears about it, thorium has a major shortcoming: It cannot be used to fuel a nuclear reactor directly but has to first be converted into the chain-reacting element uranium-233, through a series of nuclear reactions. To produce uranium-233 in large quantities, Bhabha proposed a three-step plan that involved starting with the more readily available uranium ore. The first stage of this three-phase strategy involves the use of uranium fuel in heavy water reactors, followed by reprocessing the irradiated spent fuel to extract the plutonium. In the second stage, the plutonium is used to provide the startup cores of fast breeder reactors, and these cores would then be surrounded by “blankets” of either depleted or natural uranium to produce more plutonium. If the blanket were thorium, it would produce chain-reacting uranium-233. Finally, the third stage would involve breeder reactors using uranium-233 in their cores and thorium in their blankets. Breeder reactors, therefore, formed the basis of two of the three stages.

Bhabha was hardly alone in thinking of breeders. The first breeder reactor concept was developed by Leό Szilárd in 1943, who was responding to concerns, shared by colleagues who were engaged in developing the first nuclear bomb, that uranium would be scarce. The idea of a phased program involving uranium and thorium had also been proposed in October 1954 by François Perrin, the head of the French Atomic Energy Commission, who argued that France will “have to use for power production both primary reactors [using natural or slightly enriched uranium] and secondary breeder reactors [fast neutron plutonium reactors] … in the slightly more distant future … this second type of reactor … may be replaced by slow neutron breeders using thorium and uranium-233. We have considered this last possibility very seriously since the discovery of large deposits of thorium ores in Madagascar.” (At that time, Madagascar was a French colony, achieving independence only in 1960.)

That was then. In the more than 60 years that have passed since the adoption of the three-phase plan, we have learned a lot about breeder reactors. Three of the important lessons are that fast breeder reactors are costly to build and operate; they have special safety problems; and they have severe reliability problems, including persistent sodium leaks.

These problems were observed in countries around the world, and have not been solved despite spending over $100 billion (in 2007 dollars) on breeder reactor research and development, and on constructing prototypes.

India’s own experience with breeders so far consists of one, small, pilot-scale fast breeder reactor, whose operating history has been patchy. The budget for the Fast Breeder Test Reactor (FBTR) was approved by the Department of Atomic Energy in 1971, with an anticipated commissioning date of 1976. But it was October 1985 before the reactor finally attained criticality, and a further eight years (i.e., 1993) elapsed before its steam generator began operating. The final cost was more than triple the initial cost estimate. But the reactor’s troubles were just beginning.

The FBTR’s operations have been marred by several accidents of varying intensity. Dealing with even relatively minor accidents has been complicated, and the associated delays have been long. As of 2013, the FBTR had operated for only 49,000 hours in 26 years, or barely 21 percent of the maximum possible operating time. Although the FBTR was originally designed to generate 13.2 megawatts of electricity, the most it has achieved is 4.2 megawatts. But rather than realizing that the FBTR’s performance was typical of breeders elsewhere and learning the appropriate lesson—that they are unreliable and susceptible to shutdowns—the DAE terms this history as demonstrating a “successful operation of FBTR” and describes the “development of Fast Breeder Reactor technology” as “one of the many salient successes” of the Indian nuclear power program.

Even before the Fast Breeder Test Reactor had been constructed, India’s Department of Atomic Energy embarked on designing a much larger reactor, the previously mentioned Prototype Fast Breeder Reactor, or PFBR. Designed to generate 500 megawatts of electricity, the PFBR would be nearly 120 times larger than its testbed cousin, the FBTR. The difficulties of such scaling-up are apparent when one considers the French experience in building the 1,240 megawatt Superphenix breeder reactor; that reactor was designed on the basis of experience with both a test and a 250-megawatt demonstration reactor and still proved a complete failure. Nonetheless, the DAE pressed on.

Full steam ahead. Work on designing the PFBR started in 1981, and nearly a decade later, the trade journal Nucleonics Week reported that the Indian government had “recently approved the reactor’s preliminary design and … awarded construction permits” and that the reactor would be on line by the year 2000.

That was not to be. After multiple delays, construction of the PFBR finally started in 2004; then, the reactor was projected to become critical in 2010. The following year, the director announced that the project “will be completed 18 months ahead of schedule.”

The saga since then has involved a series of delays, followed by promises of imminent project completion. The current promise is for a 2017 commissioning date. Regardless of whether that happens, the PFBR has already taken more than twice as long to construct as initially projected. Alongside the lengthy delay comes a cost increase of nearly 63 percent—so far.

Even at the original cost estimate, and assuming high prices for uranium ($200 per kilogram) and heavy water (around $600 per kilogram), my former colleague J. Y. Suchitra, an economist, and I showed several years ago that electricity from the PFBR will be about 80 percent more expensive in comparison with electricity from nuclear power plants based on the heavy water that the DAE itself is building. These assumptions were intended to make the PFBR look economically more attractive than it really will be. A lower uranium price will make electricity from heavy water reactors cheaper. On the global market, current spot prices of uranium are around $50 per kilogram and declining; they have not exceeded $100 per kilogram for many years. Likewise, the heavy water cost assumed was quite high; the United States recently purchased heavy water from Iran at a cost of $269 per kilogram instead of the $600 per kilogram assumed figure.

The calculation also assumed that breeder reactors operate extremely reliably, with a load factor of 80%. (Load factors are the ratio of the actual amount of electrical energy generated by a reactor to what it should have produced if it had operated at its design level continuously.) No breeder reactor has achieved an 80% load factor; by comparison, in the real world the UK’s Prototype Fast Reactor and France’s Phenix had load factors of 26.9% and 40.5% respectively.

Consequently, even with very optimistic assumptions about the cost and performance of India’s Prototype Fast Breeder Reactor, and the deliberate choice of high costs for the inputs used in heavy water reactors, the PFBR cannot compete with nuclear electricity from the others kinds of reactors that India’s Department of Atomic Energy builds. With more realistic values and after accounting for the significant construction cost escalation, electricity from the Prototype Fast Breeder Reactor could be 200 percent more expensive than that from heavy water reactors.

But such arguments don’t resonate with DAE officials. As one unnamed official told sociologist Catherine Mei Ling Wong, “India has no option … we have very modest resources of uranium. Suppose tomorrow, the import of uranium is banned … then you will have to live with this modest uranium. So … you have to have a fast reactor at any cost. There, economics is of secondary importance.” This argument is misleading because India’s uranium resource base is not a single fixed number. The resource base increases with continued exploration for new deposits, as well as technological improvements in uranium extraction. In addition, as with any other mineral, at higher prices it becomes economic to mine lower quality and less accessible ores. In other words, if the price offered for uranium is higher, the amount of uranium available will be larger, at least for the foreseeable future.

One must keep these factors in mind when making economic comparisons between breeder reactors and heavy water reactors. Even for the earlier set of assumptions, without the dramatic cost increase of the PFBR factored in, breeders become competitive only when uranium prices exceeded $1,375 per kilogram—a truly astronomical figure, given the current spot price of $50 per kilogram. Significantly larger quantities of uranium will become available at such a price. In other words, the pursuit of breeder reactors will not be economically justified even when uranium becomes really, really scarce—which is not going to happen for decades, perhaps even centuries, given that nuclear power globally is not growing all that much.

The DAE, of course, claims that future breeder reactors will be cheaper. But that decline in costs will likely come with a greater risk of severe accidents. This is because the PFBR, and other breeder reactors, are susceptible to a special kind of accident called a core disassembly accident. In these reactors, the core where the nuclear reactions take place is not in its most reactive—or energy producing—configuration. An accident involving the fuel moving around within the core, (when some of it melts, for example) could lead to more energy production, which leads to more core melting, and so on, potentially leading to a large, explosive energy release that might rupture the reactor vessel and disperse radioactive material into the environment. The PFBR, in particular, has not been designed with a containment structure that is capable of withstanding such an accident. Making breeder reactors cheaper could well increase the likelihood and impact of such core disassembly accidents.

What of the DAE’s projections of large numbers of breeder reactors to be constructed by mid-century? It turns out that the methodology used by the DAE in its projections suffers from a fundamental error, and the DAE’s calculations have not accounted properly for the future availability of plutonium that will be necessary to construct the many, many breeder reactors the DAE proposes to build. What the DAE has omitted in its calculations is the lag period between the time a certain amount of plutonium is committed to a breeder reactor and when it reappears (along with additional plutonium) for refueling the same reactor, thus contributing to the start-up fuel for a new breeder reactor. A careful calculation that takes into account the constraints flowing from plutonium availability leads to drastically lower projections. The projections could be even lower if one takes into account the potential delays because of infrastructural and manufacturing problems. The bottom line: Even if all was going well, the breeder reactor strategy will simply not fulfill the DAE’s hopes of supplying a significant fraction of India’s electricity.

Ulterior motives? For all the praises it sings of breeder reactors, there is one reason for its attraction to the PFBR that the DAE does not talk much about, except indirectly. Consider this interview by the Indian Express, a national newspaper, with Anil Kakodkar, then-secretary of the DAE, about the US-India nuclear deal: “Both from the point of view of maintaining long-term energy security and for maintaining the minimum credible deterrent, the fast breeder programme just cannot be put on the civilian list. This would amount to getting shackled and India certainly cannot compromise one [security] for the other.” (There is some code language here. “Minimum credible deterrent” is a euphemism for India’s nuclear weapons arsenal. “Put on the civilian list” means that the International Atomic Energy Agency will not safeguard the reactor, and so it is possible for fissile materials from the reactor to be diverted to making nuclear weapons.)

What this points to is the possibility that breeder reactors like the PFBR can be used as a way to quietly increase the Department of Atomic Energy’s weapons-grade plutonium production capacity several-fold. But as mentioned earlier, this is not a reason that the DAE likes to publicly admit. Nevertheless, the significance of keeping the PFBR outside of safeguards has not been lost, especially on Pakistan.

Breeder reactors have always underpinned the DAE’s claims about generating large quantities of electricity. That promise has been an important source of its political power. For this reason, India’s DAE is unlikely to abandon its commitment to breeder reactors. But given the troubled history of breeder reactors, both in India and elsewhere, the more appropriate strategy to follow would be to simply abandon the three-phase strategy. The DAE’s reliance on a technology shown to be unreliable suggests that the organization is incapable of learning the appropriate lessons from its past and makes it more likely that nuclear power will never become a major source of electricity in India.

References

NP. 2018. India slashes plans for new nuclear reactors by two-thirds. Neutronbytes.com

Wolfson, R. 1993. Nuclear Choices: A Citizen's Guide to Nuclear Technology. MIT Press

Posted in Nuclear Power Energy | Tagged , , , , | Comments Off on India wants to build dangerous fast breeder reactors

Germany’s wind energy mess: As subsidies expire, thousands Of turbines to close

Preface. This means that the talk about renewables being so much cheaper than anything else isn’t necessarily true.  If wind were profitable, more turbines would be built to replace the old ones  without subsidies needed. Unless they can be dumped in the 3rd world, they’ll be modern civilizations Easter Head icons.

Summary: A large number of Germany’s 29,000 turbines are approaching 20-years-old and for the most part, they are outdated [my note: 20 years is the lifespan of wind turbines]. The generous subsidies granted at the time of their installation are slated to expire soon and thus make them unprofitable. By 2020, 5,700 turbines with an installed capacity of 45 GW will see their subsidies run out. And after 2020, thousands of these turbines will lose their subsidies with each passing year, which means they will be taken offline and mothballed. So with new turbines coming online only slowly, it’s entirely possible that wind energy output in Germany will decline in the coming years.

It’s impossible to recycle composite materials because the large blades are made of fiberglass composite materials whose components cannot be separated from each other. Burning the blades is extremely difficult, toxic, and energy-intensive. So naturally, there’s a huge incentive for German wind park operators to dump the old contraptions onto third-world countries, and to let them deal later with the garbage.

Alice Friedemann   www.energyskeptic.com  author of “When Trucks Stop Running: Energy and the Future of Transportation”, 2015, Springer and “Crunch! Whole Grain Artisan Chips and Crackers”. Podcasts: Practical Prepping, KunstlerCast 253, KunstlerCast278, Peak Prosperity , XX2 report

***

April 23, 2018. Germany’s wind energy mess: As subsidies expire, thousands of turbines to close. Climate Change Dispatch.

As older turbines see subsidies expire, thousands are expected to be taken offline due to lack of profitability.

Green nightmare: Wind park operators eye shipping thousands of tons of wind turbine litter to third world countries – and leaving their concrete rubbish in the ground.

The Swiss national daily Baseler Zeitung here recently reported how Germany’s wind industry is facing a potential “abandonment”.

Approvals tougher to get

This is yet another blow to Germany’s Energiewende (transition to green energies). A few days ago, I reported here how the German solar industry had seen a monumental jobs’ bloodbath and investments have been slashed to a tiny fraction of what they once were.

Over the years, Germany has made approvals for new wind parks more difficult as the country reels from an unstable power grid and growing protests against the blighted landscapes and health hazards.

Now that the wind energy boom has ended, the Baseler Zeitung reports that “the shutdown of numerous wind turbines could soon lead to a drop in production” after having seen years of ruddy growth.

Subsidies for old turbines run out

Today a large number of Germany’s 29,000 total turbines nationwide are approaching 20-years-old and for the most part, they are outdated.

Worse: the generous subsidies granted at the time of their installation are slated to expire soon and thus make them unprofitable.

After 2020, thousands of these turbines will lose their subsidies with each passing year, which means they will be taken offline and mothballed.

The Baseler Zeitung writes:

The Baseler Zeitung adds that some 5,700 plants with an installed capacity of 45 GW will see their subsidies run out by 2020.  In the following years, it will be between 2000 and 3000 GW, for which the state subsidization is eliminated. The German Wind Energy Association estimates that by 2023 around 14,000 MW of installed capacity will lose production, which is more than a quarter of German wind power capacity on land.  According to the German Wind Energy Association, installed capacity per megawatt is expected to cost 30,000 euros.

The Swiss daily reports further:  So with new turbines coming online only slowly, it’s entirely possible that wind energy output in Germany will recede in the coming years, thus making the country appear even less serious about climate protection.

Wind turbine dump in Africa?

So what happens to the old turbines that will get taken offline?

Wind park owners hope to send their scrapped wind turbine clunkers to third-world buyers, Africa for example. But if these buyers instead opt for new energy systems, then German wind park operators will be forced to dismantle and recycle them – a costly endeavor, reports the Baseler Zeitung.

Impossible to recycle composite materials

The problem here is the large blades, which are made of fiberglass composite materials and whose components cannot be separated from each other.  Burning the blades is extremely difficult, toxic, and energy-intensive.

So naturally, there’s a huge incentive for German wind park operators to dump the old contraptions onto third-world countries, and to let them deal later with the garbage.

Sweeping garbage under the rug

Next, the Baseler Zeitung brings up the disposal of the massive 3,000-tonne reinforced concrete turbine base, which according to German law must be removed. The complete removal of the concrete base can quickly cost hundreds of thousands of euros.

Some of these concrete bases reach depths of 20 meters and penetrate multiple ground layers, the Baseler Zeitung reports, adding:

Already wind park operators are circumventing this huge expense by only removing the top two meters of the concrete and steel base, and then hiding the rest with a layer of soil, the Baseler writes.

In the end, most of the concrete base will remain as garbage buried in the ground, and the above-ground turbine litter will likely get shipped to third-world countries.

That’s Germany’s Energiewende and contribution to protecting the environment and climate!

Posted in Electric Grid & EMP Electromagnetic Pulse, Energy Infrastructure, Wind | Tagged , , , , | 8 Comments

Book review of Vaclav Smil’s “Energy Transitions: History, Requirements, Prospects”

Preface.  In my extract of the 178 pages in the book below, Smil explains why renewables can’t possibly replace fossil fuels, and appears to be exasperated that people believe this can be done when he writes “Common expectations of energy futures, shared not only by poorly informed enthusiasts and careless politicians but, inexplicably, by too many uncritical professionals, have been, for decades, resembling more science fiction than unbiased engineering, economic, and environmental appraisals.”

Yet Smil makes the same “leap of faith” as the “uncritical professionals” he criticizes.  He remains “hopeful in the long run because we can’t predict the future.” And because the past transitions “created more productive and richer economies and improved the overall quality of life—and this experience should be eventually replicated by the coming energy transition.”

Huh? After all the trouble he’s taken to explain why we can’t possibly transition from fossil fuels to anything else he ends on a note of happy optimism with no possible solution?

Alice Friedemann  www.energyskeptic.com  Author of Life After Fossil Fuels: A Reality Check on Alternative Energy; When Trucks Stop Running: Energy and the Future of Transportation”, Barriers to Making Algal Biofuels, & “Crunch! Whole Grain Artisan Chips and Crackers”.  Women in ecology  Podcasts: WGBH, Financial Sense, UCSC, Jore, Planet: Critical, Crazy Town, Collapse Chronicles, Derrick Jensen, Practical Prepping, Kunstler 253 &278, Peak Prosperity,  Index of best energyskeptic posts

***

Smil, Vaclav. 2010. Energy Transitions: History, Requirements, Prospects.  Praeger.

Agriculture

Modern agriculture consumes directly only a few percent of the total energy supply as fuels and electricity to operate field machinery (tractors, combines, irrigation pumps) and mostly as electricity for heating, cooling, and machinery used in large-scale animal husbandry. But the indirect energy cost of agricultural production (to produce agricultural machinery, and to synthesize energy- intensive fertilizers, pesticides, and herbicides) and, even more so, energy costs of modern industrial food processing (including excessive packaging), food storage (the category dominated by refrigeration), retailing, cooking, and waste management raise the aggregate cost of the entire food production/distribution/preparation/disposal system to around 15% of total energy supply.

10% of all extracted oil and slightly more than 5% of all natural gas are used as chemical feedstocks, above all for syntheses of ammonia and various plastics.

Biomass

Photosynthesis uses only a small part of available wavelengths (principally blue and red light amounting to less than half of the energy in the incoming spectrum) and its overall conversion efficiency is no more than 0.3% when measured on the planetary scale and only about 1.5% for the most productive terrestrial (forest) ecosystems.

Large-scale biofuel cultivation and repeated removal of excessive shares of photosynthetic production could further undermine the health of many natural ecosystems and agro-ecosystems by extending monocultures and opening ways for greater soil erosion and pest infestation.

Terrestrial photosynthesis proceeds at a rate of nearly 60 TW, and even a tripling of biomass currently used for energy would not yield more than about 9 TW.

All preindustrial societies had a rather simple and persistent pattern of primary fuel use as they derived all of their limited heat requirements from burning biomass fuels. Fuelwood (firewood) was the dominant source of primary energy, but woody phytomass would be a better term: the earliest users did not have any requisite saws and axes to cut and split tree trunks, and those tools remained beyond the reach of the poorest peasants even during the early modern era. Any woody phytomass was used, including branches fallen to the ground or broken off small trees, twigs, and small shrubs. In large parts of the sub-Saharan Africa and in many regions of Asia and Latin America this woody phytomass, collected mostly by women and children, continues to be the only accessible and affordable form of fuel for cooking and water and house heating for the poorest rural families. Moreover, in some environments large shares of all woody matter were always gathered by families outside forests from small tree clumps and bushes, from the litter fall under plantation tree crops (rubber, coconut) or from roadside, backyard, or living fence trees and shrubs. This reliance on non-forest phytomass also continues today in many tropical and subtropical countries: Rural surveys conducted during the late 1990s in Bangladesh, Pakistan, and Sri Lanka found that this non-forest fuelwood accounted for more than 80% of all wood by households (RWEDP, 1997). And in less hospitable, arid or deforested, environments, children and women collected any available non-woody cellulosic phytomass, fallen leaves (commonly raked in North China’s groves, leaving the ground barren), dry grasses, and plant roots. For hundreds of millions of people the grand energy transition traced in this chapter is yet to unfold: They continue to live in the wooden era, perpetuating the fuel usage that began in prehistory.

Another usage that has been around for millennia is the burning of crop residues (mostly cereal and leguminous straws, but also corn or cotton stalks and even some plant roots) and sundry food- processing wastes (ranging from almond shells to date kernels) in many desert, deforested, or heavily cultivated regions. And on the lowest rung of the reliance on biomass fuels was (and is) dry dung, gathered by those with no access to other fuels (be it the westward-moving settlers of the United States during the nineteenth century collecting buffalo dung or the poorest segments of rural population in today’s India) or whose environment (grasslands or high mountain regions) provides no suitable phytomass to collect (Tibetan and Andean plateaus and subtropical deserts of the Old World where, respectively, yak, llama, and camel dung can be collected).

Even if all of the world’s sugar cane crop were converted to ethanol, the annual ethanol yield would be less than 5% of the global gasoline demand in 2010. Even if the entire U.S. corn harvest was converted to ethanol, it would produce an equivalent of less than 15% of the country’s recent annual gasoline consumption. Biofuel enthusiasts envisage biorefineries using plant feedstocks that replace current crude oil refineries-but they forget that unlike the highly energy-dense oil that is produced with high power density, biomass is bulky, tricky to handle, and contains a fairly high share of water.

This makes its transport to a centralized processing facility uneconomical (and too energy intensive) beyond a restricted radius (maximum of about 50 miles / 80 km) and, in turn, this supply constraint limits the throughput of a biorefinery and the range of fuels to be produced-to say nothing about the yet-to-be- traversed path from laboratory benches to mass-scale production (Willems, 2009). A thoughtful review of biofuel prospects summed it up well: They can be an ingredient of the future energy supply but “realistic assessments of the production challenges and costs ahead impose major limits” (Sinclair, 2009, p. 407).

And finally, the proponents of massive biomass harvesting ignore a worrisome fact that modern civilization is already claiming (directly and indirectly) a very high share of the Earth’s net terrestrial primary productivity (NPP), the total of new phytomass that is photosynthesized in the course of a single year and that is dominated by the production of woody tissues (boles, branches, bark, roots) in tropical and temperate forests. Most of this photosynthate should be always left untouched in order to support all other nonhuman heterotrophs (from archaea and bacteria to primates) and to perform, directly or indirectly via the heterotrophs.

Biomass performs numerous indispensable environmental services. Given this fact it is astonishing, and obviously worrisome, that three independently conducted studies (Vitousek et al., 1986; Rojstaczer, Sterling, & Moore, 2001; Imhoff et al., 2004) agree that human actions are already appropriating perhaps as much as 40% of the Earth’s NPP as cultivated food, fiber, and feed, as the harvests of wood for pulp, timber, and fuel, as grass grazed by domesticated animals, and as fires deliberately set to maintain grassy habitats or to convert forests to other uses. This appropriation is also very unevenly distributed, with minuscule rates in some thinly populated areas of tropical rain forests to shares in excess of 60% in East Asia and to more than 70% in Western Europe (Imhoff et al., 2004). Local rates are even higher in the world’s most intensively cultivated agroecosystems of the most densely populated regions of Asia (China’s Jiangsu, Sichuan, and Guangdong, Indonesia’s Java, Bangladesh, the Nile Delta).

Any shift toward large-scale cultivation/harvesting of phytomass would push the global share of human NPP appropriation above 50% and would make many regional appropriation totals intolerably high. There is an utter disconnect between the proponents of transition to mass-scale biomass use and the ecologists whose Millennium Ecosystem Assessment (2005) demonstrated that essential ecosystemic services that underpin the functioning of all economies have been already modified, reduced, and compromised to a worrisome degree. Would any of numerous environmental services provided by diverse ecosystems-ranging from protection against soil erosion to perpetuation of biodiversity-be enhanced by extensive cultivation of high-yielding monocultures for energy? I feel strongly that the recent proposals of massive biomass energy schemes are among the most regrettable examples of wishful thinking and ignorance of ecosystemic realities and necessities.

Phytomass would have a chance to become, once again, a major component of the global primary energy supply only if we were to design new photosynthetic pathways that did not emerge during hundreds of millions of years of autotrophic evolution or if we were able to produce fuels directly by genetically manipulated bacteria. The latter option is now under active investigation, with Exxon being its most important corporate sponsor and Venter’s Synthetic Genomics its leading scientific developer (Service, 2009). Overconfident gene manipulators may boast of soon-to-come feats of algally produced gasoline, but how soon would any promising yields achieved in controlled laboratory conditions be transferable to mass-scale cultivation?

Even if we assume (quite optimistically) that the cultivation of phytomass for energy could average 1 W/m2, then supplanting today’s 12.5 TW of fossil fuels would require 12,500,000 km2, roughly an equivalent of the entire territories of the United States and India, an area more than 400 times larger than the space taken up by all of modern energy’s infrastructures.

Muscle Power

Basal metabolic rate (BMR) of all large mammals is a nonlinear function of their body mass M When expressed in watts it equals 3.4Mo-75 (Smil, 2008). This yields 70-90 W for most adult males and 55-75 W for females. Energy costs of physical exertion are expressed as multiples of the BMR: Light work requires up to 2.5 BMR, moderate tasks up to 5 BMR, and heavy exertions need as much as 7 BMR or in excess of 300 W for women and 500 W for men. Healthy adults can work at those rates for hours, and given the typical efficiency of converting the chemical energy into the mechanical energy of muscles (15-20%) this implies at most between 60 W (for a 50-kg female) and about 100 W (for an 85-kg man) of useful work, and equivalents of five to seven steadily working adults performing as much useful labor as one draft ox and about six to eight men equaling the useful exertion of a good, well-harnessed horse.

With the domestication of draft animals humans acquired more powerful prime movers, but because of the limits imposed by their body sizes and commonly inadequate feeding the working bovines, equids, and camelids were used to perform only mostly the most demanding tasks (plowing, harrowing, pulling heavy cart- or wagon-loads or pulling out stumps, lifting water from deep wells) and most of the labor in traditional societies still needed human exertion.

Working bovines (many cattle breeds and water buffaloes) weigh from just 250 kg to more than 500 kg. With the exception of donkeys and ponies, working equines are more powerful: Larger mules and horses can deliver 500-800 W compared to 250-500 W for oxen. Some desert societies also used draft camels, elephants performed hard forest work in the tropics, and yaks, reindeer, and llamas were important pack animals. At the bottom of the scale were harnessed dogs and goats. Comparison of plowing productivities conveys the relative power of animate prime movers. Even in the light soil it would take a steadily working peasant about 100 hours of hoeing to prepare a hectare of land for planting; in heavier soils it could be easily 150 hours. In contrast, a plowman guiding a medium-sized ox harnessed inefficiently by a simple wooden yoke and pulling a primitive wooden plow would do that work in less than 40 hours; a pair of good horses with collar harness and a steel plough would manage in just three hours.

No draft animal could make good progress on soft muddy or sandy roads, even less so when pulling heavy carts with massive wooden (initially full disk; spokes came around 2000 BCE in Egypt) wheels. When expressed in terms of daily mass-distance (t-km), a man pushing a wheelbarrow rated just around 0.5 t-km (less than 50-kg load transported 10-15 km), a pair of small oxen could reach 4-5 t-km (10 times te load at a similarly slow speed), and a pair of well-fed and well-harnessed nineteenth-century horses on a hard-top road could surpass 25 t-km.

My approximate calculations indicate that by 1850 draft animals supplied roughly half of all useful work, human labor provided as much as 40%, and inanimate prime movers delivered between 10% and 15%. By 1900 inanimate prime movers (dominated by steam engines, with water turbines in the second place) contributed 45%-50%, animal labor provided about a third, and human labor no more than a fifth of the total. By 1950 human labor, although in absolute terms more important than ever, was a marginal contributor (maximum of about 5%), animal work was down to about 10%, and inanimate prime movers (dominated by internal combustion engines and steam and water turbines) contributed at least 85%, and very likely 90%, of all useful work.

Wind

The power of water wheels rose from 102 W to larger wheels of 103 W after 1700 to as much as a few hundred kW (105  W) by 1850.  Windmills showed up a thousand years later and culminated in machines capable of no more than 104 W by the late 19th century.  Although water wheel power rose 1000-fold over 2,000 years, steam engine power grew exponentially in less than 50 years from 105  W to 1 MW (10 W) by 1900.  Steam turbines rose 6 orders of magnitude, a million-fold jump in less than 300 years.

Wind turbines are now seen as great harbingers of renewability, about to sever our dependence on fossil fuels. But their steel towers are made from the metal smelted with coal-derived coke or from recycled steel made in arc furnaces, and both processes are energized by electricity generated largely by turbo-generators powered by coal and natural gas combustion. And their giant blades are made from plastics synthesized from hydrocarbon feedstocks that are derived from crude oil whose extraction remains unthinkable without powerful diesel, or diesel-electric, engines.

The total power of winds generated by this differential heating is a meaningless aggregate when assessing resources that could be harnessed for commercial consumption because the Earth’s most powerful winds are in the jet stream at altitude around 11 km above the surface, and in the northern hemisphere their location shifts with seasons between 30° and 70° N. Even at altitudes reached by the hubs of modern large wind turbines (70-100 m above ground) only less than 15% of winds have speeds suitable for large-scale commercial electricity generation. Moreover, their distribution is uneven, with the Atlantic Europe and the Great Plains of North America being the premiere wind-power regions and with large parts of Europe, Asia, and Africa having relatively unfavorable conditions.

Harnessing significant shares of wind energy could affect regional climates and conceivably even the global air circulation. 

The power density of a 3-MW Vestas machine (now a common choice for large wind farms) is roughly 400 W/m2 and for the world’s largest machine, ENERCON E- 126 rated at 6 MW, it is 481 W/m2.

But because the turbines must be spaced at least three, and better yet five, rotor diameters apart in direction perpendicular to the prevailing wind and at least five, and with large installations up to ten, rotor diameters in the wind direction (in order to avoid excessive wake interference and allow for sufficient wind energy replenishment), power densities of wind generation are usually less than 10 W/m2. Altamont Pass wind farm averages 3.5 W/m2, while exceptionally windy sites may yield more than 10 W/m2 and less windy farms with greater spacing may rate just above 1 W/m2 (Figure 4.1).

Commercialization of large wind turbines has shown notable capacity advances and engendered high expectation. In 1986 California’s Altamont Pass, the first large-scale modern wind farm, whose construction began in the 1981, had average turbine capacity of 94 kW and the largest units rated 330 kW (Smith, 1987). Nearly 20 years later the world’s largest turbine rated 6 MW and typical new installations were 1 MW. This means that the modal capacities of wind turbines have been doubling every 5.5 years (they grew roughly 10-fold in two decades) and that the largest capacities have doubled every 4.4 years (they increased by a factor of 18 in two decades). Even so, these highest unit capacities are two orders of magnitude smaller than the average capacities of steam turbo-generators, the best conversion efficiencies of wind turbines have remained largely unchanged since the late 1980s (at around 35%), and neither they nor the maximum capacities will see several consecutive doublings during the next 10-20 years. The EU’s Up Wind research project has been considering designs of turbines with capacities between 10 and 20 MW whose rotor diameters would be 160-252 m, the latter dimension being twice the diameter of a 5-MW machine and more than three times the wing span of the jumbo A380 jetliner (UpWind, 2009; Figure 4.4).

Hendriks (2008) argues that building such structures is technically possible, because the Eiffel tower had surpassed 300 m already in 1889 and because we routinely build supertankers and giant container vessels whose length approaches 400 m, and assemble bridges whose individual elements have mass more than 5,000 t. That this comparison is guilty of a categorical mistake (as none of those structures is surmounted by massive moving rotors) is not actually so important: What matters are the economies of such giant turbines and, as Bulder (2009) concluded, those are not at all obvious. This is mainly because the weight stresses are proportional to the turbine radius (making longer blades more susceptible to buckling) and because the turbine’s energy yield goes up with the square of its radius while the mass (i.e., the turbine’s cost) goes up with the cube of the radius.

But even if we were to see a 20-MW machine as early as 2020 this would amount to just a tripling of the maximum capacities in a decade, hardly an unprecedented achievement: For example, average capacities of new steam turbo-generators installed in U.S. thermal stations rose from 175 MW in 1960 to 575 MW in 1970, more than a threefold gain. And it is obvious that no wind turbine can be nearly 100% efficient (as natural gas furnace or large electric motors now routinely are), as that would virtually stop the wind flow, and a truly massive deployment of such super-efficient turbines would drastically change local and regional climate by altering the normal wind patterns. The maximum share of wind’s kinetic energy that can be converted into rotary motion occurs when the ratio of wind speed after the passage through the rotor plane and the wind speed impacting the turbine is 1/3 and it amounts to 16/27 or 59% of the wind’s total kinetic energy (Betz, 1926). Consequently, it will be impossible even to double today’s prevailing wind turbine efficiencies in the future.

Hydropower

Storing too much water for hydro generation could weaken many environmental services provided by flowing river water (including silt and nutrient transportation, channel cutting, and oxygen supply to aquatic biota).

The total potential energy of the Earth’s runoff (nearly 370 EJ, or roughly 80% of the global commercial energy use in 2010) is just a grand sum of theoretical interest:  Most of that power can be never tapped for generating hydroelectricity because of the limited number of sites suitable for large dams, seasonal fluctuations of water flows, and the necessity to leave free-flowing sections of streams and to store water for drinking, irrigation, fisheries, flood control, and recreation uses.

As a result, the aggregate of technically exploitable capacity is only about 15% of the theoretical power of river runoff (WEC, 2007), and the capacity that could be eventually economically exploited is obviously even lower.

I have calculated the maximum conceivable share of water power during the late Roman Empire by assuming high numbers of working water wheels (about 25,000 mills), very high average power per machine (1.5 kW), and a high load factor of 50% (Smil, 2010a). These assumptions result in some 300 TJ of useful work while the labor of some 25 million adults (at 60 W for 300 eight-hour days) and 6 million animals (at just 300 W/head for 200 eight-hour days) added up to 30 PJ a year, or at least 100 times as much useful energy per year as the work done by water wheels. Consequently, even with very liberal assumptions water power in the late Roman Empire supplied no more than 1% of all useful energy provided by animate exertion-and the real share was most likely just a fraction of 1%.

Hydrokinetic power

  • Wind-driven ocean waves have kinetic energy of some 60 TW of which only 3 TW (5%) are dissipated along the coasts.
  • Tidal energy amounts to about 3 TW, of which only some 60 GW are dissipated in coastal waters.

Geothermal ultimate maximum globally is 600 GW

The Earth’s geothermal flux amounts to about 42 TW, but nearly 80% of that large total is through the ocean floor and all but a small fraction of it is a low-temperature diffuse heat. Available production techniques using hot steam could tap up to about 140 GW for electricity generation by the year 2050 (Bertani, 2009), and even if three times as much could be used for low- temperature heating the total would be less than 600 GW.

Better efficiencies

What has changed, particularly rapidly during the past 150 years, are the typical efficiencies of the process. In open fires less than 5% of wood’s energy ended up as useful heat that cooked the food; simple household stoves with proper chimneys (a surprisingly late innovation) raised the performance to 15-20%, while today’s most efficient household furnaces used for space heating convert 94-97% of energy in natural gas to heat.

The earliest commercial steam engines (Newcomen’s machines at the beginning of the eighteenth century) transferred less than 1% of coal’s energy into useful reciprocating motion-while the best compound steam engines of the late nineteenth century had efficiencies on the order of 20% and steam locomotives never surpassed 10%. Even today’s best-performing gasoline-fueled engines do not usually surpass 25% efficiency in routine operation.

The world’s largest marine diesel engines are now the only internal combustion machines whose efficiency can reach, and even slightly surpass, 50%.

Gasoline engines

Today’s automotive engines have power ranging from only about 50 kW for urban mini cars to about 375 kW for the Hummer, their compression ratios are typically between 9:1 and 12:1 and their mass/power ratios mostly between .8 and 1.2 g/W.  But even the most powerful gasoline-fueled engines in excess of 500 kW are too small to propel massive ocean-going vessels or used by the largest road trucks and off-road vehicles, or as electricity generators in emergencies or isolated locations.

Diesel engines

Ships, trucks, and generators use diesel engines which due to their high compression are inherently more efficient.

Household energy use

The average U.S. wood and charcoal consumption was very high: about 100 GJ/capita in 1860, compared to about 350 GJ/capita for all fossil and biomass fuel at the beginning of the twenty-first century. But as the typical 1860 combustion efficiencies were only around 10%, the useful energy reached only about 10 GJ/capita. Weighted efficiency of modern household, industrial, and transportation conversions is about 40% and hence the useful energy serving an average American is now roughly 150 GJ/year, nearly 15-fold higher than during the height of the biomass era.

Households claimed a relatively small share of overall energy use during the early phases of industrialization, first only as coal (or coal briquettes) for household stoves, later also as low- energy coal (town) gas, and (starting during the 1880s) as electricity for low-power light bulbs, and soon afterwards also for numerous household appliances. Subsequently, modern energy use has seen a steady decline of industrial and agricultural consumption and increasing claims of transportation and household sectors. For example, in 1950 industries consumed more than half of the world’s primary commercial energy, at the time of the first oil crisis (1973) their share was about one-third, and by 2010 it declined to about 25%. Major appliances (refrigerators, electric stoves, washing machines) became common in the United States after World War I, and private car ownership followed the same trend. As a result by the 1960s households became a leading energy-using sector in all affluent countries. There are substantial differences in sectoral energy use among the industrializing low-income nations and postindustrial high-income economies. Even after excluding all transportation energy, U.S. households have been recently claiming more than 20% of the country’s primary energy supply in 2006, while in China the share was only about 11 %.

Most energy needs are for low-temperature heat, dominated by space heating (up to about 25°C), hot water for bathing and clothes washing (maxima of, respectively, about 40°C and 60°C), and cooking (obviously 100°C for boiling, up to about 250°C for baking). As already noted, ubiquitous heat waste is due to the fact that most of these needs are supplied by high-temperature combustion of fossil fuels. Steam and hot water produced by high-temperature combustion also account for 30-50% of energy needs in food processing, pulp and paper, chemical and petrochemical industries. High-temperature heat dominates metallurgy, production of glass and ceramics, steam-driven generation of electricity, and operation of all internal combustion engines.

Liquid Natural Gas (LNG)

By 2008 there were 250 LNG tankers with the total capacity of 183 Mt/year and the global LNG trade carried about 25% of all internationally traded natural gas (BP, 2009). LNG was imported by 17 countries on four continents, and before the economic downturn of 2008 plans envisaged more than 300 LNG vessels by 2010 with the total capacity of about 250 Mt/year as the global LNG trade has moved toward a competitive market. LNG trade has been finally elevated from a marginal endeavor to an important component of global energy supply, and this has become true in terms of total exports (approaching 30% of all natural gas sold abroad) and number of countries involved (now more than 30 exporters and importers

This brief recounting of LNG history is an excellent illustration of the decades-long spans that are often required to convert theoretical concepts into technical possibilities and then to adapt these technical advances and diffuse them to create new energy industries (Figure 1.4). Theoretical foundations of the liquefaction of gases were laid down more than a century before the first commercial application; the key patent that turned the idea of liquefaction into a commonly used industrial process was granted in 1895, but at that time natural gas was a marginal fuel even in the United States (in 1900 it provided about 3.5% of the country’s fossil fuel energy), and in global terms it had remained one until the 1960s, when its cleanliness and flexibility began to justify high price of its shipborne imports.

If we take the years between 1999 (when worldwide LNG exports surpassed 5% of all natural gas sales) and 2007 (when the number of countries exporting and importing LNG surpassed 30, or more than 15% of all nations) as the onset of LNG’s global importance, then it had taken about four decades to reach that point from the time of the first commercial shipment (1964), about five decades from the time that natural gas began to provide more than 10% of all fossil energies (during the early 1950s), more than a century since we acquired the technical means to liquefy large volumes of gases (by the mid- 1890s)-and about 150 years since the discovery of the principle of gas liquefaction. By 2007 it appeared that nothing could stop an emergence of a very substantial global LNG market. But then a sudden supply overhang that was created in 2008-and that was due to the combination of rapid capacity increases, lower demand caused by the global financial crisis, and the retreat of U.S. imports due to increased domestic output of unconventional gas-has, once again, slowed down global LNG prospects, and it may take years before the future course will become clear. In any case, the history of LNG remains a perfect example of the complexities and vagaries inherent in major energy transitions.

Coal

There have been some indications that the world’s coal resources may be significantly less abundant than the widespread impressions would indicate (Rutledge, 2008).

The genesis of the growing British reliance on coal offers some valuable generic lessons. Thanks to Nef’s (1932) influential work a national wood crisis has been commonly seen as the key reason for the expansion of coal mining between 1550 and 1680-but other historians could not support this claim, pointing to the persistence of large wooded areas in the country, seeing such shortages as largely local and criticizing unwarranted generalization based on the worst-case urban situations (Coleman, 1977). This was undoubtedly true, but not entirely relevant, as transportation constraints would not allow the emergence of a national fuelwood market, and local and regional wood scarcities were real.

In 1900 the worldwide extraction of bituminous coals and lignites added up to about 800 Mt; a century later it was about 4.5 Gt, a roughly 5.6-fold increase in mass terms and (because of the declining energy density of extracted coal) almost exactly four-fold increase in energy terms.

Meanwhile another major change took place, as the USSR, the world’s largest oil producer since 1975, dissolved, and the aggregate oil extraction of its former states declined by nearly a third between 1991 and 1996, making Saudi Arabia a new leader starting in 1993.

Natural gas is actually a mixture of light combustible hydrocarbons, with methane dominant but with up to a fifth of the volume made up of ethane, propane, and butane;

And, not to forget recently fashionable talk of carbon sequestration and storage, retaining the industry’s coal base but hiding its CO2 emissions underground would require putting in place a new massive industry whose mass-handling capacity would have to rival that of the world’s oil industry even if the controls were limited to a fraction of the generated gas.

Because coal’s declining relative importance was accompanied by a steady increase in its absolute production-from about 700 Mt of bituminous coals (including a small share of anthracite) and 70 Mt of lignites in 1900 to more than 3.6 Gt of bituminous coals and nearly 900 Mt of lignites in the year 2000, or a nearly 6-fold increase in mass terms and a more than 4-fold multiple in energy terms, coal ended up indisputably as the century’s most important fuel. Biofuels still supplied about 20% of the world’s fuel energy during the twentieth century, coal accounted for about 37%, oil for 27%, and natural gas for about 15%. Looking just at the shares of the three fossil fuels, coal supplied about 43%, crude oil 34%, and natural gas 20%. This indubitable conclusion runs, once again, against a commonly held, but mistaken, belief that the twentieth century was the oil era that followed the coal era of the nineteenth century.

Coal replacing biofuels reached the 5% mark around 1840, it captured 10% of the global market by 1855, 15% by 1865, 20% by 1870, 25% by 1875, 33% by 1885, 40% by 1895 and 50% by 1900. The sequence of years for these milestones was thus 15-25-30-35-45-55-60.

With China’s coal shares at nearly 73% in 1980 and at 70% in 2008 it is obvious that during the three decades of rapid modernization there was only the tardiest of transitions from solid fuel to hydrocarbons. China’s extraordinary dependence on coal means that the country now accounts for more than 40% of the world extraction, and that the mass it produces annually is larger than the aggregate output of the United States, India, Australia, Russia, Indonesia, and Germany, the world’s second- to seventh-largest coal producers. No other major economy, in fact no other country, is as dependent on coal as China: The fuel has also recently accounted for 95% of all fossil fuels used to produce electricity and as the thermal generation supplies nearly 80% of China’s total generation it is the source of more than 70% of electric power. China was self-sufficient

Nuclear power

Besides France, the countries with the highest nuclear electricity share (setting aside Lithuania, which inherited a large Soviet nuclear plant at Ingalina that gave it a 70% nuclear share) are Belgium and the Slovak Republic (about 55%), Sweden (about 45%), and Switzerland (about 40%); Japan’s share was 29%, the United States’ 19%, Russia’s 16%, India’s 3%, and China’s 2% (IAEA, 2009).

Saudi Arabian oil and gas

The high mean of the Saudi per capita energy consumption is misleading because a large part of the overall energy demand is claimed by the oil and gas industry itself and because it also includes substantial amounts of bunker fuel for oil tankers exporting the Saudi oil and refined products. Average energy use by households remains considerably lower than in the richest EU countries.

Even more importantly, Saudi Arabia’s high energy consumption has not yet translated into a commensurately high quality of life: Infant mortality remains relatively high and the status of women is notoriously low. As a result, the country has one of the world’s largest differences in the ranking between per capita GDP and the Human Development Index (UNDP, 2009). In this it is a typical Muslim society: In recent years 20 out of 24 Muslim countries in North Africa and the Middle East ranked higher in their GDP per capita than in their HDI-and in 2007/2008 the index difference for Saudi Arabia was -19 while for Kuwait and Bahrain it was -8 and for Iran it was -23.

Renewable Energy

There are nine major kinds of renewable energies: solar radiation; its six transformations as running water (hydro energy), wind, wind-generated ocean waves, ocean currents, thermal differences between the ocean’s surface and deep waters, and photosynthesis (primary production); geothermal energy and tidal energy complete the list.

As with fossil fuels, it is imperative to distinguish between renewable resources (aggregates of available fluxes) and reserves, their smaller (or very small) portions that are economically recoverable with existing extraction or conversion techniques. This key distinction applies as much to wind or waste cellulosic biomass as it does to crude oil or uranium, and that is why the often-cited enormous flows of renewable resources give no obvious indication as to the shares that can be realistically exploited.

Reviewing the potentially usable maxima of renewable energy flows shows a sobering reality. First, direct solar radiation is the only form of renewable energy whose total terrestrial flux far surpasses not only today’s demand for fossil fuels but also any level of global energy demand realistically imaginable during the twenty-first century (and far beyond). Second, only an extraordinarily high rate of wind energy capture (that may be environmentally undesirable and technically problematic) could provide a significant share of overall future energy demand. Third, for all other renewable energies maxima available for commercial harnessing fall far short of today’s fossil fuel flux, one order of magnitude in the case of hydro energy, biomass energy, ocean waves, and geothermal energy, two orders of magnitude for tides, and four orders of magnitude for ocean currents and ocean thermal differences.

Many regions (including the Mediterranean, Eastern Europe, large parts of Russia, Central Asia, Latin America, and Central Africa) have relatively low wind-generation potential (Archer & Jacobson, 2005); high geothermal gradients are concentrated along the ridges of major tectonic plates, above all along the Pacific Rim; and tidal power is dissipated mainly along straight coasts (unsuitable for tidal dams) and in regions with minor (<1 m) tidal ranges (Smil, 2008).

As already explained (in chapter 1), even ordinary bituminous coal contains 30-50% more energy than air-dry wood, while the best hard coals are nearly twice as energy-dense as wood and liquid fuels refined from crude oil have nearly three times higher energy density than air-dry phytomass. A biomass-burning power plant would need a mass of fuel 30-50% larger than a coal-fired station of the same capacity. Similarly, ethanol fermented from crop carbohydrates has an energy density of 24 MJ/L, 30% less than gasoline (and biodiesel has an energy density about 12% lower than diesel fuel).

But lower energy density of non-fossil fuels is a relatively small inconvenience compared to inherently lower power densities of converting renewable energy flows into mass-produced commercial fuels or into electricity at GW scales. Power density is the rate of flow of energy per unit of land area. The measure is applicable to natural phenomena as well as to anthropogenic processes, and it can be used in revealing ways to compare the spatial requirements of energy harnessing (extraction, capture, conversion) with the levels of energy consumption. In order to maximize the measure’s utility and to make comparisons of diverse sources, conversions, and uses my numerator is always in watts and the denominator is always a square meter of the Earth’s horizontal area (W/mz). Others have used power density to express the rate of energy flow across a vertical working surface of a converter, most often across the plane of a wind turbine’s rotation (the circle swept by the blades).

Power densities of hydro generation are thus broadly comparable to those of wind-driven generation, both having mostly magnitude of 10° W/m2 and exceptional ratings in the lower range of 101 W/m2.

Hydroelectricity will make important new contributions to the supply of renewable energy only in the modernizing countries of Asia, Africa, and Latin America. Because of their often relatively large reservoirs, smaller stations have power densities less than 1 W/mz; for stations with installed capacities of 0.5-1 GWthe densities go up to about 1.5 W/m2; the average power density for the world’s largest dams (>1 GW) is over 3 W/m2; the largest U.S. hydro station (Grand Coulee on the Columbia) rates nearly 20 W/m2; and the world’s largest project (Three Gorges station on the Chang Jiang) comes close to 30 W/m2 (Smil, 2008).

Typical power densities of phytomass fuels (or fuels derived by conversion of phytomass, including charcoal or ethanol) are even lower. Fast-growing willows, poplars, eucalypti, leucaenas, or pines grown in intensively managed (fertilized and if need be irrigated) plantations yield as little as 0.1 W/m2 in arid and northern climates but up to 1 W/m2 in the best temperate stands, with typical good harvests (about 10 t/ha) prorating to around 0.5 W/m2 (Figure 4.1). Crops that are best at converting solar radiation into new biomass (C4 plants) can have, when grown under optimum natural conditions and supplied by adequate water and nutrients, very high yields: National averages are now above 9 t/ha for U.S. corn and nearly 77 t/ha for Brazilian sugar cane (FAO, 2009). But even when converted with high fermentation efficiency, ethanol production from Iowa corn yields only about 0.25 W/m2 and from Brazilian sugar cane about 0.45 W/m2 (Bresnan & Contini, 2007).

The direct combustion of phytomass would yield the highest amount of useful energy.

Conversion of phytomass to electricity at large stations located near major plantations or the production of liquid or gaseous fuel: Such conversions would obviously lower the overall power density of the phytomass- based energy system (mostly to less than 0.3 W/m2), require even larger areas of woody plantations, and necessitate major extensions of high-voltage transmission lines, and hence further enlarge overall land claims. Moreover, as the greatest opportunities for large-scale cultivation of trees for energy are available only in parts of Latin America, Africa, and Asia, any massive phytomass cultivation would also require voluminous (and energy-intensive) long-distance exports to major consuming regions.

And even if future bioengineered trees could be grown with admirably higher power densities (say, 2 W/m2), their cultivation would run into obvious nutrient constraints. Non-leguminous trees producing dry phytomass at 15 t/ha would require annual nitrogen inputs on the order of 100 kg/ha during 10 years of their maturation. Extending such plantations to slightly more than half of today’s global cropland would require as much nitrogen as is now applied annually to all food and feed crops-but the wood harvest would supply only about half of the energy that we now extract in fossil fuels. Other major environmental concerns include accelerated soil erosion (particularly before the canopies of many row plantations of fast-growing trees would close) and availability of adequate water supplies (Berndes, 2002).

Average insolation densities of 102 W/m2 mean that even with today’s relatively low-efficiency PV conversions (the best rates in everyday operation are still below 20%) we can produce electricity with power densities of around 30 W/m2, and if today’s best experimental designs (multifunction concentrators with efficiency of about 40%) become commercial realities we could see PV generation power densities averaging more than 60 W/m2 and surpassing 400 W/m2 during the peak insolation hours. As impressive as that would be, fossil fuels are extracted in mines and hydrocarbons fields with power densities of 103-104 W/m2 (i.e., 1-10 kW/m2), and the rates for thermal electricity generation are similar (see Figure 4.1). Even after including all other transportation, processing, conversion, transmission, and distribution needs, power densities for the typical provision of coals, hydrocarbons, and thermal electricity generated by their combustion are lowered to no less than 102 W/m2, most commonly to the range of 250-500 W/m2. These typical power densities of fossil fuel energy systems are two to three orders of magnitude higher than the power densities of wind- or water-driven electricity generation and biomass cultivation and conversion, and an order of magnitude higher than today’s best photovoltaic conversions.

I have calculated that in the early years of the twenty-first century no more than 30,000 km2 were taken up by the extraction, processing, and transportation of fossil fuels and by generation and transmission of thermal electricity (Smil, 2008). Spatial claim of the world’s fossil fuel infrastructure is thus equal to the area of Belgium (or, even if the actual figure is up to 40% larger, to the area of Denmark). But if renewable energy sources were to satisfy significant shares (15-30%) of national demand for fuel and electricity, then their low power densities would translate into very large space requirements-and they would add up to unrealistically large land claims if they were to supply major shares of the global energy need.

At the same time, energy is consumed in modern urban and industrial areas at increasingly higher power densities, ranging from less than 10 W/m2 in sprawling cities in low-income countries (including their transportation networks) to 50-150 W/m2 in densely packed high-income metropolitan areas and to more than 500 W/m2 in downtowns of large northern cities during winter (Smil, 2008). Industrial facilities, above all steel mills and refineries, have power densities in excess of 500 W/m2 even prorated over their entire fence area-and high-rise buildings that will house an increasing share of humanity in the twenty-first century megacities go easily above 1,000 W/m2. This mismatch between the inherently low power densities of renewable energy flows and relatively high power densities of modern final energy uses (Figure 4.2) means that a solar-based system will require a profound spatial restructuring with major environmental and socioeconomic consequences.

In order to energize the existing residential, industrial, and transportation infrastructures inherited from the fossil-fuel era, a solar-based society would have to concentrate diffuse flows to bridge power density gaps of two to three orders of magnitude. Mass adoption of renewable energies would thus necessitate a fundamental reshaping of modern energy infrastructures, from a system dominated by global diffusion of concentrated energies from a relatively limited number of nodes extracting fuels with very high power densities to a system that would collect fuels of low energy density at low power densities over extensive areas and concentrate them in the increasingly more populous consumption centers.

Yang (2010) uses the history of solar hot water systems to argue that even at that point the diffusion of decentralized rooftop PV installations may be relatively slow. Solar hot water systems have been cost-effective (saving electricity at a cost well below grid parity) in sunny regions for decades, and with nearly 130 GW installed worldwide they are clearly also a mature innovation-and yet less than 1% of all U.S. households have chosen to install them (Davidson, 2005). The

Even the best conversions in research laboratories have required 15-20 years to double their efficiency and that another doubling for multi-junction and monocrystalline cells is highly unlikely.

Silicon analogy of Moore’s law does not apply to renewable energy

Fundamental physical and biochemical limits restrict the performance of other renewable energy conversions, be it the maximum yield of crops grown for fuel or woody biomass or the power to be harnessed from waves or tides: These limits will assert themselves after only relatively modest improvements of today’s performance and hence no strings of successive performance doublings are ahead.

Production of microprocessors is a costly activity, with the fabrication facilities costing at least $2-3 (and future ones up to $10) billion. But given the entirely automated nature of the production process (with microprocessors used to design more advanced fabrication facilities) and a massive annual output of these factories, the entire world can be served by only a small number of chip-making facilities. Intel, whose share of the global microprocessor market remains close to 80%, has only 15 operating silicon wafer fabrication facilities in nine locations around the world, and two new units under construction (Intel, 2009), and worldwide there are only about 300 plants making high-grade silicon. Such an infrastructural sparsity is the very opposite of the situation prevailing in energy production, delivery, and consumption.

Could anybody expect that the Chinese will suddenly terminate this brand-new investment and turn to costlier methods of electricity generation that remain relatively unproven and that are not readily available at GW scale? In global terms, could we expect that the world will simply walk away from fossil and nuclear energy infrastructures whose replacement cost is worth at least $15-20 trillion before these investments will be paid for and produce rewarding returns? Negative answers to these questions are obvious. But the infrastructural argument cuts forward as well because new large-scale infrastructures must be put in place before any new modes of electricity generation or new methods of producing and distributing biofuels can begin to make a major difference in modern high-energy economies. Given the scale of national and global energy demand (for large countries 1011 W, globally nearly 15 TW in 2010, likely around 20 TW by 2025) and the cost and complexity of the requisite new infrastructures, there can be no advances in the structure and function of energy systems that are even remotely analogical to Moore’s progression of transistor packing.

After an energy crisis, government leaders vow to do something.  Substitution goals are made, but not usually adhered to. “Robust optimism, naïve expectations, and a remarkable unwillingness to err on the side of caution is a common theme for most of these goals.

There have been many assumptions in the past of a rapid and smooth transition to renewable energy, especially after the first two energy crises of 1973-4 and 1979-81.  Here are just a few failed forecasts:

  • 1977 InterTechnology Corporation said by 2000 solar energy could provide 36% of U.S. industrial process heat
  • 1980 Sorensen though by 2005 renewable energy would provide 49% of U.S. power
  • Amory Lovin forecast over 30% renewables by 2000, in reality it was 7% with biogas supplying less than .001%, wind 0.04%, solar PV less than 0.1% and no use of solar energy for industrial heat supply.

Sweden

  • 1978: Sweden planned to get half its energy from tree plantations by 2015 that would cover 6 to 7% of their nation. Reedlands would be converted to pelleted phytomass.
  • 1991: Sweden dreams again of biomass energy from massive willow plantations covering 400,000 hectares by 2020 harvested 4 to 6 years after planting and every 3.5 years thereafter for 20 years to provide district heating and CHP power generation
  • 1996 planting ended at about 10% of the goal, and 40% of farmers stopped growing them.
  • 2008 all burnable renewable and waste biomass (mainly wood) provided less than 2% of primary energy.

Given this history of [failed] attempts at renewables are today’s forecasts of anticipated, planned, or mandated shares of renewable energies as unrealistic as those three decades ago?  Jefferson (2008) thinks so because “targets are usually too short term and clearly unrealistic…subsidy systems often promote renewable energy schemes that are misdirected and buoyed up by grossly exaggerated claims. One or two mature energy technologies are pushed nationally with insufficient regard for the costs, contribution to electricity generation, or transportation fuels’ needs”.

Al Gore believes the three main challenges of the economy, environment, and national security are all due to our “over-reliance on carbon-based fuels,” which could easily be fixed in 10 years by switching to solar, wind and geothermal.  He was confident this was true because as demand for renewable energy grew, the cost of it would fall, and used the Silicon Valley fallacy of technology doubling.

On average 15 GW/year of generating capacity were added every 20 years from 1987 and 2007. To make a transition to renewables 150 GW would needed to be added a year, and the longer the wait to do this the more needs to be added later on, perhaps 200 to 250 GW or 20 times as much as the record rate of 2008 (8.5 GW added wind capacity).  This “should suffice to demonstrate the impossibility of” doing so. On top of that this “impossible feat would also require writing off in a decade the entire fossil-fueled electricity generation industry and the associated production and transportation infrastructure, an enterprise whose replacement value is at least $2 trillion”.

The wind would have to come from the Great Plains and the solar from the Southwest, yet no major HV transmission lines link to East and West coast load centers.  So before you could build millions of wind turbines and solar PV panels, you’d need to rewire the United States first with high-capacity, long-distance transmission links, at least another 65,000 km (40,000 miles) in addition to the existing 265,000 km (165,000 miles) of HV lines.  These lines are at least $2 million/km.

“Installing in 10 years wind- and solar-generating capacity more than twice as large as that of all fossil-fueled stations operating today while concurrently incurring write-off and building costs on the order of $4-5 trillion and reducing regulatory of approval of generation and transmission megaprojects from many years to mere months would be neigher achievable nor affordable at the best of times: At a time when the nation has been adding to its massive national debt at a rate approaching $2 trillion a year, it is nothing but a grand delusion.”

Smil points out that promoters of grand plans greatly exaggerate the capacity factor of wind and solar.  Google plan, Clean Energy 2030, assumed wind and solar capacities of 35% each.  The reality in the European Union between 2003 and 2007 was that the average load factor for wind power was just 20.8%.  Even Arizona had a solar PV capacity factor average less than 25%.

There’s no way even cheaper-than-oil electricity generation in less sunny climates could displace fossil fuels without visionary mega-transmission lines between Algerian Sahara to Europe or from Arizona to the Atlantic coast.

It could take decades of cumulative experience to understand the risks and benefits of large-scale renewable systems and quantify the probability of catastrophic failures and the true lifetime costs.  We need decades of operating experience in a wide range of conditions.

As far as ethanol and biodiesel go, production has depended on very large and very questionable subsidies (Steenblik 2007).  Cellulosic fuels have yet to reach large-scale commercial production (and still haven’t in 2016).  Therefore “they should not be seen as imminent and reliable providers of alternative fuels”.

One of the biggest problems renewable energy enthusiasts don’t recognize is the challenge of converting the 100 year old existing system with centrally produced power from extremely high power density fuels to one with very low power density flows use in high power density urban areas. Decentralized power is fine for a farm or small town, but impossible for large cities that already house more than half of humanity, or megacities like Tokyo.

Renewable enthusiasts especially don’t understand the challenge of replacing fossil fuels required for key industrial feedstocks.  Coke made from coal has unique properties that make it the best way to smelt iron from oreCharcoal made from wood is too fragile to use in the enormous blast furnaces we have today.   If you tried to use wood charcoal to continue to match the coke-fired pig iron smelting of 900 Mt/year, you’d need about 3.5 Gt of dry wood from 350 Mha, the size of two-thirds of Brazil’s forest.  Nor do we have any plant-based substitutes for hydrocarbon feedstocks used to make plastics or synthesizing ammonia (production of fertilizer ammonia requires over 100 Gm3 a year).

Monetary cost.  All claims of price parity with oil and other fossil fuels depend on many assumptions whose true details are often impossible to ascertain, on uncertain choices of amortization periods and discount rates, and all of them are contaminated by past, present, and expected tax breaks, government subsidies, and simplistic, mechanistic assumptions about the future decline of unit costs. One might think that repeated cost overruns and chronically unmet forecasts of capital or operating costs should have had some effect, but they have done little to stop the recitals of new dubious numbers.

The fact that innovations require government support raises questions about the continuity of policies under different governments, or continuation of expensive projects when the economy is bad.

Given how long past transitions took surely a transition from fossil fuels will take generations.  And since the inertia of existing massive and expensive energy infrastructures and the transportation system can’t be replaced overnight, there will surely be a large component dependent on fossil fuels for many decades.   Indeed the transition will likely take much longer than past transitions, because renewables require a much larger physical area than fossil fuels and producing much less energy dense power, while past transitions added increasingly dense high power coal and oil to the energy mix, and yet these transitions took decades as well.

The list of seriously espoused energy “solutions” has run from that of nuclear fusion to an irrepressible (and always commencing in a decade or so) hydrogen economy, and its prominent entries have included everything from liquid metal fast breeder reactors to squeezing 5% of oil from the Rocky Mountain shales.”  And now the renewable list consists of “solutions” such as enormous numbers of bobbing wave converters, flexible PV films surrounding homes, enormous solar panels in orbit, algae disgorging high-octane gasoline, and harnessing jet stream wind with kits 12 km overhead.

“Ours is an overwhelmingly fossil-fueled society, our way of life has been largely created by the combustion of photosynthetically converted and fossilized sunlight—and there can no doubt that the transition to fossil fuels…led to a world where more people enjoy a higher quality of life than at any time in previous history. This grand solar subsidy, this still-intensifying depletion of an energy stock whose beginnings go back hundreds of millions of years, cannot last.”


Posted in Alternative Energy, Energy Books, Vaclav Smil | Tagged , , , , , , , , , , , | 13 Comments