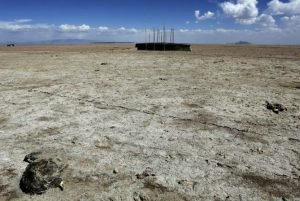
75% of Earth’s land is degraded threatening 3.2 billion people

Source: United Nations University


Preface. By 2050 95% of Earth’s land could be degraded and reducing or even preventing food production, forcing hundreds of millions to migrate.

More than 75% of our planet has been altered by humans, a figure that will likely rise to more than 90% by 2050, according to the first comprehensive assessment of land degradation and its impacts. The report, released this week by the Intergovernmental Science-Policy Platform on Biodiversity and Ecosystem Services, was prepared by more than 100 experts from around the world. Crops and livestock affect the greatest area—a third of all land—by contributing to soil erosion and water pollution. Wetlands are among the most impacted of ecosystems; 87% have been destroyed over the past 3 centuries (Science 2018).  An even longer and more detailed report than that in the National Geographic below is here.

Alice Friedemann  www.energyskeptic.com  Author of Life After Fossil Fuels: A Reality Check on Alternative Energy; When Trucks Stop Running: Energy and the Future of Transportation”, Barriers to Making Algal Biofuels, & “Crunch! Whole Grain Artisan Chips and Crackers”.  Women in ecology  Podcasts: WGBH, Jore, Planet: Critical, Crazy Town, Collapse Chronicles, Derrick Jensen, Practical Prepping, Kunstler 253 &278, Peak Prosperity,  Index of best energyskeptic posts

***

Leahy S (2018) 75% of Earth’s Land Areas Are Degraded. A new report warns that environmental damage threatens the well-being of 3.2 billion people.  National Geographic.

More than 75% of Earth’s land areas are substantially degraded, undermining the well-being of 3.2 billion people, according to the world’s first comprehensive, evidence-based assessment. These lands that have either become deserts, are polluted, or have been deforested and converted to agricultural production and are also the main causes of species extinctions.

If this trend continues, 95% of the Earth’s land areas could become degraded by 2050. That would potentially force hundreds of millions of people to migrate, as food production collapses in many places, the report warns. (Learn more about biodiversity under threat.)

“Land degradation, biodiversity loss, and climate change are three different faces of the same central challenge: the increasingly dangerous impact of our choices on the health of our natural environment,” said Sir Robert Watson, chair of the Intergovernmental Science-Policy Platform on Biodiversity and Ecosystem Services (IPBES), which produced the report (launched Monday in Medellin, Colombia).

IPBES is the “IPCC for biodiversity”—a scientific assessment of the status of non-human life that makes up the Earth’s life-support system. The land degradation assessment took three years and more than 100 leading experts from 45 countries.

Rapid expansion and unsustainable management of croplands and grazing lands is the main driver of land degradation, causing significant loss of biodiversity and impacting food security, water purification, the provision of energy, and other contributions of nature essential to people. This has reached “critical levels” in many parts of the world, Watson said in an interview.

Underlying Causes

Wetlands have been hit hardest, with 87% lost globally in the last 300 years. Some 54% have been lost since 1900. Wetlands continue to be destroyed in Southeast Asia and the Congo region of Africa, mainly to plant oil palm.

Underlying drivers of land degradation, says the report, are the high-consumption lifestyles in the most developed economies, combined with rising consumption in developing and emerging economies. High and rising per capita consumption, amplified by continued population growth in many parts of the world, are driving unsustainable levels of agricultural expansion, natural resource and mineral extraction, and urbanization.

Land degradation is rarely considered an urgent issue by most governments. Ending land degradation and restoring degraded land would get humanity one third of the way to keeping global warming below 2°C, the target climate scientists say we need to avoid the most devastating impacts. Deforestation alone accounts for 10 percent of all human-induced emissions.

Reference

News at a Glance. 2018. Alarm over land degradation. Science 359: 1444.

Posted in Biodiversity Loss, Limits To Growth, Peak Food | Tagged , , , | Comments Off on 75% of Earth’s land is degraded threatening 3.2 billion people

One less worry: the magnetic field flipping between north and south poles is not the end of the world

Preface.  The geomagnetic field reversal of polarity has occurred thousands of times in the geological past. We are overdue for another. Indeed, Earth’s dipole has decreased in strength by nearly 10% since it was first measured in 1840. It could happen within the next 2,000 years.

If the magnetic poles flip, it is likely solar radiation storms will crash power grids, satellites, and electronic communications for 10,000 years based on what we know of past reversals.

But not to worry, by 2100 there won’t be an electric grid, satellites, and electronic communications because there won’t be enough oil, coal, and natural gas left to run them.  Or wind and solar power, which also depend on fossils every single step of their life cycle.

By the time the poles flip, we’ll be back to horse drawn carriages, so not having GPS won’t be a big deal.   In a world that’s gone back to wood as the main energy and infrastructure resource, as in all past civilizations before fossils, no one is likely to even even notice the magnetic field is weak. Though we should feel sorry for migrating birds, it might throw them for a loop.

Theoretical physicist Richard Feynman once tried to describe what a magnetic field looked like: “Is it any different from trying to imagine a room full of invisible angels? No, it’s not like imagining invisible angels. It requires a much higher degree of imagination to understand the electromagnetic field than to understand invisible angels.”

Perhaps Feynman would have a better idea of what a magnetic field looks like if he’d gone to the arctic circle in the winter — auroras are electromagnetic fields shimmering and dancing across the night sky.

Though Feynman’s superstitious image is apt because the study of magnetism used to be part of religion, magic and natural philosophy. If the author had written this book a few hundred years ago, she might have been burned at the stake for her heresy.

Sure, if the poles flipped within the next 50 years, it would be a real disaster, just see my posts on an electromagnetic pulse here for details.  But the odds are good your great grandchild won’t even know it’s happened.

Alice Friedemann   www.energyskeptic.com  author of “When Trucks Stop Running: Energy and the Future of Transportation”, 2015, Springer and “Crunch! Whole Grain Artisan Chips and Crackers”. Podcasts: Derrick Jensen, Practical Prepping, KunstlerCast 253, KunstlerCast278, Peak Prosperity , XX2 report

***

Buffett, B. 2018. A candid portrait of the scientists studying Earth’s declining magnetism warns of potential peril if the poles swap places. Science.

A book review of Alanna Mitchel, 2018, “The Spinning Magnet: The Electromagnetic Force That Created the Modern World–and Could Destroy It”, Dutton.

Earth’s magnetic field protects the environment from the harsh conditions of space and its strength has been declining since Carl Friedrich Gauss measured this in the 1830s. The decline suggests that the magnetic field may flip in less than 2,000 years.  The last time this happened was 780,000 years ago.

The outcome would be a substantial lowering of our protective shield.Should that happen again, the weak magnetic field would wreak havoc on our power grids and other infrastructure.

Recent examples of failures in this protective barrier (Kappenman 1997) serve to highlight the problem. A large solar storm in March 1989 sent high levels of charged particles streaming toward Earth. These particles impinged on the magnetic field and induced electric currents through power grids in Quebec, Canada. The ensuing blackout affected 6 million customers. A reduction in the field strength would allow charged particles to penetrate deeper into the Earth system, causing greater damage with even modest solar storms. A substantial and sustained collapse of the magnetic field during a reversal would likely end our present system of power distribution.

Throughout the book, there is a clear and effective attempt to cast a spotlight on the individuals who have contributed to our understanding of Earth’s magnetic field. Mitchell has a sharp eye for mannerisms and a vivid way of bringing personalities to the page. Her explanations are aimed at a nontechnical audience, and the analogies she uses to describe complex scientific ideas are always entertaining. For example, a crowded washroom at a “beer-soaked” sporting event serves as the starting point for an illustration of Pauli’s exclusion principle. Her enthusiasm for the book’s subject matter shines throughout.

There is little doubt that the magnetic field will reverse again. In the meantime, The Spinning Magnet gives readers a nontechnical description of electromagnetism and a measured assessment of the possible consequences for our modern world if it does so in the near future.

Reference

Kappenman, J. G., et al. 1997. Space weather from a user’s perspective: Geomagnetic storm forecasts and the power industry. American Geophysics Union 78: 37-45

Posted in Electric Grid & EMP Electromagnetic Pulse | Tagged , | Comments Off on One less worry: the magnetic field flipping between north and south poles is not the end of the world

Crash alert: China’s resource crisis could be the trigger

Preface.  Way to go Nafeez Ahmed, your second home run of reality based reporting on the energy crisis this week.  There are countless economists within the mainstream media predicting an economic crisis worse than in 2008, but they totally ignore energy. How refreshing to see an article where energy is front and center in explaining why there may be an economic crash in the future.

Alice Friedemann   www.energyskeptic.com  author of “When Trucks Stop Running: Energy and the Future of Transportation”, 2015, Springer and “Crunch! Whole Grain Artisan Chips and Crackers”. Podcasts: Derrick Jensen, Practical Prepping, KunstlerCast 253, KunstlerCast278, Peak Prosperity , XX2 report

Nafeez Ahmed. September 12, 2018. The next financial crash is imminent, and China’s resource crisis could be the trigger. Over three decades, the value of energy China extracts from its domestic oil, gas and coal supplies has plummeted by half. Medium.com

China’s economic slowdown could be a key trigger of the coming global financial crisis, but one of its core drivers — China’s dwindling supplies of cheap domestic energy — is little understood by mainstream economists.

All eyes are on China as the world braces itself for what a growing number of financial analysts warn could be another global economic recession.

In a BBC interview to mark the 10th anniversary of the global financial crisis, Bank of England Governor Mark Carney described China as “one of the bigger risks” to global financial stability.

The Chinese “financial sector has developed very rapidly, and it has many of the same assumptions that were made in the run-up to the last financial crisis,” he warned:

“Could something like this happen again?… Could there be a trigger for a crisis — if we’re complacent, of course it could.”

Since 2007, China’s debts have quadrupled. According to the IMF, its total debt is now about 234 percent of gross GDP, which could rise to 300 percent by 2022. British financial journalist Harvey Jones catalogues a range of observations from several economists essentially warning that official data might not reflect how bad China’s economy is actually decelerating.

The great hope is that all this is merely a temporary blip as China transitions from a focus on manufacturing and exports toward domestic consumption and services.

Meanwhile, China’s annual rate of growth continues to decline. The British Foreign Office (FCO) has been monitoring China’s economic woes closely, and in a recent spate of monthly briefings this year has charted what appears to be its inevitable decline.

Last month, the FCO’s China Economics Network based out of the British Embassy in Beijing documented that China’s economy had “further softened… with indicators weakening across the board”.

The report found that: “Investment, industrial production, and retail sales all weakened, despite easing measures”; and noted that high-level Chinese measures to sustain economic growth were running out of steam.

China’s economic slowdown, moreover, coincides with brewing expectations that Wall Street’s longest running stock market bull run could be about to end soon.

One analysis of this sort came from Wall Street veteran Mark Newton, former Chief Technical Analyst at multi-billion dollar hedge fund Greywolf Capital, and prior to that a Morgan Stanley technical strategist.

Newton predicts that US stocks are close to peaking out, leading to a massive 40–50 percent plunge starting in the spring of 2019 or by 2020 at the latest. He explained that:

“Technically there have started to be warning signs with regards to negative momentum divergence (an indicator that can signal a pending trend reversal), which have appeared prior to most major market tops, including 2000 and 2007.”

Newton’s forecast is similar to a prediction made by US economist Professor Robert Aliber of the University of Chicago Booth School of Business. Earlier this year, INSURGE reported exclusively on Aliber’s forecast of a 40-50 percent stock market crash (in or shortly after 2018), based on examining the dynamic of previous banking crises.

The vulnerability of both the US and Chinese economies — not to mention the string of other vulnerabilities in numerous other countries from Brexit to Turkey to Italy — demonstrates that whatever the actual trigger might be, the resulting impact is likely to have a domino effect across multiple interconnected vulnerabilities.

This could well lead to a global financial crash scenario far worse than what began in 2008.

But financial analysts have completely missed a deeper biophysical driver of China’s economic descent: energy.

Last October, INSURGE drew attention to new scientific study led by the China University of Petroleum in Beijing, which found that China is about to experience a peak in its total oil production as early as 2018.

Without finding an alternative source of “new abundant energy resources”, the study warned, the 2018 peak in China’s combined conventional and unconventional oil will undermine continuing economic growth and “challenge the sustainable development of Chinese society.”

These conclusions have been corroborated by a new paper published this February in the journal Energy, once again led by a team at the China University of Petroleum.

The study applies the measure of Energy Return On Investment (EROI), a simple but powerful ratio to calculate how much energy is being invested to extract a particular quantity of energy.

The team attempted a more refined EROI calculation, noting that standard calculations look at energy obtained at the wellhead compared to what is used to extract it; whereas a more precise measure would look at energy available at ‘point of use’ (so, after extraction from the wellhead, processing and transportation until it is actually used for something tangible in society).

Using this approach to EROI, the study finds that over a period of around three decades (between 1987 and 2012), the value of the energy extracted from China’s domestic fossil fuel base declined by more than half from 11:1 to 5:1.

This means that more and more energy is being expended to extract a decreasing amount of energy: a process that is gradually undermining the rate of economic growth.

A similar finding extends to China’s coal consumption:

“In 1987, the energy production sectors consumed 1 ton standard coal equivalent (TCE) energy inputs for every 10.01 TCE of produce net energy. However, in 2012, this number declined to 4.25.”

The study uses this data to simulate the impact on China’s GDP, and concludes that China’s declining GDP is directly related to the declining EROI or energy value of its domestic hydrocarbon resource base.

But it isn’t just China experiencing an EROI decline. This is a global phenomenon, one that was recently noted by a scientific report to the United Nations that I covered for VICE, which warned that the global economy as a whole is shifting to a new era of declining resource quality.

This doesn’t mean we are ‘running out’ of fossil fuels — but it means that as the resource quality of those fuels decline, we increase the costs on our environment and systems of production, all of which increasingly impact on the health of the global economy.

As long as mainstream economic institutions remain blind to the fundamental biophysical basis of economics, as masterfully articulated by Charles Hall and Kent Klitgaard in their seminal book, Energy and the Wealth of Nations: An Introduction to BioPhysical Economics, they will remain in the dark about the core structural reasons why the current configuration of global capitalism is so prone to recurrent crisis and collapse.

Dr. Nafeez Ahmed is the founding editor of INSURGE intelligence. Nafeez is a 17-year investigative journalist, formerly of The Guardian where he reported on the geopolitics of social, economic and environmental crises. Nafeez reports on ‘global system change’ for VICE’s Motherboard, and on regional geopolitics for Middle East Eye. He has bylines in The Independent on Sunday, The Independent, The Scotsman, Sydney Morning Herald, The Age, Foreign Policy, The Atlantic, Quartz, New York Observer, The New Statesman, Prospect, Le Monde diplomatique, among other places. He has twice won the Project Censored Award for his investigative reporting; twice been featured in the Evening Standard’s top 1,000 list of most influential Londoners; and won the Naples Prize, Italy’s most prestigious literary award created by the President of the Republic. Nafeez is also a widely-published and cited interdisciplinary academic applying complex systems analysis to ecological and political violence.


Posted in Crash Coming Soon, EROEI remaining oil too low, Peak Oil | Tagged , , , , | Comments Off on Crash alert: China’s resource crisis could be the trigger

The coming crash in 2020 from high diesel prices for cleaner emission of oceangoing ships

Preface.  Ships made globalization possible, and play an essential role in our high standard of living, carrying 90% of global goods traded. But the need for a new, cleaner fuel may cause the next economic crisis.  Currently ships can burn anything, shipping fuel is almost asphalt, but will be less so if cleaned up for emissions. What follows are excerpts from P. K. Verleger’s 2018 article “$200 Crude, the economic crisis of 2020, and policies to prevent catastrophe”.

Update Feb 2021: covid-19 has knocked petroleum use down so much that the jet and diesel portions of crude oil are being added to marine fuels.  These are more expensive fractions of a barrel. But blending can cause problems. Using too much kerosene can lower the temperature at which fuels catch fire, a serious risk for vessels (Loh and Koh 2020).

Here are a few summary paragraphs from this paper:

The global economy likely faces an economic crash of horrible proportions in 2020 due to a lack of  low-sulfur diesel fuel for oceangoing ships when a new International Maritime Organization rule takes place January 1, 2020. Until now, ships have burned “the dregs” of crude oil, full of sulfur and other pollutants, because it was the least expensive fuel available.

The economic collapse I predict will occur because the world’s petroleum industry lacks the capacity needed to supply additional low-sulfur fuel to the shipping industry while meeting the requirements of existing customers such as farmers, truckers, railroads, and heavy equipment operators.

Operators of simple refineries, in theory, could survive the IMO 2020 transition by changing the crude oil they process to “light sweet” crudes that can yield high volumes of low sulfur distillate, crudes such as those from Nigeria.  There is, though, a market constraint to this option. Volumes of low-sulfur crude oil are limited, and supplies are less certain because these crudes are produced primarily in Nigeria, a country that suffers frequent, politically induced market disruptions. Thus, when the inflexible refiners begin bidding for Nigerian oil, prices will rise, perhaps as much as three or four-fold.

IEA economists explained at the time that the oil price rise from 2007 to 2008 resulted in part from the frenzied bidding for limited quantities of low-sulfur crude oil, especially supplies from Nigeria. Then, as today, many refineries could not manufacture low-sulfur diesel from other crude-oil types, such as the Middle East’s light crude oils, because they lacked the needed equipment. In 2008, such refiners contentiously bid for low-sulfur crude, driving prices higher as they sought to avoid closure. This inability to process higher-sulfur crude oils created a peculiar situation. Ships loaded with such crudes were stranded on the high seas because the cargo owners could not find buyers.

At the same time, prices for light sweet crudes rose to record levels. The desperate need for low-sulfur crudes caused buyers to bid their prices higher and higher. This situation will reoccur in 2020. The global refining industry will not be able to produce the additional volumes of low-sulfur diesel and low-sulfur fuel oil required by the maritime industry. In some cases, refiners will close because they cannot find buyers for the high-sulfur fuel they had sold as ship bunkers. In others, refiners will seek lighter, low-sulfur crude oils, bidding up prices as they did in 2008. This price increase may be double the 2008 rise, however, because the magnitude of the fuel shift is greater and the refining industry is less prepared.

The crude price rise will send all product prices higher. Diesel prices will lead, but gasoline and jet fuel will follow. US consumers could pay as much as $6 per gallon for gasoline and $8 or $9 per gallon for diesel fuel.

Below are excerpts about peak diesel from this article: Antonio Turiel, Ugo Bardi. 2018. For whom is peak oil coming? If you own a diesel car, it is coming for you! Cassandra’s legacy.

Six years ago we commented on this same blog that, of all the fuels derived from oil, diesel was the one that would probably see its production decline first. The reason why diesel production was likely to recede before that of, for example, gasoline had to do with the fall in conventional crude oil production since 2005 and the increasing weight of the so-called “unconventional oils,” bad substitutes not always suitable to produce diesel.

…since 2007 (and therefore before the official start of the economic crisis) the production of fuel oils has declined.

Surely, in this shortage, we can start noting the absence of some 2.5 Mb/d of conventional oil (more versatile for refining and therefore more suitable for the production of fuel oil), as we were told by the International Energy Agency in his last annual report. This explains the urgency to get rid of the diesel that has lately shaken the chancelleries of Europe: they hide behind real environmental problems (which have always troubled diesel, but which were always given less than a hoot) to try to make a quick adaptation to a situation of scarcity. A shortage that can be brutal, since no prevention was performed for a situation that has long been seen coming.

the production of heavy gas oil has been dropping from 2007, when there was not as much regulatory interest as there seems to be now. There is one aspect of the new regulations that I think is interesting to highlight here: from 2020 onwards, all ships will have to use fuel with a lower sulfur content. Since, typically, the large freighters use very heavy fuel oils, that requirement, they say, makes one fear that a shortage of diesel will occur. In fact, from what we have discussed in this post, what seems to be happening is that heavy fuel oils are declining very fast and ships will have no choice but to switch to diesel. That this is going to cause problems of diesel shortage is more than evident. It is an imminent problem, even more than the peaks in oil prices that, according to what the IEA announces, will appear by 2025.

fracking oil only serves to make gasoline and that is why the diesel problem remains.

That is why, dear reader, when you are told that the taxes on your diesel car will be raised in a brutal way, now you know why. Because it is preferred to adjust these imbalances with a mechanism that seems to be a market (although this is actually less free and more adjusted) rather than telling the truth. The fact is that, from now on, what can be expected is a real persecution against cars with an internal combustion engine (gasoline will be next, a few years after diesel).

And more from this author in a different article:

conventional oil crude arrived to a peak in 2005 (followed by minimum attempts in 2012, 2015 and 2016confirming a plateau, note of the translator. Data from Art Berman). This is a recognized fact, even by the International Energy Agency (IEA) in its World Energy Outlook (WEO) of 2010

This conventional crude oil is still the most of the oil we consume today worldwide; more than 70%, but their production is declining: in 2005 69,5 Mb/d were being produced. Today some 67 Mb/d. That is, some 2.5 Mb/d less.

The conventional oil crude is the easiest to extract and also the most versatile; the oil that has more wide uses. Specifically, it is the most adequate to refine diesel from it.

To compensate the conventional crude oil, the good one, several oil substitutes were gradually introduced. There are the most diverse ones: biofuels, bitumen,Light Tight Oil, Liquid fuels from natural gas….all of them have two common characteristics: they are most costly to be extracted and their production is quite limited, it cannot rise much.

Besides, most of these so called “non conventional oils” are not suitable to refine or distillate diesel. That’s why we have the present problems with diesel. The more the conventional oil crude production will fall, more will the diesel production drop.

In addition, the latest EIA 2018 report says that if oil companies continue to not invest in oil exploration and production as they have been the past few years, in 20205 we are likely to be short 34 million barrels per day — about a third of all liquid fuels we consume today.

Some statistics:

By value, more than 70% of global trade makes part of its journey by ship, by volume 80%, using 4% of global oil, or 3.3 million barrels a day of the nastiest gunk at the bottom of the oil barrel.

Bunker fuel is also known as high-sulfur fuel oil because it contains up to 3,500 times as much sulfur as the diesel you put in your Volkswagen. Although sulfur’s not a greenhouse gas, it triggers acid rain, which contributes to ocean acidification, and ship exhaust intensifies thunderstorms, so shipping lanes get extra lightning. Sulfur emissions cause respiratory problems and lung disease in humans, especially those who live near ports. It’s such a problem, the IMO estimates the new sulfur-curtailing rule will prevent more than 570,000 premature deaths in the next 5 years.

Alice Friedemann   www.energyskeptic.com  author of “Life After Fossil Fuels: A Reality Check on Alternative Energy”, 2021, Springer; “When Trucks Stop Running: Energy and the Future of Transportation”, 2015, Springer, Barriers to Making Algal Biofuels, and “Crunch! Whole Grain Artisan Chips and Crackers”. Podcasts: Collapse Chronicles, Derrick Jensen, Practical Prepping, KunstlerCast 253, KunstlerCast278, Peak Prosperity , XX2 report

***


Verleger, P. K., Jr. July 2018. $200 Crude, the economic crisis of 2020, and policies to prevent catastrophe.   Pkverlegerllc.com

The proverb “For want of a nail” ends by warning that a kingdom was lost “all for want of a horseshoe nail.” The proverb dates to 1230. As Wikipedia explains, the aphorism warns of the importance of logistics, of having sufficient supplies of critical materials.  The global economy likely faces an economic crash of horrible proportions in 2020, not for want of a nail but want of low-sulfur diesel fuel. The lack of adequate supplies promises to send the price of this fuel— which is critical to the world’s agricultural, trucking, railroad, and shipping industries—to astoundingly high levels. Economic activity will slow and, in some places, grind to a halt. Food costs will climb as farmers, unable to pay for fuel, reduce plantings. Deliveries of goods and materials to factories and stores will slow or stop. Vehicle sales will plummet, especially those of gas-guzzling sport utility vehicles (SUVs). One or more major US automakers will face bankruptcy, even closure. Housing foreclosures will surge in the United States, Europe, and other parts of the world. Millions will join the ranks of the unemployed as they did in 2008. All for the want of low-sulfur diesel fuel or gasoil.   Wikipedia [https://tinyurl.com/n7sb629].

The International Maritime Organization (IMO) decreed that oceangoing ships must adopt measures to limit sulfur emissions or burn fuels containing less than 0.5 sulfur—in other words, switch to low-sulfur diesel fuel. The sulfur rule takes effect January 1, 2020.

The economic collapse I predict will occur because the world’s petroleum industry lacks the capacity needed to supply additional low-sulfur fuel to the shipping industry while meeting the requirements of existing customers such as farmers, truckers, railroads, and heavy equipment operators. These users purchase diesel fuel or gasoil, the petroleum product that accounts for the largest share of products consumed. In most countries, they must buy low-sulfur diesel fuel to reduce pollution.

Economists at the International Energy Agency, have warned that these prices must increase 20 to 30%.

While higher prices are worrisome, they should not by themselves lead to a major recession. After all, diesel fuel prices have increased more than 30% at various times this decade. However, these estimates assume that crude prices do not change.

Difficulties will arise because crude oil is not a homogeneous commodity like, for example, bottles of Jack Daniels Kentucky sour mash. Instead, crude oils vary regarding their qualities and composition, and these differences exceed those of most other goods.

Two important distinguishing factors among crude oils are how much sulfur they contain and the diesel fuel volume they produce when refined.  Some crude oils—the light sweet varieties—contain minimal sulfur and produce large amounts of low-sulfur diesel. A far greater number—the heavy sour crudes— contain a higher percentage of sulfur and do not produce diesel that meets environmental sulfur content standards without expensive additional processing.

While many world refineries can produce low-sulfur diesel fuel from heavy sour crudes, a large number have not been equipped to do this yet and thus cannot help in meeting the IMO 2020 requirements.

Much of the incremental crude that will be supplied in 2019 as world production increases will be Arab Heavy. The distillate produced from this crude contains between 1.8 and 2% sulfur.

Much of the sulfur in crude is not removed during refining but rather ends up in “fuel oil,” the “dregs” or residue left over after all the high-value products have been distilled out. It is the cheapest liquid fuel available. It is also viscous (it must be heated before use) and contains many pollutants, particularly sulfur, that are harmful to humans, animals, and plants. Since the turn of the 21st century, most fuel oil has been consumed by the shipping industry due to the environmental restrictions on other uses. It was only a matter of time before those restrictions came to marine fuel.

In order to make enough clean fuel available to vessels, very large price hikes may be required to suppress non-maritime use.

Refiners will need to “destroy” or find new markets for up to two million barrels per day of high-sulfur fuel oil. Some of it will be sold to oil-burning power plants such as those in the Middle East. These plants could and likely will shift to residual fuel oil to save money

Other volumes of high-sulfur fuel oil will be sold to refiners configured with cokers, where they will be “destroyed,” to use the oil industry’s language. Cokers split heavy fuel or heavy crude into light products and coke. ExxonMobil’s new coker at its Antwerp refinery, for example, will “turn high sulfur oils created as a byproduct of the refining process into various types of diesel, including shipping fuels that will meet new environmental laws.”4 These units will be critical in converting fuel that can no longer be burned in ships into marketable products. The rub is that cokers are very expensive (ExxonMobil’s will cost more than $1 billion) and require significant construction time.

The magnitude of the coming oil market transformation is unprecedented. This historic increase in demand for low-sulfur diesel combined with the equally historic need to dispose of unwanted fuel oil that will, absent moderating actions by nations and the IMO, cause an economic collapse in 2020.

Today, the high sulfur fuel oil price is roughly 90% of the crude price. In 2020, it could fall as low as 10% of the crude price. As a result, the price of low-sulfur distillate, which today sells for 120% of the crude price, would need to rise to perhaps 200% of the crude price to compensate the owners of refineries with limited flexibility that can produce some low-sulfur diesel along with equal or larger volumes of high sulfur fuel oil. Should prices of low-sulfur distillate fail to rise to such levels, these facilities will have to close.

Owners of simple refineries could attempt to procure a different crude feedstock. The only way for these refineries to vary their output is by changing the crude processed. Some crude oils, as mentioned, produce more low-sulfur diesel and less high-sulfur fuel oil than others. Operators of simple refineries, in theory, could survive the IMO 2020 transition by changing the crude oil they process to “light sweet” crudes that can yield high volumes of low sulfur distillate, crudes such as those from Nigeria.  There is, though, a market constraint to the third option. Volumes of low-sulfur crude oil are limited, and supplies are less certain because these crudes are produced primarily in Nigeria, a country that suffers frequent, politically induced market disruptions. Thus, when the inflexible refiners begin bidding for Nigerian oil, prices will rise, perhaps as much as three or four-fold.

Economist James Hamilton asserts strongly, for instance, that the oil price increase in 2008 would have caused a recession on its own. The price rise had already exacerbated a significant downturn in the US automobile industry. General Motors, Ford, and Chrysler had begun closing plants and laying off workers early in the year as sales of SUVs and many autos all but stopped due to lack of demand.

IEA economists explained at the time that the oil price rise from 2007 to 2008 resulted in part from the frenzied bidding for limited quantities of low-sulfur crude oil, especially supplies from Nigeria. Then, as today, many refineries could not manufacture low-sulfur diesel from other crude-oil types, such as the Middle East’s light crude oils, because they lacked the needed equipment. In 2008, such refiners contentiously bid for low-sulfur crude, driving prices higher as they sought to avoid closure. This inability to process higher-sulfur crude oils created a peculiar situation. Ships loaded with such crudes were stranded on the high seas because the cargo owners could not find buyers.

At the same time, prices for light sweet crudes rose to record levels. The desperate need for low-sulfur crudes caused buyers to bid their prices higher and higher. This situation will reoccur in 2020. The global refining industry will not be able to produce the additional volumes of low-sulfur diesel and low-sulfur fuel oil required by the maritime industry. In some cases, refiners will close because they cannot find buyers for the high-sulfur fuel they had sold as ship bunkers. In others, refiners will seek lighter, low-sulfur crude oils, bidding up prices as they did in 2008. This price increase may be double the 2008 rise, however, because the magnitude of the fuel shift is greater and the refining industry is less prepared.

The crude price rise will send all product prices higher. Diesel prices will lead, but gasoline and jet fuel will follow. US consumers could pay as much as $6 per gallon for gasoline and $8 or $9 per gallon for diesel fuel.

The high petroleum product prices will have two impacts. First, prices of everything consumed in the economy will rise. Second, high prices will force consumers to spend less on other goods and services, which will depress demand for airline travel, restaurant dinners, and new automobiles, to mention just a few. The potential impact of higher fuel prices on everything purchased across the economy is obvious. They will raise costs in the agricultural sector, leading to higher food prices. They will boost delivery costs and airline ticket prices.

Sadly, the economic losses could be much greater than any experienced in the prior five decades. The US economy will be further handicapped by the federal government’s debt. The ratio of US debt to GDP has increased from 60% in 2008 to 103% today

The increase in debt, combined with the tax cuts enacted in 2017, leaves the country with little room to address a recession. Instead, a large oil price increase could lead to an extraordinarily difficult downturn.

The government might find it impossible to fund an infrastructure program. Many states might be unable to provide income supplements to the unemployed. Emerging market nations would suffer as well. These nations would be especially exposed because they already face significant economic weakness as a strengthening dollar and rising US interest rates cause large declines in bond and equity markets in countries such as Brazil and Turkey.

If it were a country, the global shipping industry would rank as the 6th largest emitter of greenhouse gasses worldwide.

The IMO adopted a rule in 2008 that contemplated removing most sulfur from fuels used in the world’s oceangoing vessels, which number more than sixty thousand.

Oil production in Venezuela, a major player in the global oil market, collapsed. OPEC, Russia, and several other producing countries reduced output to force inventory liquidations and raise prices. To top it off, in 2018 the United States seems intent on reinstating sanctions on Iran, possibly removing a crude supply source that might be essential in cushioning price increases. These events and actions will all influence market developments in 2020 when the IMO rule becomes effective.

The amount of crude available for refining has a direct impact on the availability of diesel fuel. At the most basic level, world refiners can produce roughly 560,000 barrels of diesel from every million barrels of crude refined, according to Morgan Stanley analysts, so 1.8 million barrels per day of crude must be refined to produce one million barrels per day of diesel.

Global crude production of one hundred million barrels per day in 2020 would require an 8% increase in output from 2017. The annual rate of increase would need to be 3% per year, three times the rate of increase for the last decade. Achieving this boost will be difficult, if not impossible, should the changes in the global supply situation noted at the start of the section— Venezuela’s production decline, OPEC’s output restraint, and the reinstatement of US sanctions on Iran—remain unchanged.

The collapse of Venezuela’s oil production was not anticipated in 2016. Oil output from the country totaled around two million barrels per day when the IMO program was ratified. Two years later, output has declined to 1.5 million barrels per day. By 2020, Venezuela may be producing no crude, which would remove 1.5 million barrels per day from the global market.

Taken together, the loss of Venezuelan output, the inventory reduction engineered by OPEC, Russia, and a few other producers, and the renewed sanctions on Iran will subtract 2.5 to three million barrels per day from the market.

These estimates assume consumers in every country accept the higher prices. This assumption is questionable, however. Recently, truck drivers in Brazil brought the nation to a standstill while demanding lower diesel prices. Eventually, the Brazilian government gave in to the drivers’ demands when gasoline stations ran dry and grocery store shelves emptied. The president cut the diesel price twelve percent, reduced the road tolls paid by trucks, and offered other benefits to end the strike. Truck drivers in other countries could respond in the same way to high prices.

Believe it or not, this prediction must be viewed as optimistic even though the economic consequences of oil selling for $130 per barrel would be terrible. It is optimistic because it assumes market disruptions will be limited to a loss of Iranian crude and the collapse of Venezuelan output. It also assumes the pipeline constraints that keep US “light tight” crude oil (LTO) away from the market today will be resolved and that world refiners will be able to process the LTOs. Finally, it assumes that production in Canada, Libya, and Nigeria continues uninterrupted and that no other disruptive events occur.

US LTOs may create problems for refineries even if they get to market. These crudes are very light. Many refiners must blend other crudes with them before processing. The analysis here assumes this obstacle will be overcome.

A large oil price increase could create a catastrophe where debt cannot be serviced, and a situation such as the Asian debt crisis of 1997 could result.

Any action taken would probably occur after the economic collapse was well under way, just as the financial problems that caused the 2008 meltdown were only addressed after 2008.

These members see global warming as a serious issue and strongly favor the Paris Accords adopted in 2016. The United States withdrew from that agreement in 2017. Thus, one can envision the IMO members refusing to moderate the 2020 rule unless the United States reverses course and ratifies the Paris climate agreement. The United States has no control over the IMO and so can do nothing on its own. It is part of a very small minority there.

The Trump administration’s trade policy will further weaken the willingness of other nations to ease restrictions to help the US. The United States has followed an aggressive unilateral trade strategy since Donald Trump became president. His administration’s policies have left many frustrated and angry. The upcoming economic squeeze tied to the IMO rule provides them a way to even the score.

Economic policies being followed by the Trump administration threaten to reduce the amount of goods moving in international trade. Ironically, a trade war could decrease the amount of fuel used in international commerce, which would lessen the sulfur rule’s impact.

The IMO regulation on marine-fuel sulfur content, if left unchanged, will likely have widespread impacts on the petroleum sector. Crude oil prices could rise to $160 per barrel or higher as the rule takes effect, assuming no market disruptions. Prices could rise much higher with any disruption, even a moderate one. The higher prices will slow economic growth. If they breach $200 per barrel, they would likely lead to a recession or worse.

References

Low E, Koh A (2020) Jet Fuel Finds Once Unthinkable Home. Bloomberg.

Posted in By People, Crash Coming Soon, Peak Oil, Ships and Barges | Tagged , , , | 3 Comments

India wants to build dangerous fast breeder reactors

Preface. India was planning to build six fast breeder reactors in 2016, but now in 2018, they’ve reduced the number to 2.  This is despite the high cost, instability, danger, and accidents of the 16 previous world-wide attempts that have shut down, including the Monju fast breeder in Japan, which began decommissioning in 2018.

Breeders that produce commercial power don’t exist. There are only four small experimental prototypes operating.

Breeder reactors are much closer to being bombs than conventional reactors – the effects of an accident would be catastrophic economically and in the number of lives lost if it failed near a city (Wolfson).

Alice Friedemann   www.energyskeptic.com  author of “When Trucks Stop Running: Energy and the Future of Transportation”, 2015, Springer and “Crunch! Whole Grain Artisan Chips and Crackers”. Podcasts: Derrick Jensen, Practical Prepping, KunstlerCast 253, KunstlerCast278, Peak Prosperity , XX2 report

Ramana, M. V. 2016. A fast reactor at any cost: The perverse pursuit of breeder reactors in India. Bulletin of the Atomic Scientists.

Projections for the country’s nuclear capacity produced by India’s Department of Atomic Energy (DAE) call for constructing literally hundreds of breeder reactors by mid-century. For a variety of reasons, these projections will not materialize, making the pursuit of breeder reactors wasteful.

But first, some history. The DAE’s fascination with breeder reactors goes back to the 1950s. The founders of India’s atomic energy program, in particular physicist Homi J. Bhabha, did what most people in those roles did around that time: portray nuclear energy as the inevitable choice for providing electricity to millions of Indians and others around the world. At the first major United Nations-sponsored meeting in Geneva in 1955, for example, Bhabha argued for “the absolute necessity of finding some new sources of energy, if the light of our civilization is not to be extinguished, because we have burnt our fuel reserves. It is in this context that we turn to atomic energy for a solution… For the full industrialization of the under-developed countries, for the continuation of our civilization and its further development, atomic energy is not merely an aid; it is an absolute necessity.” Consequently, Bhabha proposed that India expand its production of atomic energy rapidly.

There was a problem though. India had a relatively small amount of good quality uranium ore that could be mined economically. But it was known that the country did have large reserves of thorium, a radioactive element that was considered a “great potential source of energy.” But despite all the praises one often hears about it, thorium has a major shortcoming: It cannot be used to fuel a nuclear reactor directly but has to first be converted into the chain-reacting element uranium-233, through a series of nuclear reactions. To produce uranium-233 in large quantities, Bhabha proposed a three-step plan that involved starting with the more readily available uranium ore. The first stage of this three-phase strategy involves the use of uranium fuel in heavy water reactors, followed by reprocessing the irradiated spent fuel to extract the plutonium. In the second stage, the plutonium is used to provide the startup cores of fast breeder reactors, and these cores would then be surrounded by “blankets” of either depleted or natural uranium to produce more plutonium. If the blanket were thorium, it would produce chain-reacting uranium-233. Finally, the third stage would involve breeder reactors using uranium-233 in their cores and thorium in their blankets. Breeder reactors, therefore, formed the basis of two of the three stages.

Bhabha was hardly alone in thinking of breeders. The first breeder reactor concept was developed by Leό Szilárd in 1943, who was responding to concerns, shared by colleagues who were engaged in developing the first nuclear bomb, that uranium would be scarce. The idea of a phased program involving uranium and thorium had also been proposed in October 1954 by François Perrin, the head of the French Atomic Energy Commission, who argued that France will “have to use for power production both primary reactors [using natural or slightly enriched uranium] and secondary breeder reactors [fast neutron plutonium reactors] … in the slightly more distant future … this second type of reactor … may be replaced by slow neutron breeders using thorium and uranium-233. We have considered this last possibility very seriously since the discovery of large deposits of thorium ores in Madagascar.” (At that time, Madagascar was a French colony, achieving independence only in 1960.)

That was then. In the more than 60 years that have passed since the adoption of the three-phase plan, we have learned a lot about breeder reactors. Three of the important lessons are that fast breeder reactors are costly to build and operate; they have special safety problems; and they have severe reliability problems, including persistent sodium leaks.

These problems were observed in countries around the world, and have not been solved despite spending over $100 billion (in 2007 dollars) on breeder reactor research and development, and on constructing prototypes.

India’s own experience with breeders so far consists of one, small, pilot-scale fast breeder reactor, whose operating history has been patchy. The budget for the Fast Breeder Test Reactor (FBTR) was approved by the Department of Atomic Energy in 1971, with an anticipated commissioning date of 1976. But it was October 1985 before the reactor finally attained criticality, and a further eight years (i.e., 1993) elapsed before its steam generator began operating. The final cost was more than triple the initial cost estimate. But the reactor’s troubles were just beginning.

The FBTR’s operations have been marred by several accidents of varying intensity. Dealing with even relatively minor accidents has been complicated, and the associated delays have been long. As of 2013, the FBTR had operated for only 49,000 hours in 26 years, or barely 21 percent of the maximum possible operating time. Although the FBTR was originally designed to generate 13.2 megawatts of electricity, the most it has achieved is 4.2 megawatts. But rather than realizing that the FBTR’s performance was typical of breeders elsewhere and learning the appropriate lesson—that they are unreliable and susceptible to shutdowns—the DAE terms this history as demonstrating a “successful operation of FBTR” and describes the “development of Fast Breeder Reactor technology” as “one of the many salient successes” of the Indian nuclear power program.

Even before the Fast Breeder Test Reactor had been constructed, India’s Department of Atomic Energy embarked on designing a much larger reactor, the previously mentioned Prototype Fast Breeder Reactor, or PFBR. Designed to generate 500 megawatts of electricity, the PFBR would be nearly 120 times larger than its testbed cousin, the FBTR. The difficulties of such scaling-up are apparent when one considers the French experience in building the 1,240 megawatt Superphenix breeder reactor; that reactor was designed on the basis of experience with both a test and a 250-megawatt demonstration reactor and still proved a complete failure. Nonetheless, the DAE pressed on.

Full steam ahead. Work on designing the PFBR started in 1981, and nearly a decade later, the trade journal Nucleonics Week reported that the Indian government had “recently approved the reactor’s preliminary design and … awarded construction permits” and that the reactor would be on line by the year 2000.

That was not to be. After multiple delays, construction of the PFBR finally started in 2004; then, the reactor was projected to become critical in 2010. The following year, the director announced that the project “will be completed 18 months ahead of schedule.”

The saga since then has involved a series of delays, followed by promises of imminent project completion. The current promise is for a 2017 commissioning date. Regardless of whether that happens, the PFBR has already taken more than twice as long to construct as initially projected. Alongside the lengthy delay comes a cost increase of nearly 63 percent—so far.

Even at the original cost estimate, and assuming high prices for uranium ($200 per kilogram) and heavy water (around $600 per kilogram), my former colleague J. Y. Suchitra, an economist, and I showed several years ago that electricity from the PFBR will be about 80 percent more expensive in comparison with electricity from nuclear power plants based on the heavy water that the DAE itself is building. These assumptions were intended to make the PFBR look economically more attractive than it really will be. A lower uranium price will make electricity from heavy water reactors cheaper. On the global market, current spot prices of uranium are around $50 per kilogram and declining; they have not exceeded $100 per kilogram for many years. Likewise, the heavy water cost assumed was quite high; the United States recently purchased heavy water from Iran at a cost of $269 per kilogram instead of the $600 per kilogram assumed figure.

The calculation also assumed that breeder reactors operate extremely reliably, with a load factor of 80%. (Load factors are the ratio of the actual amount of electrical energy generated by a reactor to what it should have produced if it had operated at its design level continuously.) No breeder reactor has achieved an 80% load factor; by comparison, in the real world the UK’s Prototype Fast Reactor and France’s Phenix had load factors of 26.9% and 40.5% respectively.

Consequently, even with very optimistic assumptions about the cost and performance of India’s Prototype Fast Breeder Reactor, and the deliberate choice of high costs for the inputs used in heavy water reactors, the PFBR cannot compete with nuclear electricity from the others kinds of reactors that India’s Department of Atomic Energy builds. With more realistic values and after accounting for the significant construction cost escalation, electricity from the Prototype Fast Breeder Reactor could be 200 percent more expensive than that from heavy water reactors.

But such arguments don’t resonate with DAE officials. As one unnamed official told sociologist Catherine Mei Ling Wong, “India has no option … we have very modest resources of uranium. Suppose tomorrow, the import of uranium is banned … then you will have to live with this modest uranium. So … you have to have a fast reactor at any cost. There, economics is of secondary importance.” This argument is misleading because India’s uranium resource base is not a single fixed number. The resource base increases with continued exploration for new deposits, as well as technological improvements in uranium extraction. In addition, as with any other mineral, at higher prices it becomes economic to mine lower quality and less accessible ores. In other words, if the price offered for uranium is higher, the amount of uranium available will be larger, at least for the foreseeable future.

One must keep these factors in mind when making economic comparisons between breeder reactors and heavy water reactors. Even for the earlier set of assumptions, without the dramatic cost increase of the PFBR factored in, breeders become competitive only when uranium prices exceeded $1,375 per kilogram—a truly astronomical figure, given the current spot price of $50 per kilogram. Significantly larger quantities of uranium will become available at such a price. In other words, the pursuit of breeder reactors will not be economically justified even when uranium becomes really, really scarce—which is not going to happen for decades, perhaps even centuries, given that nuclear power globally is not growing all that much.

The DAE, of course, claims that future breeder reactors will be cheaper. But that decline in costs will likely come with a greater risk of severe accidents. This is because the PFBR, and other breeder reactors, are susceptible to a special kind of accident called a core disassembly accident. In these reactors, the core where the nuclear reactions take place is not in its most reactive—or energy producing—configuration. An accident involving the fuel moving around within the core, (when some of it melts, for example) could lead to more energy production, which leads to more core melting, and so on, potentially leading to a large, explosive energy release that might rupture the reactor vessel and disperse radioactive material into the environment. The PFBR, in particular, has not been designed with a containment structure that is capable of withstanding such an accident. Making breeder reactors cheaper could well increase the likelihood and impact of such core disassembly accidents.

What of the DAE’s projections of large numbers of breeder reactors to be constructed by mid-century? It turns out that the methodology used by the DAE in its projections suffers from a fundamental error, and the DAE’s calculations have not accounted properly for the future availability of plutonium that will be necessary to construct the many, many breeder reactors the DAE proposes to build. What the DAE has omitted in its calculations is the lag period between the time a certain amount of plutonium is committed to a breeder reactor and when it reappears (along with additional plutonium) for refueling the same reactor, thus contributing to the start-up fuel for a new breeder reactor. A careful calculation that takes into account the constraints flowing from plutonium availability leads to drastically lower projections. The projections could be even lower if one takes into account the potential delays because of infrastructural and manufacturing problems. The bottom line: Even if all was going well, the breeder reactor strategy will simply not fulfill the DAE’s hopes of supplying a significant fraction of India’s electricity.

Ulterior motives? For all the praises it sings of breeder reactors, there is one reason for its attraction to the PFBR that the DAE does not talk much about, except indirectly. Consider this interview by the Indian Express, a national newspaper, with Anil Kakodkar, then-secretary of the DAE, about the US-India nuclear deal: “Both from the point of view of maintaining long-term energy security and for maintaining the minimum credible deterrent, the fast breeder programme just cannot be put on the civilian list. This would amount to getting shackled and India certainly cannot compromise one [security] for the other.” (There is some code language here. “Minimum credible deterrent” is a euphemism for India’s nuclear weapons arsenal. “Put on the civilian list” means that the International Atomic Energy Agency will not safeguard the reactor, and so it is possible for fissile materials from the reactor to be diverted to making nuclear weapons.)

What this points to is the possibility that breeder reactors like the PFBR can be used as a way to quietly increase the Department of Atomic Energy’s weapons-grade plutonium production capacity several-fold. But as mentioned earlier, this is not a reason that the DAE likes to publicly admit. Nevertheless, the significance of keeping the PFBR outside of safeguards has not been lost, especially on Pakistan.

Breeder reactors have always underpinned the DAE’s claims about generating large quantities of electricity. That promise has been an important source of its political power. For this reason, India’s DAE is unlikely to abandon its commitment to breeder reactors. But given the troubled history of breeder reactors, both in India and elsewhere, the more appropriate strategy to follow would be to simply abandon the three-phase strategy. The DAE’s reliance on a technology shown to be unreliable suggests that the organization is incapable of learning the appropriate lessons from its past and makes it more likely that nuclear power will never become a major source of electricity in India.

References

NP. 2018. India slashes plans for new nuclear reactors by two-thirds. Neutronbytes.com

Wolfson, R. 1993. Nuclear Choices: A Citizen's Guide to Nuclear Technology. MIT Press

Posted in Nuclear Power Energy | Tagged , , , , | Comments Off on India wants to build dangerous fast breeder reactors

Germany’s wind energy mess: As subsidies expire, thousands Of turbines to close

Preface. This means that the talk about renewables being so much cheaper than anything else isn’t necessarily true.  If wind were profitable, more turbines would be built to replace the old ones  without subsidies needed. Unless they can be dumped in the 3rd world, they’ll be modern civilizations Easter Head icons.

Summary: A large number of Germany’s 29,000 turbines are approaching 20-years-old and for the most part, they are outdated [my note: 20 years is the lifespan of wind turbines]. The generous subsidies granted at the time of their installation are slated to expire soon and thus make them unprofitable. By 2020, 5,700 turbines with an installed capacity of 45 GW will see their subsidies run out. And after 2020, thousands of these turbines will lose their subsidies with each passing year, which means they will be taken offline and mothballed. So with new turbines coming online only slowly, it’s entirely possible that wind energy output in Germany will decline in the coming years.

It’s impossible to recycle composite materials because the large blades are made of fiberglass composite materials whose components cannot be separated from each other. Burning the blades is extremely difficult, toxic, and energy-intensive. So naturally, there’s a huge incentive for German wind park operators to dump the old contraptions onto third-world countries, and to let them deal later with the garbage.

Alice Friedemann   www.energyskeptic.com  author of “When Trucks Stop Running: Energy and the Future of Transportation”, 2015, Springer and “Crunch! Whole Grain Artisan Chips and Crackers”. Podcasts: Practical Prepping, KunstlerCast 253, KunstlerCast278, Peak Prosperity , XX2 report

***

April 23, 2018. Germany’s wind energy mess: As subsidies expire, thousands of turbines to close. Climate Change Dispatch.

As older turbines see subsidies expire, thousands are expected to be taken offline due to lack of profitability.

Green nightmare: Wind park operators eye shipping thousands of tons of wind turbine litter to third world countries – and leaving their concrete rubbish in the ground.

The Swiss national daily Baseler Zeitung here recently reported how Germany’s wind industry is facing a potential “abandonment”.

Approvals tougher to get

This is yet another blow to Germany’s Energiewende (transition to green energies). A few days ago, I reported here how the German solar industry had seen a monumental jobs’ bloodbath and investments have been slashed to a tiny fraction of what they once were.

Over the years, Germany has made approvals for new wind parks more difficult as the country reels from an unstable power grid and growing protests against the blighted landscapes and health hazards.

Now that the wind energy boom has ended, the Baseler Zeitung reports that “the shutdown of numerous wind turbines could soon lead to a drop in production” after having seen years of ruddy growth.

Subsidies for old turbines run out

Today a large number of Germany’s 29,000 total turbines nationwide are approaching 20-years-old and for the most part, they are outdated.

Worse: the generous subsidies granted at the time of their installation are slated to expire soon and thus make them unprofitable.

After 2020, thousands of these turbines will lose their subsidies with each passing year, which means they will be taken offline and mothballed.

The Baseler Zeitung writes:

The Baseler Zeitung adds that some 5,700 plants with an installed capacity of 45 GW will see their subsidies run out by 2020.  In the following years, it will be between 2000 and 3000 GW, for which the state subsidization is eliminated. The German Wind Energy Association estimates that by 2023 around 14,000 MW of installed capacity will lose production, which is more than a quarter of German wind power capacity on land.  According to the German Wind Energy Association, installed capacity per megawatt is expected to cost 30,000 euros.

The Swiss daily reports further:  So with new turbines coming online only slowly, it’s entirely possible that wind energy output in Germany will recede in the coming years, thus making the country appear even less serious about climate protection.

Wind turbine dump in Africa?

So what happens to the old turbines that will get taken offline?

Wind park owners hope to send their scrapped wind turbine clunkers to third-world buyers, Africa for example. But if these buyers instead opt for new energy systems, then German wind park operators will be forced to dismantle and recycle them – a costly endeavor, reports the Baseler Zeitung.

Impossible to recycle composite materials

The problem here is the large blades, which are made of fiberglass composite materials and whose components cannot be separated from each other.  Burning the blades is extremely difficult, toxic, and energy-intensive.

So naturally, there’s a huge incentive for German wind park operators to dump the old contraptions onto third-world countries, and to let them deal later with the garbage.

Sweeping garbage under the rug

Next, the Baseler Zeitung brings up the disposal of the massive 3,000-tonne reinforced concrete turbine base, which according to German law must be removed. The complete removal of the concrete base can quickly cost hundreds of thousands of euros.

Some of these concrete bases reach depths of 20 meters and penetrate multiple ground layers, the Baseler Zeitung reports, adding:

Already wind park operators are circumventing this huge expense by only removing the top two meters of the concrete and steel base, and then hiding the rest with a layer of soil, the Baseler writes.

In the end, most of the concrete base will remain as garbage buried in the ground, and the above-ground turbine litter will likely get shipped to third-world countries.

That’s Germany’s Energiewende and contribution to protecting the environment and climate!

Posted in Electric Grid & EMP Electromagnetic Pulse, Energy Infrastructure, Wind | Tagged , , , , | 8 Comments

Book review of Vaclav Smil’s “Energy Transitions: History, Requirements, Prospects”

Preface.  In my extract of the 178 pages in the book below, Smil explains why renewables can’t possibly replace fossil fuels, and appears to be exasperated that people believe this can be done when he writes “Common expectations of energy futures, shared not only by poorly informed enthusiasts and careless politicians but, inexplicably, by too many uncritical professionals, have been, for decades, resembling more science fiction than unbiased engineering, economic, and environmental appraisals.”

Yet Smil makes the same “leap of faith” as the “uncritical professionals” he criticizes.  He remains “hopeful in the long run because we can’t predict the future.” And because the past transitions “created more productive and richer economies and improved the overall quality of life—and this experience should be eventually replicated by the coming energy transition.”

Huh? After all the trouble he’s taken to explain why we can’t possibly transition from fossil fuels to anything else he ends on a note of happy optimism with no possible solution?

Alice Friedemann  www.energyskeptic.com  Author of Life After Fossil Fuels: A Reality Check on Alternative Energy; When Trucks Stop Running: Energy and the Future of Transportation”, Barriers to Making Algal Biofuels, & “Crunch! Whole Grain Artisan Chips and Crackers”.  Women in ecology  Podcasts: WGBH, Financial Sense, UCSC, Jore, Planet: Critical, Crazy Town, Collapse Chronicles, Derrick Jensen, Practical Prepping, Kunstler 253 &278, Peak Prosperity,  Index of best energyskeptic posts

***

Smil, Vaclav. 2010. Energy Transitions: History, Requirements, Prospects.  Praeger.

Agriculture

Modern agriculture consumes directly only a few percent of the total energy supply as fuels and electricity to operate field machinery (tractors, combines, irrigation pumps) and mostly as electricity for heating, cooling, and machinery used in large-scale animal husbandry. But the indirect energy cost of agricultural production (to produce agricultural machinery, and to synthesize energy- intensive fertilizers, pesticides, and herbicides) and, even more so, energy costs of modern industrial food processing (including excessive packaging), food storage (the category dominated by refrigeration), retailing, cooking, and waste management raise the aggregate cost of the entire food production/distribution/preparation/disposal system to around 15% of total energy supply.

10% of all extracted oil and slightly more than 5% of all natural gas are used as chemical feedstocks, above all for syntheses of ammonia and various plastics.

Biomass

Photosynthesis uses only a small part of available wavelengths (principally blue and red light amounting to less than half of the energy in the incoming spectrum) and its overall conversion efficiency is no more than 0.3% when measured on the planetary scale and only about 1.5% for the most productive terrestrial (forest) ecosystems.

Large-scale biofuel cultivation and repeated removal of excessive shares of photosynthetic production could further undermine the health of many natural ecosystems and agro-ecosystems by extending monocultures and opening ways for greater soil erosion and pest infestation.

Terrestrial photosynthesis proceeds at a rate of nearly 60 TW, and even a tripling of biomass currently used for energy would not yield more than about 9 TW.

All preindustrial societies had a rather simple and persistent pattern of primary fuel use as they derived all of their limited heat requirements from burning biomass fuels. Fuelwood (firewood) was the dominant source of primary energy, but woody phytomass would be a better term: the earliest users did not have any requisite saws and axes to cut and split tree trunks, and those tools remained beyond the reach of the poorest peasants even during the early modern era. Any woody phytomass was used, including branches fallen to the ground or broken off small trees, twigs, and small shrubs. In large parts of the sub-Saharan Africa and in many regions of Asia and Latin America this woody phytomass, collected mostly by women and children, continues to be the only accessible and affordable form of fuel for cooking and water and house heating for the poorest rural families. Moreover, in some environments large shares of all woody matter were always gathered by families outside forests from small tree clumps and bushes, from the litter fall under plantation tree crops (rubber, coconut) or from roadside, backyard, or living fence trees and shrubs. This reliance on non-forest phytomass also continues today in many tropical and subtropical countries: Rural surveys conducted during the late 1990s in Bangladesh, Pakistan, and Sri Lanka found that this non-forest fuelwood accounted for more than 80% of all wood by households (RWEDP, 1997). And in less hospitable, arid or deforested, environments, children and women collected any available non-woody cellulosic phytomass, fallen leaves (commonly raked in North China’s groves, leaving the ground barren), dry grasses, and plant roots. For hundreds of millions of people the grand energy transition traced in this chapter is yet to unfold: They continue to live in the wooden era, perpetuating the fuel usage that began in prehistory.

Another usage that has been around for millennia is the burning of crop residues (mostly cereal and leguminous straws, but also corn or cotton stalks and even some plant roots) and sundry food- processing wastes (ranging from almond shells to date kernels) in many desert, deforested, or heavily cultivated regions. And on the lowest rung of the reliance on biomass fuels was (and is) dry dung, gathered by those with no access to other fuels (be it the westward-moving settlers of the United States during the nineteenth century collecting buffalo dung or the poorest segments of rural population in today’s India) or whose environment (grasslands or high mountain regions) provides no suitable phytomass to collect (Tibetan and Andean plateaus and subtropical deserts of the Old World where, respectively, yak, llama, and camel dung can be collected).

Even if all of the world’s sugar cane crop were converted to ethanol, the annual ethanol yield would be less than 5% of the global gasoline demand in 2010. Even if the entire U.S. corn harvest was converted to ethanol, it would produce an equivalent of less than 15% of the country’s recent annual gasoline consumption. Biofuel enthusiasts envisage biorefineries using plant feedstocks that replace current crude oil refineries-but they forget that unlike the highly energy-dense oil that is produced with high power density, biomass is bulky, tricky to handle, and contains a fairly high share of water.

This makes its transport to a centralized processing facility uneconomical (and too energy intensive) beyond a restricted radius (maximum of about 50 miles / 80 km) and, in turn, this supply constraint limits the throughput of a biorefinery and the range of fuels to be produced-to say nothing about the yet-to-be- traversed path from laboratory benches to mass-scale production (Willems, 2009). A thoughtful review of biofuel prospects summed it up well: They can be an ingredient of the future energy supply but “realistic assessments of the production challenges and costs ahead impose major limits” (Sinclair, 2009, p. 407).

And finally, the proponents of massive biomass harvesting ignore a worrisome fact that modern civilization is already claiming (directly and indirectly) a very high share of the Earth’s net terrestrial primary productivity (NPP), the total of new phytomass that is photosynthesized in the course of a single year and that is dominated by the production of woody tissues (boles, branches, bark, roots) in tropical and temperate forests. Most of this photosynthate should be always left untouched in order to support all other nonhuman heterotrophs (from archaea and bacteria to primates) and to perform, directly or indirectly via the heterotrophs.

Biomass performs numerous indispensable environmental services. Given this fact it is astonishing, and obviously worrisome, that three independently conducted studies (Vitousek et al., 1986; Rojstaczer, Sterling, & Moore, 2001; Imhoff et al., 2004) agree that human actions are already appropriating perhaps as much as 40% of the Earth’s NPP as cultivated food, fiber, and feed, as the harvests of wood for pulp, timber, and fuel, as grass grazed by domesticated animals, and as fires deliberately set to maintain grassy habitats or to convert forests to other uses. This appropriation is also very unevenly distributed, with minuscule rates in some thinly populated areas of tropical rain forests to shares in excess of 60% in East Asia and to more than 70% in Western Europe (Imhoff et al., 2004). Local rates are even higher in the world’s most intensively cultivated agroecosystems of the most densely populated regions of Asia (China’s Jiangsu, Sichuan, and Guangdong, Indonesia’s Java, Bangladesh, the Nile Delta).

Any shift toward large-scale cultivation/harvesting of phytomass would push the global share of human NPP appropriation above 50% and would make many regional appropriation totals intolerably high. There is an utter disconnect between the proponents of transition to mass-scale biomass use and the ecologists whose Millennium Ecosystem Assessment (2005) demonstrated that essential ecosystemic services that underpin the functioning of all economies have been already modified, reduced, and compromised to a worrisome degree. Would any of numerous environmental services provided by diverse ecosystems-ranging from protection against soil erosion to perpetuation of biodiversity-be enhanced by extensive cultivation of high-yielding monocultures for energy? I feel strongly that the recent proposals of massive biomass energy schemes are among the most regrettable examples of wishful thinking and ignorance of ecosystemic realities and necessities.

Phytomass would have a chance to become, once again, a major component of the global primary energy supply only if we were to design new photosynthetic pathways that did not emerge during hundreds of millions of years of autotrophic evolution or if we were able to produce fuels directly by genetically manipulated bacteria. The latter option is now under active investigation, with Exxon being its most important corporate sponsor and Venter’s Synthetic Genomics its leading scientific developer (Service, 2009). Overconfident gene manipulators may boast of soon-to-come feats of algally produced gasoline, but how soon would any promising yields achieved in controlled laboratory conditions be transferable to mass-scale cultivation?

Even if we assume (quite optimistically) that the cultivation of phytomass for energy could average 1 W/m2, then supplanting today’s 12.5 TW of fossil fuels would require 12,500,000 km2, roughly an equivalent of the entire territories of the United States and India, an area more than 400 times larger than the space taken up by all of modern energy’s infrastructures.

Muscle Power

Basal metabolic rate (BMR) of all large mammals is a nonlinear function of their body mass M When expressed in watts it equals 3.4Mo-75 (Smil, 2008). This yields 70-90 W for most adult males and 55-75 W for females. Energy costs of physical exertion are expressed as multiples of the BMR: Light work requires up to 2.5 BMR, moderate tasks up to 5 BMR, and heavy exertions need as much as 7 BMR or in excess of 300 W for women and 500 W for men. Healthy adults can work at those rates for hours, and given the typical efficiency of converting the chemical energy into the mechanical energy of muscles (15-20%) this implies at most between 60 W (for a 50-kg female) and about 100 W (for an 85-kg man) of useful work, and equivalents of five to seven steadily working adults performing as much useful labor as one draft ox and about six to eight men equaling the useful exertion of a good, well-harnessed horse.

With the domestication of draft animals humans acquired more powerful prime movers, but because of the limits imposed by their body sizes and commonly inadequate feeding the working bovines, equids, and camelids were used to perform only mostly the most demanding tasks (plowing, harrowing, pulling heavy cart- or wagon-loads or pulling out stumps, lifting water from deep wells) and most of the labor in traditional societies still needed human exertion.

Working bovines (many cattle breeds and water buffaloes) weigh from just 250 kg to more than 500 kg. With the exception of donkeys and ponies, working equines are more powerful: Larger mules and horses can deliver 500-800 W compared to 250-500 W for oxen. Some desert societies also used draft camels, elephants performed hard forest work in the tropics, and yaks, reindeer, and llamas were important pack animals. At the bottom of the scale were harnessed dogs and goats. Comparison of plowing productivities conveys the relative power of animate prime movers. Even in the light soil it would take a steadily working peasant about 100 hours of hoeing to prepare a hectare of land for planting; in heavier soils it could be easily 150 hours. In contrast, a plowman guiding a medium-sized ox harnessed inefficiently by a simple wooden yoke and pulling a primitive wooden plow would do that work in less than 40 hours; a pair of good horses with collar harness and a steel plough would manage in just three hours.

No draft animal could make good progress on soft muddy or sandy roads, even less so when pulling heavy carts with massive wooden (initially full disk; spokes came around 2000 BCE in Egypt) wheels. When expressed in terms of daily mass-distance (t-km), a man pushing a wheelbarrow rated just around 0.5 t-km (less than 50-kg load transported 10-15 km), a pair of small oxen could reach 4-5 t-km (10 times te load at a similarly slow speed), and a pair of well-fed and well-harnessed nineteenth-century horses on a hard-top road could surpass 25 t-km.

My approximate calculations indicate that by 1850 draft animals supplied roughly half of all useful work, human labor provided as much as 40%, and inanimate prime movers delivered between 10% and 15%. By 1900 inanimate prime movers (dominated by steam engines, with water turbines in the second place) contributed 45%-50%, animal labor provided about a third, and human labor no more than a fifth of the total. By 1950 human labor, although in absolute terms more important than ever, was a marginal contributor (maximum of about 5%), animal work was down to about 10%, and inanimate prime movers (dominated by internal combustion engines and steam and water turbines) contributed at least 85%, and very likely 90%, of all useful work.

Wind

The power of water wheels rose from 102 W to larger wheels of 103 W after 1700 to as much as a few hundred kW (105  W) by 1850.  Windmills showed up a thousand years later and culminated in machines capable of no more than 104 W by the late 19th century.  Although water wheel power rose 1000-fold over 2,000 years, steam engine power grew exponentially in less than 50 years from 105  W to 1 MW (10 W) by 1900.  Steam turbines rose 6 orders of magnitude, a million-fold jump in less than 300 years.

Wind turbines are now seen as great harbingers of renewability, about to sever our dependence on fossil fuels. But their steel towers are made from the metal smelted with coal-derived coke or from recycled steel made in arc furnaces, and both processes are energized by electricity generated largely by turbo-generators powered by coal and natural gas combustion. And their giant blades are made from plastics synthesized from hydrocarbon feedstocks that are derived from crude oil whose extraction remains unthinkable without powerful diesel, or diesel-electric, engines.

The total power of winds generated by this differential heating is a meaningless aggregate when assessing resources that could be harnessed for commercial consumption because the Earth’s most powerful winds are in the jet stream at altitude around 11 km above the surface, and in the northern hemisphere their location shifts with seasons between 30° and 70° N. Even at altitudes reached by the hubs of modern large wind turbines (70-100 m above ground) only less than 15% of winds have speeds suitable for large-scale commercial electricity generation. Moreover, their distribution is uneven, with the Atlantic Europe and the Great Plains of North America being the premiere wind-power regions and with large parts of Europe, Asia, and Africa having relatively unfavorable conditions.

Harnessing significant shares of wind energy could affect regional climates and conceivably even the global air circulation. 

The power density of a 3-MW Vestas machine (now a common choice for large wind farms) is roughly 400 W/m2 and for the world’s largest machine, ENERCON E- 126 rated at 6 MW, it is 481 W/m2.

But because the turbines must be spaced at least three, and better yet five, rotor diameters apart in direction perpendicular to the prevailing wind and at least five, and with large installations up to ten, rotor diameters in the wind direction (in order to avoid excessive wake interference and allow for sufficient wind energy replenishment), power densities of wind generation are usually less than 10 W/m2. Altamont Pass wind farm averages 3.5 W/m2, while exceptionally windy sites may yield more than 10 W/m2 and less windy farms with greater spacing may rate just above 1 W/m2 (Figure 4.1).

Commercialization of large wind turbines has shown notable capacity advances and engendered high expectation. In 1986 California’s Altamont Pass, the first large-scale modern wind farm, whose construction began in the 1981, had average turbine capacity of 94 kW and the largest units rated 330 kW (Smith, 1987). Nearly 20 years later the world’s largest turbine rated 6 MW and typical new installations were 1 MW. This means that the modal capacities of wind turbines have been doubling every 5.5 years (they grew roughly 10-fold in two decades) and that the largest capacities have doubled every 4.4 years (they increased by a factor of 18 in two decades). Even so, these highest unit capacities are two orders of magnitude smaller than the average capacities of steam turbo-generators, the best conversion efficiencies of wind turbines have remained largely unchanged since the late 1980s (at around 35%), and neither they nor the maximum capacities will see several consecutive doublings during the next 10-20 years. The EU’s Up Wind research project has been considering designs of turbines with capacities between 10 and 20 MW whose rotor diameters would be 160-252 m, the latter dimension being twice the diameter of a 5-MW machine and more than three times the wing span of the jumbo A380 jetliner (UpWind, 2009; Figure 4.4).

Hendriks (2008) argues that building such structures is technically possible, because the Eiffel tower had surpassed 300 m already in 1889 and because we routinely build supertankers and giant container vessels whose length approaches 400 m, and assemble bridges whose individual elements have mass more than 5,000 t. That this comparison is guilty of a categorical mistake (as none of those structures is surmounted by massive moving rotors) is not actually so important: What matters are the economies of such giant turbines and, as Bulder (2009) concluded, those are not at all obvious. This is mainly because the weight stresses are proportional to the turbine radius (making longer blades more susceptible to buckling) and because the turbine’s energy yield goes up with the square of its radius while the mass (i.e., the turbine’s cost) goes up with the cube of the radius.

But even if we were to see a 20-MW machine as early as 2020 this would amount to just a tripling of the maximum capacities in a decade, hardly an unprecedented achievement: For example, average capacities of new steam turbo-generators installed in U.S. thermal stations rose from 175 MW in 1960 to 575 MW in 1970, more than a threefold gain. And it is obvious that no wind turbine can be nearly 100% efficient (as natural gas furnace or large electric motors now routinely are), as that would virtually stop the wind flow, and a truly massive deployment of such super-efficient turbines would drastically change local and regional climate by altering the normal wind patterns. The maximum share of wind’s kinetic energy that can be converted into rotary motion occurs when the ratio of wind speed after the passage through the rotor plane and the wind speed impacting the turbine is 1/3 and it amounts to 16/27 or 59% of the wind’s total kinetic energy (Betz, 1926). Consequently, it will be impossible even to double today’s prevailing wind turbine efficiencies in the future.

Hydropower

Storing too much water for hydro generation could weaken many environmental services provided by flowing river water (including silt and nutrient transportation, channel cutting, and oxygen supply to aquatic biota).

The total potential energy of the Earth’s runoff (nearly 370 EJ, or roughly 80% of the global commercial energy use in 2010) is just a grand sum of theoretical interest:  Most of that power can be never tapped for generating hydroelectricity because of the limited number of sites suitable for large dams, seasonal fluctuations of water flows, and the necessity to leave free-flowing sections of streams and to store water for drinking, irrigation, fisheries, flood control, and recreation uses.

As a result, the aggregate of technically exploitable capacity is only about 15% of the theoretical power of river runoff (WEC, 2007), and the capacity that could be eventually economically exploited is obviously even lower.

I have calculated the maximum conceivable share of water power during the late Roman Empire by assuming high numbers of working water wheels (about 25,000 mills), very high average power per machine (1.5 kW), and a high load factor of 50% (Smil, 2010a). These assumptions result in some 300 TJ of useful work while the labor of some 25 million adults (at 60 W for 300 eight-hour days) and 6 million animals (at just 300 W/head for 200 eight-hour days) added up to 30 PJ a year, or at least 100 times as much useful energy per year as the work done by water wheels. Consequently, even with very liberal assumptions water power in the late Roman Empire supplied no more than 1% of all useful energy provided by animate exertion-and the real share was most likely just a fraction of 1%.

Hydrokinetic power

  • Wind-driven ocean waves have kinetic energy of some 60 TW of which only 3 TW (5%) are dissipated along the coasts.
  • Tidal energy amounts to about 3 TW, of which only some 60 GW are dissipated in coastal waters.

Geothermal ultimate maximum globally is 600 GW

The Earth’s geothermal flux amounts to about 42 TW, but nearly 80% of that large total is through the ocean floor and all but a small fraction of it is a low-temperature diffuse heat. Available production techniques using hot steam could tap up to about 140 GW for electricity generation by the year 2050 (Bertani, 2009), and even if three times as much could be used for low- temperature heating the total would be less than 600 GW.

Better efficiencies

What has changed, particularly rapidly during the past 150 years, are the typical efficiencies of the process. In open fires less than 5% of wood’s energy ended up as useful heat that cooked the food; simple household stoves with proper chimneys (a surprisingly late innovation) raised the performance to 15-20%, while today’s most efficient household furnaces used for space heating convert 94-97% of energy in natural gas to heat.

The earliest commercial steam engines (Newcomen’s machines at the beginning of the eighteenth century) transferred less than 1% of coal’s energy into useful reciprocating motion-while the best compound steam engines of the late nineteenth century had efficiencies on the order of 20% and steam locomotives never surpassed 10%. Even today’s best-performing gasoline-fueled engines do not usually surpass 25% efficiency in routine operation.

The world’s largest marine diesel engines are now the only internal combustion machines whose efficiency can reach, and even slightly surpass, 50%.

Gasoline engines

Today’s automotive engines have power ranging from only about 50 kW for urban mini cars to about 375 kW for the Hummer, their compression ratios are typically between 9:1 and 12:1 and their mass/power ratios mostly between .8 and 1.2 g/W.  But even the most powerful gasoline-fueled engines in excess of 500 kW are too small to propel massive ocean-going vessels or used by the largest road trucks and off-road vehicles, or as electricity generators in emergencies or isolated locations.

Diesel engines

Ships, trucks, and generators use diesel engines which due to their high compression are inherently more efficient.

Household energy use

The average U.S. wood and charcoal consumption was very high: about 100 GJ/capita in 1860, compared to about 350 GJ/capita for all fossil and biomass fuel at the beginning of the twenty-first century. But as the typical 1860 combustion efficiencies were only around 10%, the useful energy reached only about 10 GJ/capita. Weighted efficiency of modern household, industrial, and transportation conversions is about 40% and hence the useful energy serving an average American is now roughly 150 GJ/year, nearly 15-fold higher than during the height of the biomass era.

Households claimed a relatively small share of overall energy use during the early phases of industrialization, first only as coal (or coal briquettes) for household stoves, later also as low- energy coal (town) gas, and (starting during the 1880s) as electricity for low-power light bulbs, and soon afterwards also for numerous household appliances. Subsequently, modern energy use has seen a steady decline of industrial and agricultural consumption and increasing claims of transportation and household sectors. For example, in 1950 industries consumed more than half of the world’s primary commercial energy, at the time of the first oil crisis (1973) their share was about one-third, and by 2010 it declined to about 25%. Major appliances (refrigerators, electric stoves, washing machines) became common in the United States after World War I, and private car ownership followed the same trend. As a result by the 1960s households became a leading energy-using sector in all affluent countries. There are substantial differences in sectoral energy use among the industrializing low-income nations and postindustrial high-income economies. Even after excluding all transportation energy, U.S. households have been recently claiming more than 20% of the country’s primary energy supply in 2006, while in China the share was only about 11 %.

Most energy needs are for low-temperature heat, dominated by space heating (up to about 25°C), hot water for bathing and clothes washing (maxima of, respectively, about 40°C and 60°C), and cooking (obviously 100°C for boiling, up to about 250°C for baking). As already noted, ubiquitous heat waste is due to the fact that most of these needs are supplied by high-temperature combustion of fossil fuels. Steam and hot water produced by high-temperature combustion also account for 30-50% of energy needs in food processing, pulp and paper, chemical and petrochemical industries. High-temperature heat dominates metallurgy, production of glass and ceramics, steam-driven generation of electricity, and operation of all internal combustion engines.

Liquid Natural Gas (LNG)

By 2008 there were 250 LNG tankers with the total capacity of 183 Mt/year and the global LNG trade carried about 25% of all internationally traded natural gas (BP, 2009). LNG was imported by 17 countries on four continents, and before the economic downturn of 2008 plans envisaged more than 300 LNG vessels by 2010 with the total capacity of about 250 Mt/year as the global LNG trade has moved toward a competitive market. LNG trade has been finally elevated from a marginal endeavor to an important component of global energy supply, and this has become true in terms of total exports (approaching 30% of all natural gas sold abroad) and number of countries involved (now more than 30 exporters and importers

This brief recounting of LNG history is an excellent illustration of the decades-long spans that are often required to convert theoretical concepts into technical possibilities and then to adapt these technical advances and diffuse them to create new energy industries (Figure 1.4). Theoretical foundations of the liquefaction of gases were laid down more than a century before the first commercial application; the key patent that turned the idea of liquefaction into a commonly used industrial process was granted in 1895, but at that time natural gas was a marginal fuel even in the United States (in 1900 it provided about 3.5% of the country’s fossil fuel energy), and in global terms it had remained one until the 1960s, when its cleanliness and flexibility began to justify high price of its shipborne imports.

If we take the years between 1999 (when worldwide LNG exports surpassed 5% of all natural gas sales) and 2007 (when the number of countries exporting and importing LNG surpassed 30, or more than 15% of all nations) as the onset of LNG’s global importance, then it had taken about four decades to reach that point from the time of the first commercial shipment (1964), about five decades from the time that natural gas began to provide more than 10% of all fossil energies (during the early 1950s), more than a century since we acquired the technical means to liquefy large volumes of gases (by the mid- 1890s)-and about 150 years since the discovery of the principle of gas liquefaction. By 2007 it appeared that nothing could stop an emergence of a very substantial global LNG market. But then a sudden supply overhang that was created in 2008-and that was due to the combination of rapid capacity increases, lower demand caused by the global financial crisis, and the retreat of U.S. imports due to increased domestic output of unconventional gas-has, once again, slowed down global LNG prospects, and it may take years before the future course will become clear. In any case, the history of LNG remains a perfect example of the complexities and vagaries inherent in major energy transitions.

Coal

There have been some indications that the world’s coal resources may be significantly less abundant than the widespread impressions would indicate (Rutledge, 2008).

The genesis of the growing British reliance on coal offers some valuable generic lessons. Thanks to Nef’s (1932) influential work a national wood crisis has been commonly seen as the key reason for the expansion of coal mining between 1550 and 1680-but other historians could not support this claim, pointing to the persistence of large wooded areas in the country, seeing such shortages as largely local and criticizing unwarranted generalization based on the worst-case urban situations (Coleman, 1977). This was undoubtedly true, but not entirely relevant, as transportation constraints would not allow the emergence of a national fuelwood market, and local and regional wood scarcities were real.

In 1900 the worldwide extraction of bituminous coals and lignites added up to about 800 Mt; a century later it was about 4.5 Gt, a roughly 5.6-fold increase in mass terms and (because of the declining energy density of extracted coal) almost exactly four-fold increase in energy terms.

Meanwhile another major change took place, as the USSR, the world’s largest oil producer since 1975, dissolved, and the aggregate oil extraction of its former states declined by nearly a third between 1991 and 1996, making Saudi Arabia a new leader starting in 1993.

Natural gas is actually a mixture of light combustible hydrocarbons, with methane dominant but with up to a fifth of the volume made up of ethane, propane, and butane;

And, not to forget recently fashionable talk of carbon sequestration and storage, retaining the industry’s coal base but hiding its CO2 emissions underground would require putting in place a new massive industry whose mass-handling capacity would have to rival that of the world’s oil industry even if the controls were limited to a fraction of the generated gas.

Because coal’s declining relative importance was accompanied by a steady increase in its absolute production-from about 700 Mt of bituminous coals (including a small share of anthracite) and 70 Mt of lignites in 1900 to more than 3.6 Gt of bituminous coals and nearly 900 Mt of lignites in the year 2000, or a nearly 6-fold increase in mass terms and a more than 4-fold multiple in energy terms, coal ended up indisputably as the century’s most important fuel. Biofuels still supplied about 20% of the world’s fuel energy during the twentieth century, coal accounted for about 37%, oil for 27%, and natural gas for about 15%. Looking just at the shares of the three fossil fuels, coal supplied about 43%, crude oil 34%, and natural gas 20%. This indubitable conclusion runs, once again, against a commonly held, but mistaken, belief that the twentieth century was the oil era that followed the coal era of the nineteenth century.

Coal replacing biofuels reached the 5% mark around 1840, it captured 10% of the global market by 1855, 15% by 1865, 20% by 1870, 25% by 1875, 33% by 1885, 40% by 1895 and 50% by 1900. The sequence of years for these milestones was thus 15-25-30-35-45-55-60.

With China’s coal shares at nearly 73% in 1980 and at 70% in 2008 it is obvious that during the three decades of rapid modernization there was only the tardiest of transitions from solid fuel to hydrocarbons. China’s extraordinary dependence on coal means that the country now accounts for more than 40% of the world extraction, and that the mass it produces annually is larger than the aggregate output of the United States, India, Australia, Russia, Indonesia, and Germany, the world’s second- to seventh-largest coal producers. No other major economy, in fact no other country, is as dependent on coal as China: The fuel has also recently accounted for 95% of all fossil fuels used to produce electricity and as the thermal generation supplies nearly 80% of China’s total generation it is the source of more than 70% of electric power. China was self-sufficient

Nuclear power

Besides France, the countries with the highest nuclear electricity share (setting aside Lithuania, which inherited a large Soviet nuclear plant at Ingalina that gave it a 70% nuclear share) are Belgium and the Slovak Republic (about 55%), Sweden (about 45%), and Switzerland (about 40%); Japan’s share was 29%, the United States’ 19%, Russia’s 16%, India’s 3%, and China’s 2% (IAEA, 2009).

Saudi Arabian oil and gas

The high mean of the Saudi per capita energy consumption is misleading because a large part of the overall energy demand is claimed by the oil and gas industry itself and because it also includes substantial amounts of bunker fuel for oil tankers exporting the Saudi oil and refined products. Average energy use by households remains considerably lower than in the richest EU countries.

Even more importantly, Saudi Arabia’s high energy consumption has not yet translated into a commensurately high quality of life: Infant mortality remains relatively high and the status of women is notoriously low. As a result, the country has one of the world’s largest differences in the ranking between per capita GDP and the Human Development Index (UNDP, 2009). In this it is a typical Muslim society: In recent years 20 out of 24 Muslim countries in North Africa and the Middle East ranked higher in their GDP per capita than in their HDI-and in 2007/2008 the index difference for Saudi Arabia was -19 while for Kuwait and Bahrain it was -8 and for Iran it was -23.

Renewable Energy

There are nine major kinds of renewable energies: solar radiation; its six transformations as running water (hydro energy), wind, wind-generated ocean waves, ocean currents, thermal differences between the ocean’s surface and deep waters, and photosynthesis (primary production); geothermal energy and tidal energy complete the list.

As with fossil fuels, it is imperative to distinguish between renewable resources (aggregates of available fluxes) and reserves, their smaller (or very small) portions that are economically recoverable with existing extraction or conversion techniques. This key distinction applies as much to wind or waste cellulosic biomass as it does to crude oil or uranium, and that is why the often-cited enormous flows of renewable resources give no obvious indication as to the shares that can be realistically exploited.

Reviewing the potentially usable maxima of renewable energy flows shows a sobering reality. First, direct solar radiation is the only form of renewable energy whose total terrestrial flux far surpasses not only today’s demand for fossil fuels but also any level of global energy demand realistically imaginable during the twenty-first century (and far beyond). Second, only an extraordinarily high rate of wind energy capture (that may be environmentally undesirable and technically problematic) could provide a significant share of overall future energy demand. Third, for all other renewable energies maxima available for commercial harnessing fall far short of today’s fossil fuel flux, one order of magnitude in the case of hydro energy, biomass energy, ocean waves, and geothermal energy, two orders of magnitude for tides, and four orders of magnitude for ocean currents and ocean thermal differences.

Many regions (including the Mediterranean, Eastern Europe, large parts of Russia, Central Asia, Latin America, and Central Africa) have relatively low wind-generation potential (Archer & Jacobson, 2005); high geothermal gradients are concentrated along the ridges of major tectonic plates, above all along the Pacific Rim; and tidal power is dissipated mainly along straight coasts (unsuitable for tidal dams) and in regions with minor (<1 m) tidal ranges (Smil, 2008).

As already explained (in chapter 1), even ordinary bituminous coal contains 30-50% more energy than air-dry wood, while the best hard coals are nearly twice as energy-dense as wood and liquid fuels refined from crude oil have nearly three times higher energy density than air-dry phytomass. A biomass-burning power plant would need a mass of fuel 30-50% larger than a coal-fired station of the same capacity. Similarly, ethanol fermented from crop carbohydrates has an energy density of 24 MJ/L, 30% less than gasoline (and biodiesel has an energy density about 12% lower than diesel fuel).

But lower energy density of non-fossil fuels is a relatively small inconvenience compared to inherently lower power densities of converting renewable energy flows into mass-produced commercial fuels or into electricity at GW scales. Power density is the rate of flow of energy per unit of land area. The measure is applicable to natural phenomena as well as to anthropogenic processes, and it can be used in revealing ways to compare the spatial requirements of energy harnessing (extraction, capture, conversion) with the levels of energy consumption. In order to maximize the measure’s utility and to make comparisons of diverse sources, conversions, and uses my numerator is always in watts and the denominator is always a square meter of the Earth’s horizontal area (W/mz). Others have used power density to express the rate of energy flow across a vertical working surface of a converter, most often across the plane of a wind turbine’s rotation (the circle swept by the blades).

Power densities of hydro generation are thus broadly comparable to those of wind-driven generation, both having mostly magnitude of 10° W/m2 and exceptional ratings in the lower range of 101 W/m2.

Hydroelectricity will make important new contributions to the supply of renewable energy only in the modernizing countries of Asia, Africa, and Latin America. Because of their often relatively large reservoirs, smaller stations have power densities less than 1 W/mz; for stations with installed capacities of 0.5-1 GWthe densities go up to about 1.5 W/m2; the average power density for the world’s largest dams (>1 GW) is over 3 W/m2; the largest U.S. hydro station (Grand Coulee on the Columbia) rates nearly 20 W/m2; and the world’s largest project (Three Gorges station on the Chang Jiang) comes close to 30 W/m2 (Smil, 2008).

Typical power densities of phytomass fuels (or fuels derived by conversion of phytomass, including charcoal or ethanol) are even lower. Fast-growing willows, poplars, eucalypti, leucaenas, or pines grown in intensively managed (fertilized and if need be irrigated) plantations yield as little as 0.1 W/m2 in arid and northern climates but up to 1 W/m2 in the best temperate stands, with typical good harvests (about 10 t/ha) prorating to around 0.5 W/m2 (Figure 4.1). Crops that are best at converting solar radiation into new biomass (C4 plants) can have, when grown under optimum natural conditions and supplied by adequate water and nutrients, very high yields: National averages are now above 9 t/ha for U.S. corn and nearly 77 t/ha for Brazilian sugar cane (FAO, 2009). But even when converted with high fermentation efficiency, ethanol production from Iowa corn yields only about 0.25 W/m2 and from Brazilian sugar cane about 0.45 W/m2 (Bresnan & Contini, 2007).

The direct combustion of phytomass would yield the highest amount of useful energy.

Conversion of phytomass to electricity at large stations located near major plantations or the production of liquid or gaseous fuel: Such conversions would obviously lower the overall power density of the phytomass- based energy system (mostly to less than 0.3 W/m2), require even larger areas of woody plantations, and necessitate major extensions of high-voltage transmission lines, and hence further enlarge overall land claims. Moreover, as the greatest opportunities for large-scale cultivation of trees for energy are available only in parts of Latin America, Africa, and Asia, any massive phytomass cultivation would also require voluminous (and energy-intensive) long-distance exports to major consuming regions.

And even if future bioengineered trees could be grown with admirably higher power densities (say, 2 W/m2), their cultivation would run into obvious nutrient constraints. Non-leguminous trees producing dry phytomass at 15 t/ha would require annual nitrogen inputs on the order of 100 kg/ha during 10 years of their maturation. Extending such plantations to slightly more than half of today’s global cropland would require as much nitrogen as is now applied annually to all food and feed crops-but the wood harvest would supply only about half of the energy that we now extract in fossil fuels. Other major environmental concerns include accelerated soil erosion (particularly before the canopies of many row plantations of fast-growing trees would close) and availability of adequate water supplies (Berndes, 2002).

Average insolation densities of 102 W/m2 mean that even with today’s relatively low-efficiency PV conversions (the best rates in everyday operation are still below 20%) we can produce electricity with power densities of around 30 W/m2, and if today’s best experimental designs (multifunction concentrators with efficiency of about 40%) become commercial realities we could see PV generation power densities averaging more than 60 W/m2 and surpassing 400 W/m2 during the peak insolation hours. As impressive as that would be, fossil fuels are extracted in mines and hydrocarbons fields with power densities of 103-104 W/m2 (i.e., 1-10 kW/m2), and the rates for thermal electricity generation are similar (see Figure 4.1). Even after including all other transportation, processing, conversion, transmission, and distribution needs, power densities for the typical provision of coals, hydrocarbons, and thermal electricity generated by their combustion are lowered to no less than 102 W/m2, most commonly to the range of 250-500 W/m2. These typical power densities of fossil fuel energy systems are two to three orders of magnitude higher than the power densities of wind- or water-driven electricity generation and biomass cultivation and conversion, and an order of magnitude higher than today’s best photovoltaic conversions.

I have calculated that in the early years of the twenty-first century no more than 30,000 km2 were taken up by the extraction, processing, and transportation of fossil fuels and by generation and transmission of thermal electricity (Smil, 2008). Spatial claim of the world’s fossil fuel infrastructure is thus equal to the area of Belgium (or, even if the actual figure is up to 40% larger, to the area of Denmark). But if renewable energy sources were to satisfy significant shares (15-30%) of national demand for fuel and electricity, then their low power densities would translate into very large space requirements-and they would add up to unrealistically large land claims if they were to supply major shares of the global energy need.

At the same time, energy is consumed in modern urban and industrial areas at increasingly higher power densities, ranging from less than 10 W/m2 in sprawling cities in low-income countries (including their transportation networks) to 50-150 W/m2 in densely packed high-income metropolitan areas and to more than 500 W/m2 in downtowns of large northern cities during winter (Smil, 2008). Industrial facilities, above all steel mills and refineries, have power densities in excess of 500 W/m2 even prorated over their entire fence area-and high-rise buildings that will house an increasing share of humanity in the twenty-first century megacities go easily above 1,000 W/m2. This mismatch between the inherently low power densities of renewable energy flows and relatively high power densities of modern final energy uses (Figure 4.2) means that a solar-based system will require a profound spatial restructuring with major environmental and socioeconomic consequences.

In order to energize the existing residential, industrial, and transportation infrastructures inherited from the fossil-fuel era, a solar-based society would have to concentrate diffuse flows to bridge power density gaps of two to three orders of magnitude. Mass adoption of renewable energies would thus necessitate a fundamental reshaping of modern energy infrastructures, from a system dominated by global diffusion of concentrated energies from a relatively limited number of nodes extracting fuels with very high power densities to a system that would collect fuels of low energy density at low power densities over extensive areas and concentrate them in the increasingly more populous consumption centers.

Yang (2010) uses the history of solar hot water systems to argue that even at that point the diffusion of decentralized rooftop PV installations may be relatively slow. Solar hot water systems have been cost-effective (saving electricity at a cost well below grid parity) in sunny regions for decades, and with nearly 130 GW installed worldwide they are clearly also a mature innovation-and yet less than 1% of all U.S. households have chosen to install them (Davidson, 2005). The

Even the best conversions in research laboratories have required 15-20 years to double their efficiency and that another doubling for multi-junction and monocrystalline cells is highly unlikely.

Silicon analogy of Moore’s law does not apply to renewable energy

Fundamental physical and biochemical limits restrict the performance of other renewable energy conversions, be it the maximum yield of crops grown for fuel or woody biomass or the power to be harnessed from waves or tides: These limits will assert themselves after only relatively modest improvements of today’s performance and hence no strings of successive performance doublings are ahead.

Production of microprocessors is a costly activity, with the fabrication facilities costing at least $2-3 (and future ones up to $10) billion. But given the entirely automated nature of the production process (with microprocessors used to design more advanced fabrication facilities) and a massive annual output of these factories, the entire world can be served by only a small number of chip-making facilities. Intel, whose share of the global microprocessor market remains close to 80%, has only 15 operating silicon wafer fabrication facilities in nine locations around the world, and two new units under construction (Intel, 2009), and worldwide there are only about 300 plants making high-grade silicon. Such an infrastructural sparsity is the very opposite of the situation prevailing in energy production, delivery, and consumption.

Could anybody expect that the Chinese will suddenly terminate this brand-new investment and turn to costlier methods of electricity generation that remain relatively unproven and that are not readily available at GW scale? In global terms, could we expect that the world will simply walk away from fossil and nuclear energy infrastructures whose replacement cost is worth at least $15-20 trillion before these investments will be paid for and produce rewarding returns? Negative answers to these questions are obvious. But the infrastructural argument cuts forward as well because new large-scale infrastructures must be put in place before any new modes of electricity generation or new methods of producing and distributing biofuels can begin to make a major difference in modern high-energy economies. Given the scale of national and global energy demand (for large countries 1011 W, globally nearly 15 TW in 2010, likely around 20 TW by 2025) and the cost and complexity of the requisite new infrastructures, there can be no advances in the structure and function of energy systems that are even remotely analogical to Moore’s progression of transistor packing.

After an energy crisis, government leaders vow to do something.  Substitution goals are made, but not usually adhered to. “Robust optimism, naïve expectations, and a remarkable unwillingness to err on the side of caution is a common theme for most of these goals.

There have been many assumptions in the past of a rapid and smooth transition to renewable energy, especially after the first two energy crises of 1973-4 and 1979-81.  Here are just a few failed forecasts:

  • 1977 InterTechnology Corporation said by 2000 solar energy could provide 36% of U.S. industrial process heat
  • 1980 Sorensen though by 2005 renewable energy would provide 49% of U.S. power
  • Amory Lovin forecast over 30% renewables by 2000, in reality it was 7% with biogas supplying less than .001%, wind 0.04%, solar PV less than 0.1% and no use of solar energy for industrial heat supply.

Sweden

  • 1978: Sweden planned to get half its energy from tree plantations by 2015 that would cover 6 to 7% of their nation. Reedlands would be converted to pelleted phytomass.
  • 1991: Sweden dreams again of biomass energy from massive willow plantations covering 400,000 hectares by 2020 harvested 4 to 6 years after planting and every 3.5 years thereafter for 20 years to provide district heating and CHP power generation
  • 1996 planting ended at about 10% of the goal, and 40% of farmers stopped growing them.
  • 2008 all burnable renewable and waste biomass (mainly wood) provided less than 2% of primary energy.

Given this history of [failed] attempts at renewables are today’s forecasts of anticipated, planned, or mandated shares of renewable energies as unrealistic as those three decades ago?  Jefferson (2008) thinks so because “targets are usually too short term and clearly unrealistic…subsidy systems often promote renewable energy schemes that are misdirected and buoyed up by grossly exaggerated claims. One or two mature energy technologies are pushed nationally with insufficient regard for the costs, contribution to electricity generation, or transportation fuels’ needs”.

Al Gore believes the three main challenges of the economy, environment, and national security are all due to our “over-reliance on carbon-based fuels,” which could easily be fixed in 10 years by switching to solar, wind and geothermal.  He was confident this was true because as demand for renewable energy grew, the cost of it would fall, and used the Silicon Valley fallacy of technology doubling.

On average 15 GW/year of generating capacity were added every 20 years from 1987 and 2007. To make a transition to renewables 150 GW would needed to be added a year, and the longer the wait to do this the more needs to be added later on, perhaps 200 to 250 GW or 20 times as much as the record rate of 2008 (8.5 GW added wind capacity).  This “should suffice to demonstrate the impossibility of” doing so. On top of that this “impossible feat would also require writing off in a decade the entire fossil-fueled electricity generation industry and the associated production and transportation infrastructure, an enterprise whose replacement value is at least $2 trillion”.

The wind would have to come from the Great Plains and the solar from the Southwest, yet no major HV transmission lines link to East and West coast load centers.  So before you could build millions of wind turbines and solar PV panels, you’d need to rewire the United States first with high-capacity, long-distance transmission links, at least another 65,000 km (40,000 miles) in addition to the existing 265,000 km (165,000 miles) of HV lines.  These lines are at least $2 million/km.

“Installing in 10 years wind- and solar-generating capacity more than twice as large as that of all fossil-fueled stations operating today while concurrently incurring write-off and building costs on the order of $4-5 trillion and reducing regulatory of approval of generation and transmission megaprojects from many years to mere months would be neigher achievable nor affordable at the best of times: At a time when the nation has been adding to its massive national debt at a rate approaching $2 trillion a year, it is nothing but a grand delusion.”

Smil points out that promoters of grand plans greatly exaggerate the capacity factor of wind and solar.  Google plan, Clean Energy 2030, assumed wind and solar capacities of 35% each.  The reality in the European Union between 2003 and 2007 was that the average load factor for wind power was just 20.8%.  Even Arizona had a solar PV capacity factor average less than 25%.

There’s no way even cheaper-than-oil electricity generation in less sunny climates could displace fossil fuels without visionary mega-transmission lines between Algerian Sahara to Europe or from Arizona to the Atlantic coast.

It could take decades of cumulative experience to understand the risks and benefits of large-scale renewable systems and quantify the probability of catastrophic failures and the true lifetime costs.  We need decades of operating experience in a wide range of conditions.

As far as ethanol and biodiesel go, production has depended on very large and very questionable subsidies (Steenblik 2007).  Cellulosic fuels have yet to reach large-scale commercial production (and still haven’t in 2016).  Therefore “they should not be seen as imminent and reliable providers of alternative fuels”.

One of the biggest problems renewable energy enthusiasts don’t recognize is the challenge of converting the 100 year old existing system with centrally produced power from extremely high power density fuels to one with very low power density flows use in high power density urban areas. Decentralized power is fine for a farm or small town, but impossible for large cities that already house more than half of humanity, or megacities like Tokyo.

Renewable enthusiasts especially don’t understand the challenge of replacing fossil fuels required for key industrial feedstocks.  Coke made from coal has unique properties that make it the best way to smelt iron from oreCharcoal made from wood is too fragile to use in the enormous blast furnaces we have today.   If you tried to use wood charcoal to continue to match the coke-fired pig iron smelting of 900 Mt/year, you’d need about 3.5 Gt of dry wood from 350 Mha, the size of two-thirds of Brazil’s forest.  Nor do we have any plant-based substitutes for hydrocarbon feedstocks used to make plastics or synthesizing ammonia (production of fertilizer ammonia requires over 100 Gm3 a year).

Monetary cost.  All claims of price parity with oil and other fossil fuels depend on many assumptions whose true details are often impossible to ascertain, on uncertain choices of amortization periods and discount rates, and all of them are contaminated by past, present, and expected tax breaks, government subsidies, and simplistic, mechanistic assumptions about the future decline of unit costs. One might think that repeated cost overruns and chronically unmet forecasts of capital or operating costs should have had some effect, but they have done little to stop the recitals of new dubious numbers.

The fact that innovations require government support raises questions about the continuity of policies under different governments, or continuation of expensive projects when the economy is bad.

Given how long past transitions took surely a transition from fossil fuels will take generations.  And since the inertia of existing massive and expensive energy infrastructures and the transportation system can’t be replaced overnight, there will surely be a large component dependent on fossil fuels for many decades.   Indeed the transition will likely take much longer than past transitions, because renewables require a much larger physical area than fossil fuels and producing much less energy dense power, while past transitions added increasingly dense high power coal and oil to the energy mix, and yet these transitions took decades as well.

The list of seriously espoused energy “solutions” has run from that of nuclear fusion to an irrepressible (and always commencing in a decade or so) hydrogen economy, and its prominent entries have included everything from liquid metal fast breeder reactors to squeezing 5% of oil from the Rocky Mountain shales.”  And now the renewable list consists of “solutions” such as enormous numbers of bobbing wave converters, flexible PV films surrounding homes, enormous solar panels in orbit, algae disgorging high-octane gasoline, and harnessing jet stream wind with kits 12 km overhead.

“Ours is an overwhelmingly fossil-fueled society, our way of life has been largely created by the combustion of photosynthetically converted and fossilized sunlight—and there can no doubt that the transition to fossil fuels…led to a world where more people enjoy a higher quality of life than at any time in previous history. This grand solar subsidy, this still-intensifying depletion of an energy stock whose beginnings go back hundreds of millions of years, cannot last.”


Posted in Alternative Energy, Energy Books, Vaclav Smil | Tagged , , , , , , , , , , , | 13 Comments

Rex Weyler on “what to do” about limits to growth, peak energy

Preface. Professor Nate Hagens is teaching a class at the University of Minnesota about the state of the world that may be expanded to all incoming freshmen.  Many despair when they learn about limits to growth and finite fossil fuels.  So Rex Weyler came up with a list of “what to do actions” they could take.  It’s one of the best lists I’ve seen.

Alice Friedemann   www.energyskeptic.com  author of “When Trucks Stop Running: Energy and the Future of Transportation”, 2015, Springer and “Crunch! Whole Grain Artisan Chips and Crackers”. Podcasts:  KunstlerCast 253, KunstlerCast278, Peak Prosperity]

***

   I. Linear vs. Complex: “What do I do?” generally seeks a linear answer to a complex living system polylemma. “What do I do?” wants a “solution” for a “problem.” This is linear, mechanistic, engineering thinking at its worst, the type of thinking that contributes to our challenge, but we’re stuck with it in popular culture, so yes, we need an answer. This first part of the answer (changing complex systems is NOT going to be a linear and mechanistic “solution”) is probably too confusing for most people, so could be skipped over. However, your students should be aware of this.

  II. There is lots to do, which your students should be taught.

  1. Find ways to help reduce human population

  • with women’s rights
  • start a campaign to achieve universally available contraception

  2. Find ways to help reduce consumption

  •       start a campaign to reduce frivolous travel, entertainment, fashions, etc. purchased by the rich
  •       do this with heavy tax incentives

  3. reduce meat consumption .. tax and popularization

  4. limit corporate power in politics

  5. publicly fund universities, all education, to limit corporate corruption of education

  6. localize food production, home gardens, community gardens

  7. popularize modest lifestyles in wealthy countries

  8. support and preserve modest lifestyles among indigenous and farmer communities

  9. Learn how complex living systems actually work

10. Spend as much time in wild nature as possible, pay attention, observe, take notes, think about it

11. Plant a garden and pay attention to what it takes to help useful, nutritious plants grow

12. Open a clinic and begin to research localized, small-scale health care

13. Educate yourself about wild nature, evolution, and complexity:

  • read Gregory Bateson, Howard Odum, Gail Tverberg ..
  • Read “The Collapse of Complex Societies by Joseph Tainter
  • Read Arne Naess, Chellis Glendinning, David Abram, and Paul Shepard
  • Read “Small Arcs of Larger Circles” by Nora Bateson

14. Think about what it means to stop looking for a Silver Bullet Tech “Solution” — linear, engineered, mechanistic, profitable, BAU, socially popular “solution”  — and start thinking about where and how change actually occurs in a complex living system.

15. Learn about the errors of modern, neo-liberal economics, and learn about other ways to approach economics. Read: N. Georgescu-Roegen, Frederick Soddy, Gail again, Herman Daly, Donella Meadows, Mark Anielski.

16. Start a Campaign to create and institute a new economic system in your community, your state, your county, your nation, your company, your family.

17. Find a spiritual practice that helps you calm down and see the world with more compassion and patience, and that helps you appreciate the more-than-human world.

18. Localize:

  • Start a company that uses local resources and local skills to create useful locally consumed tools
  • Start that local, community health clinic
  • Lobby your government to create community gardens
  • Study and create energy systems that can be built, operated, and maintained locally
  • Campaign to consume only locally produced products.

19. Start an economic De-Growth group, Décroissance

20. Start a school for the homeless and disenfranchised, and teach localized, useful skills, gardening.

21. Take in a homeless foster child; give them some love and security

22. Read Vaclav Smil, Bill Rees, and Charles Hall

24. Start a psychology practice and begin to learn and support community therapy; build community cohesion

25. Read Wendell Berry: “Solving for Pattern” and “Gift of Good Land.”

26. Start a campaign for all shoppers to reduce consumption, and leave ALL PACKAGING at the stores.

27. Start a free store in your community, help recycle, repair, and circulate everything

28. Are you a lawyer, or do you want to be? Start a practice to defend Ecology activists, and start class action lawsuits against corporations that pollute.

29. Read Rachel Carson, Basho, Li Po, William Blake, Mary Oliver, Denise Levertov, Gary Snyder, Susan Griffin, Nanao Sakaki, Diane di Prima, Walt Whitman. Go to art galleries. Contemplate the connection between creative artistic expression and change in a complex system.

30. See if you can fall in love with something that’s not human. See if you can fall in love with wild nature.

Several people participated in this discussion, a professor added “if they really want to move things along, they must become politically engaged at every level–ask the embarrassing questions at all-candidates meetings, write your representatives, push for policies that will make a difference and protest official idiocy wherever it occurs. And if this fails, civil disobedience will not be far behind.”

These are 30 things your students can DO!

Take your pick. They all count. Teach them. Discuss them. Add to the list. 

There is NO SILVER BULLET TECH SOLUTION that is going to allow us to continue living this endless growth, high consumption, expanding population, fossil-fueled, wasteful, arrogant, human-centered, presumptuous life .. so GET OVER IT. 

Don’t be bullied by the popular hope that there is a magic way to engineer ourselves out of overshoot.

Get creative.

Get local. 

Let go of “changing the world” with human cleverness 

Accept that “the world” is a complex living system, made from complex living subsystems out of your control. 

Find the light inside and share it with the world. 

Avoid whining “What should I do?” by staying active with activities that will matter in the long run.

Posted in What to do | Tagged , , | 8 Comments

Fresh water depletion, contamination, saltwater intrusion, & subsidence

Map of the U.S. showing cumulative groundwater depletion from 1900 through 2008 in 40 aquifers. Source: Groundwater Depletion in the United States (1900-2008), USGS Scientific Investigations Report 2013-5079.

Preface.  This isn’t mentioned in the subsidence paper below, but half of USA refineries are in the southeast, where the threat of subsidence is greatest, and since subsidence means more floods and storm surges, this may put them out of operation more often for longer periods of time.  Also affected will be electric power plants, hazardous waste sites, roads, bridges and other infrastructure as well, plus the potential for tens of thousands of acres of farmland eroded or ruined by saltwater from above or intrusion into aquifers below.

The second paper below discusses subsidence as well as the depletion of the aquifers in the United States that grow half of America’s crops.

Alice Friedemann  www.energyskeptic.com  Author of Life After Fossil Fuels: A Reality Check on Alternative Energy; When Trucks Stop Running: Energy and the Future of Transportation”, Barriers to Making Algal Biofuels, & “Crunch! Whole Grain Artisan Chips and Crackers”.  Women in ecology  Podcasts: WGBH, Jore, Planet: Critical, Crazy Town, Collapse Chronicles, Derrick Jensen, Practical Prepping, Kunstler 253 &278, Peak Prosperity,  Index of best energyskeptic posts

***

Herrera-Garcia G et al (2021) Mapping the global threat of land subsidence Nineteen percent of the global population may face a high probability of subsidence. Science 371: 34-36

During this century, climate change will cause serious impacts on the world’s water resources through sea-level rise, more frequent and severe floods and droughts, changes in the mean value and mode of precipitation (rain versus snow), and increased evapotranspiration. Prolonged droughts will decrease groundwater recharge and increase groundwater depletion, intensifying subsidence.

Subsidence permanently reduces aquifer-system storage capacity, causes earth fissures, damages buildings and civil infrastructure, and increases flood susceptibility and risk. During the next decades, global population and economic growth will continue to increase groundwater demand and accompanying groundwater depletion and, when exacerbated by droughts, will probably increase land subsidence occurrence and related damages or impacts.

Subsidence permanently reduces aquifer-system storage capacity, causes earth fissures, damages buildings and civil infrastructure, and increases flood susceptibility and risk.

Our results suggest that potential subsidence threatens 4.6 million square miles or 12 million km2 (8%) of the global land surface with a probability greater than 50%.

Our results identify 1596 major cities, or about 22% of the world’s 7343 major cities that are in potential subsidence areas, with 57% of these cities also located in flood-prone areas. Moreover, subsidence threatens 15 of the 20 major coastal cities ranked with the highest flood risk worldwide, where potential subsidence can help delimit areas in which flooding risk could be increased and mitigation measures are necessary.

Ayre, J. April 2018. Fossil Water Depletion, Groundwater Contamination, Saltwater Intrusion, & Permanent Subsidence — The Great Freshwater Depletion Event Now Underway. CleanTechnica.

Much of the modern world’s agricultural productivity, industrial activity, and high degree of urbanization is dependent upon the pumping and exploitation of limited freshwater resources. In some regions the water that is being relied upon is so-called fossil water — that is, water that was deposited many millennia ago and is mostly not being replenished for whatever reasons, such as lack of rainfall or impermeable geologic layers like heavy clay or calcrete laid on top.

As these fossil water reserves are depleted, there is often nothing to replace them (the one notable exception being the possibility of desalination in some regions), with the eventuality often being large populations, industrial infrastructure, and farmland that is untenable in the regions in question, to be followed by mass migrations out of such regions.

Particularly notable regions that are dependent upon fossil water are the American Great Plains (the Ogallala Aquifer), northeastern Africa (the Nubian Sandstone Aquifer System), and central-southern Africa (the Kalahari Desert fossil aquifers).

The situation as regards to fossil water depletion in some regions is compounded by extensive development (and paving over) of aquifer-recharge areas in regions where rainfall is otherwise sufficient to replenish aquifers, and further so simply by unsustainable usage rates which draw down reserves.

As groundwater in regions with the possibility of recharge is pumped at unsustainable rates, though, what generally also occurs is ground subsidence. In plain language, the ground sinks due to the lack of support previously provided by groundwater that is no longer there. Subsidence in this context is notable because it leaves the ground and aquifer in question far less capable of storing water, due to compaction. In other words, excess groundwater pumping permanently removes the ability of many aquifers to store water, leaving total aquifer capacity far lower than previously, and thus contributing to the drying out of the region in question.

Going back to the issue of over-paving watersheds that have been developed, another issue that follows from this is the eventuality of large flood events (due to the lack of open ground-space to run down into), and thus further soil erosion which itself leaves the land in question less capable of holding and retaining water/moisture.

All of these above issues are themselves further compounded by saltwater intrusion in coastal regions due to the pumping of groundwater creating a vacuum-effect that draws nearby saltwater into the aquifers, and also due to ground subsidence, general sea level rise, and groundwater contamination in many regions, which is often the direct result of the industrial and agricultural activities that are themselves drawing the most water.

So what we have in the modern world, when we take a step back, is the convergence of growing problems of: fossil water depletion; the destruction of the ability of many aquifers to retain water due to over-pumping as the result of ground subsidence; saltwater intrusion of aquifers caused by over-pumping and sea level rise; widespread groundwater contamination due to industrial and agricultural activities; and ever growing population numbers and food/agricultural needs.

With that in mind, the following is a basic overview of where things stand on different issues.

First, here are a couple of basic facts:

  • More than 4 billion people around the world already experience extreme water scarcity at least 1 month every year.
  • More than 500 million people around the world already experience extreme water scarcity essentially year-round. This number is expected to increase significantly over the coming decades.
  • Well over half of the largest cities around the world now experience water scarcity occasionally.
  • Fresh-water demand is estimated to exceed demand by at least ~40% by 2030.
  • Deforestation and accompanying aridification and/or desertification are primary drivers of water scarcity in some regions due to decreasing atmospheric moisture and thus rainfall levels. This is largely driven by consumer demand for cheap meat and livestock-feed on the one hand, and by demand for timber products on the other. Other water-intensive crops play a part as well though, like cotton and various types of oil/tree-nut/fruit crops for instance.
  • With “higher” standards of living, water use increases exponentially as people switch from a low-resource lifestyle to one of profligate use and waste. People in the wealthier countries of the world are known to use 10-50 times more fresh-water on an annual basis than those in the poorest.
  • Over just the last century, more than half of the world’s wetlands and watersheds have been destroyed and no longer exist in any capacity. Unsurprisingly, this has resulted in the loss of a very large amount of biodiversity, and also of numerous fisheries. In the US and Europe the loss of historic wetlands over the last century is in the 80-95% range.
  • A large majority of the groundwater now being pumped up from aquifers is being used by agriculture and industry.
  • Many of the largest rivers of Asia could effectively be gone by as soon as the end of the century due to the current rapid melting of associated glaciers.

Overpumping, Ground Subsidence, & Saltwater Intrusion

The overpumping of freshwater from aquifers, as noted previously, is a direct cause of ground subsidence and saltwater intrusion in coastal areas. What wasn’t stated previously is that as aquifer levels are drawn down, the quality of the water being pumped is generally being lowered, with rising levels of salinity (via ground salts), and also rising levels of grit and contaminants also being observed.

Something else to note on that count is that as aquifers are diminished, the natural outflows of the region — springs, etc. — experience much reduced outflows, or simply cease to exist.

In relation to this, the aforementioned experience of ground subsidence results in sinking land, which increases the danger of flood events in addition to reducing the capacity of the aquifer in question to hold water. It’s notable, for instance, that in some of the land surrounding Houston, Texas, ground levels have dropped by as much as 9 feet in recent decades due to extensive groundwater pumping.

Despite all of this, resistance to a reduction in pumping rates is often high, with those involved in agriculture in particular often fighting hard to stop the imposition of such an approach.

Accompanying ground subsidence in coastal regions is often saltwater intrusion into the aquifers being pumped — thereby diminishing the quality of the water, and often demanding costly treatment processes to allow continued potability.

Generally speaking, freshwater pumping in coastal regions allows saltwater to flow further inland than is otherwise the case, as do agricultural drainage systems. Sea level rise itself does as well, of course, as do the storm surges that accompanying powerful storms. This is all especially true in coastal regions where the aquifers are highly porous — in parts of New Jersey and Florida, for instance.

Groundwater Contamination & Pollution

In addition to problems of sheer freshwater unavailability are the fast increasing problems of freshwater contamination. Groundwater contamination has become an increasingly common problem in recent decades as industrial and agricultural productivity levels have been brought to unsustainable levels.

While contamination that ultimately is the result of industrial and agricultural activities is the most common type, increasing urbanization is another, as population-dense regions are often unable to deal effectively with the waste products that result without expensive systems (which some regions can’t afford). Ineffective wastewater treatment facilities, landfills, and fueling stations, for instance, are often sources of groundwater contamination in urban regions. Some regions, it should be noted, feature groundwater with high levels of arsenic or fluoride regardless of human activity, and aquifer reliance in those regions is thus dangerous.

An example of a dangerous but common type of groundwater contaminant deriving from human activities is nitrates, which is generally the result of agricultural activities. Other, more dangerous, compounds are also common groundwater pollutants, including various types of solvents, PAHs, heavy metals, hydrocarbons, pesticides, herbicides, other artificial fertilizers, radioactive compounds, pharmaceuticals and their metabolites, and various types of persistent chemical pollution.

Before closing this section, I suppose that hydraulic fracturing (fracking) as a means of extracting fossil oil and gas reserves deserves a mention. While the practice itself does not inherently need to be a cause of groundwater contamination, in practice it often is due to the reality that it is often pursued carelessly and that e companies involved have a tendency to dissolve when problems arise (with those involved simply starting a new firm afterwords).

Groundwater salinization

Lower groundwater levels can prevent drainage of water and salts from a basin and increase aquifer salinity that eventually renders the groundwater unsuitable for use as drinking water or irrigation without expensive desalination. This is happening in many places. Pauloo (2021) focused on California’s Tulare Lake Basin (TLB), where evaporation is concentrating salts further. The TLB irrigates 4600 square miles (12,000 square kilometers) of crops bringing in $23 billion dollars. The only solution is to add more water than is taken out, not likely now that California is in the worst drought in 1200 years.

Loss Of Glaciers, Climate Change, Rising Temperatures, & Increasing Atmospheric Moisture

Accompanying the depletion and contamination of groundwater freshwater resources, the world’s above-ground freshwater resources — largely glaciers, winter snowpack, and high-altitude lakes — are rapidly disappearing as well in many parts of the world.

While the rapid melting of many glaciers in recent years has led to an increase in water availability in some regions — in particular in the parts of the world that ultimately source their freshwater from glaciers in South and Central Asia (via rivers originating there) — all that this means is that long-term supply is being compromised even faster than would otherwise be the case. As these glaciers disappear, there will be increased water scarcity affecting literally hundreds of millions to billions more people than is currently the case.

Also worth noting here, is that rising temperatures are themselves affecting freshwater supplies by increasing the rate of evaporation in many regions and thereby limiting the amount of surface water and the ability of aquifers to recharge. Accompanying this is the reality that as atmospheric moisture levels rise as a result, temperatures will continue rising even faster due to the reality that water vapor is itself a potent greenhouse gas.

References

Pauloo RA (2021) Anthropogenic basin closure and groundwater salinization (ABCSAL). Journal of Hydrology 593

Posted in Groundwater, Peak Water, Water Infrastructure, Water Pollution | Tagged , , , , , , , | Comments Off on Fresh water depletion, contamination, saltwater intrusion, & subsidence

Why tar sands, a toxic ecosystem-destroying asphalt, can’t fill in for declining conventional oil

This is a book review of Tar Sands: Dirty Oil and the Future of a Continent by Andrew Nikiforuk.

tar-sands-aerial-views tar-sands-aerial-views-2tar-sands-plantsMany “energy experts” have said that a Manhattan tar sands project could prevent oil decline in the future.   But that’s not likely. Here are a few reasons why:

  1. Reaching 5 Mb/d will get increasingly (energy) expensive, because there’s only enough natural gas to mine 29% of tar sands (and limited water as well). Using the energy of the tar sand bitumen itself would greatly reduce the amount that could be produced and dramatically increase the cost and energy to mine it
  2. Since there isn’t enough natural gas, many hope that nuclear reactors will replace natural gas. That would take a lot of time. Kjell Aleklett estimates it would take at least 7 years before a candu nuclear reactor could be built, and the Canadian Parliament estimates it would take 20 nuclear reactors to replace natural gas as a fuel source.
  3. Mined oil sands have been estimated to have an energy returned on invested of EROI of 5.5–6 for mined tar sands (perhaps 10% of the 170 billion barrels), with in situ processing much lower at 3.5–4 (Brandt 2013).  Right now, 90% of the reserves being developed are via higher-EROI mining, yet 80% of remaining oil sands reserves are in situ, so the remaining reserves will be much less profitable
  4. Counting on tar sands to replace declining conventional oil, with an EROI as high as 30 will be hard to accomplish, especially if it turns out to be the case that an EROI of 7 to 14  is required to maintain civilization as we know it (Lambert et al. 2014; Murphy 2011; Mearns 2008; Weissbach et al. 2013)

In a crash program to ramp up production as quickly as possible, production would likely peak in 2040 at 5–5.8 million barrels a day (Mb/d)  (NEB 2013; Soderbergh et al. 2007). Kjell Aleklett estimated that at best a megaproject could get 3.6 Mb/d by 2018.  Even that goal would require Canada to choose between exporting natural gas to the United States or burning most of its reserves in the tar sands to melt bitumen.

So far, Canadian oil sands have contributed to the 5.4 % increase in oil production since 2005, increasing from 0.974 to 2.1 Mb/d in 2014 (2.7 % of world oil production). There are about 170 billion barrels thought to be recoverable, equal to 6 years of world oil consumption.

Already, oil sand production forecasts for 2030 have declined 24 % over the past 3 years, from 5.2 Mb/d in 2013, to 4.8 Mb/d in 2014, to 3.95 Mb/d in June 2015 (CAPP 2015).

At least half the book describes the damage being done that is too long to write about in a book review, and one of the most horrifying accounts of wilderness destruction I’ve ever heard.  But because it’s not a major tourist destination in an area few live in, the expected out-cry of environmentalists is muted and almost non-existent.

If it’s true that future generations are likely to move north as climate change renders vast areas uninhabitable, what a shame that an area the size of New York is well on the way to being such a toxic cesspool of polluted water, land, and radioactive uranium tailings that it may be uninhabitable for centuries if not millennia.   As author Nikiforuk puts it “Reclamation in the tar sands now amounts to little more than putting lipstick on a corpse.”

Much of this book covers the horrifying, sickening destruction of the ecology of a vast region.  You may think you will not be affected, but very close to major rivers, flimsy dams holding back large lakes of toxic sludge are bound to fail at some point and eventually spill out into the arcti. That would damage  the fragile arctic system and the fish you buy in the grocery store potentially unsafe to eat.

I have rearranged and paraphrased some of what follows, as well as quoted the original text.

Alice Friedemann  www.energyskeptic.com  Author of Life After Fossil Fuels: A Reality Check on Alternative Energy; When Trucks Stop Running: Energy and the Future of Transportation”, Barriers to Making Algal Biofuels, & “Crunch! Whole Grain Artisan Chips and Crackers”.  Women in ecology  Podcasts: WGBH, Planet: Critical, Crazy Town, Collapse Chronicles, Derrick Jensen, Practical Prepping, Kunstler 253 &278, Peak Prosperity,  Index of best energyskeptic posts

***

What is arguably the world’s last great oil rush is taking place today.  Alberta has approved nearly 100 mining and in situ projects. That makes the tar sands the largest energy project in the world, bar none.

The size of the resource being exploited has grown exponentially. The 54,000 square mile bitumen-producing zone contains nearly 175 billion barrels in proven reserves, which makes it the single-largest pile of hydrocarbons outside of Saudi Arabia.

But although it’s large, only ten percent is actually recoverable via strip mining, the least energy intensive method. And it’s an energy intensive messy operation – in a load of tar sands, only 10% is bitumen, so the other 90% has to be separated out.  This is done by dumping the sands into a large hot-water “washing machines” where they’re spun around and the bitumen siphoned off.  For every barrel of synthetic crude eventually produced, 4500 pounds of tar sands were dug up, separated, and disposed of. To get the other 90% deep underground takes twice as much energy as the strip-mined tar sands using in-situ steam injected underground, so much that for every three barrels of in-situ oil produced, the energy in one of them was used to get it, though not really, in that natural gas is used currently, 2 billion cubic feet a day, enough to heat all the homes in Canada (Kolbert 2007).

Bitumen is what a desperate civilization mines after it’s depleted its cheap oil. It’s a bottom-of-the-barrel resource, a signal that business as usual in the oil patch has ended. To use a drug analogy, bitumen is the equivalent of scoring heroin cut with sugar, starch, powdered milk, quinine, and strychnine. Calling the world’s dirtiest hydrocarbon “oil” grossly diminishes the resource’s huge environmental footprint. It also distracts North Americans from two stark realities: we are running out of cheap oil, and seventeen million North Americans run their cars on an upgraded version of the smelly adhesive used by Babylonians to cement the Tower of Babel. That ancient megaproject did not end well. Without a disciplined plan for them, the tar sands won’t either.

David Hughes points out that in 1850, 90% of the world traveled by horse and heated with biomass. Now nearly 90% of the world depends on hydrocarbons and consumes 43 times as much energy with 7 times as many people as in 1850.  He questions whether that is really sustainable.  He’s pretty sure people will be upset in the future about squandering so much oil so quickly, since just one barrel of oil equals 8 years of human labor.

Walter Youngquist, author of one of the best books about the history of energy and natural resource use, “Geodestinies”, points out that the tar sands are a valuable long-term resource for Canada which should stretch out their production for as long as possible, as efficiently and sparingly as possible.

Tar sands are limited by natural gas

In 2006, the Oil & Gas Journal noted sadly that Canada had only enough remaining natural gas to recover 29% of the bitumen in the tar sands.

The North American Energy Working Group (NAEWG) reported similar findings that year at a meeting in Houston, Texas. If the tar sands produced five million barrels a day, the group said, oil companies would consume 60 per cent of the natural gas available in Western Canada by 2030. Even the NAEWG found that level of consumption “unsustainable and uneconomical.” As one Albertan recently observed: “Using natural gas to develop oil sands is like using caviar as fertilizer to grow turnips.

Cambridge Energy Research Associates, a highly conservative private energy consultancy, confirmed the cannibalistic character of natural gas consumption in its 2009 report on the tar sands. Incredibly, industrial development in the tar sands region now consumes 20% of Canadian demand. By 2035, the project could burn up between 25 and 40% of the total national demand, or 6.5 billion cubic feet a day. Such a scenario would drain most of the natural gas contained in the Arctic and Canada’s Mackenzie Delta, as well as Alaska’s North Slope. Armand Laferrère, the president and CEO of Avera Canada, estimates that the tar sands industry could commandeer the majority of Canada’s natural gas supply by 2030.

What are tar sands?

 Tar sands are a half-baked substance, a finite product of up to 300-million-year-old sun-baked algae, plankton, and other marine life, compressed, cooked, and degraded by bacteria.  Good cooking results in light oil. Bad cooking makes bitumen, which is so hydrogen poor that it takes energy-intensive upgrading to make marketable. Fifty per cent of Canada now depends on a half-baked fuel.

It’s a very dirty fuel.  Bitumen is 5% sulfur (about 8 times more than high-quality Texas oil), 0.5% nitrogen, 1,000 parts per million heavy metals such as nickel and vanadium, and also has salts, clays, and  resins.  This can sometimes lead to fouling and corrosion of equipment, causing energy inefficiencies and refinery shutdowns. Between 2003 and 2007, processing lower-quality oil from the tar sands increased energy consumption at U.S. refineries by 47%.

Miners and engineers generally don’t canoe on or fish in the ponds because of two really nasty pollutants: polycyclic aromatic hydrocarbons (PAH) and naphthenic acids. Of 25 PAH s studied by the U.S. Environmental Protection Agency (and there are hundreds), 14 are proven human carcinogens. The EPA found that many PAH s produce skin cancers in “practically all animal species tested.” Fish exposed to PAH s typically show “fin erosion, liver abnormalities, cataracts, and immune system impairments leading to increased susceptibility to disease.” Even the Canadian Association of Petroleum Producers recognizes that a “significant increase in processing of heavy oil and tar sands in Western Canada in recent years has led to the rising concerns on worker exposure to polycyclic aromatic hydrocarbons.” In 2003, the ubiquitous presence of PAH s in the tar ponds prompted entomologist Dr. Jan Ciborowski to make another one of those unbelievable tar sands calculations: he estimated that it would take 7 million years for the local midge and black fly populations to metabolize all of the industry’s cancer makers.

Naphthenic acids, which by weight compose 2% of bitumen deposits in the Athabasca region, are not much friendlier than pahs. Industry typically recovers these acids from oil to make wood preservatives or fungicides and flame retardants for textiles. The acids are also one of the key ingredients used in napalm bombs. Naphthenic acids kill fish and most aquatic life.

Upgrading requires so much fuel that this step adds 100 to 200 pounds of CO2 per barrel. This toxic, polluting, ultra-heavy hydrocarbon is a damned expensive substitute for light oil. The Canadian Industrial End-Use Energy Data and Analysis Centre concluded in 2008 that synthetic crude oil made from bitumen had “the highest combustion emission intensity” of five domestic petroleum products and was “the most energy intensive one to process” in Canada.

Bitumen looks like molasses and smells like asphalt, sticky as tar on a cold day. In fact, Canada’s National Centre for Upgrading Technology says that “raw bitumen contains over 50 per cent pitch” and can be used to cover roads.   Because of its stickiness, bitumen cannot move through a pipeline without being diluted by natural gas condensate or light oil.

Why Canadian bitumen should be called tar sands, not oil sands

tar-sand-bitumenIndustry executives  and many politicians hate the word tar sands.  Oil sands sounds much better, implying abundance, easy access, and much cleaner.  The world oil raises investment cash better than the word tar.  It’s more likely to make investors forget that extraction requires a huge amount of energy to mine and upgrade than oil drilling. The Alberta government says it’s okay to describe the resource as oil sands “because oil is what is finally derived from bitumen.” If that lazy reasoning made any sense, tomatoes would be called ketchup and trees called lumber.

Rick George, president and CEO of Suncor, unwittingly made a good argument for calling the stuff tar. Bitumen may contain a hydrocarbon, he said, but you can’t use it as a lubricant because “it contains minerals nearly as abrasive as diamonds.” You can’t pump it, because “it’s as hard as a hockey puck in its natural state.” It doesn’t burn all that well, either; “countless forest fires over the millennia have failed to ignite it.

In 1983, engineer Donald Towson made a good case for calling the resource tar, not oil, in the Encyclopedia of Chemical Technology. He argued that the word accurately captures the resource’s unorthodox makeup, which means it is “not recoverable in its natural state through a well by ordinary production methods.” Towson noted that bitumen not only has to be diluted with light oil to be pumped through a pipeline but requires a lot more processing than normal oil. (Light oil shortages are so chronic that industry imported 50,000 barrels by rail last year to the tar sands.) Even after being upgraded into “synthetic crude,” the product requires more pollution-rich refining before it can become jet fuel or gasoline.

Brute force extraction

Bitumen can’t be sucked out of the ground like Saudi Arabia’s black gold. It took an oddball combination of federal and provincial scientists and American entrepreneurs nearly seventy years from the time of Mair’s visit to the tar sands (and billions of Canadian tax dollars) to figure out how to separate bitumen from sand. They finally arrived at a novel solution: brute force.

Extracting bitumen from the forest floor is done in two earth-destroying ways. About 20% of the tar sands are shallow enough to be mined by 3-story-high, 400-ton Caterpillar trucks and $15-million Bucyrus electric shovels.

The open-pit mining operations look more hellish than an Appalachian coal field. To get just ONE barrel of bitumen:

  1. hundreds of trees must be cut
  2. acres of soil removed
  3. wetlands drained
  4. 4 tons of earth dug up to get 2 tons of bituminous sand
  5. boiling water poured over the sand to extract the oil

This costs about $100,000 per flowing barrel, making bitumen one of the planet’s most expensive fossil fuels.

Scale:

  • Every other day, the open-pit mines move enough dirt and sand to fill Yankee Stadium  yankee-stadium-tar-sands-per-day-volume
  • Since 1967, one major mining company has moved enough earth (2 billion tons) to build seven Panama canals.

In-situ process

Most of the tar sands are so deep that the bitumen must be steamed or melted out of the ground, with the help of a bewildering array of pumps, pipes, and horizontal wells. Engineers call the process in situ (in place). The most popular in situ technology is Steam-Assisted gravity Drainage (SAGD). “Think of a big block of wax the size of a building, SAGD expert Neil Edmunds explains. “Then take a steam hose and tunnel your way in and melt all the wax above. It will drain to the bottom where it can be collected.

SAGD technology burns enough natural gas, for boiling water into steam, to heat six million North American homes every day. In fact, natural gas now accounts for more than 60% of the operating costs for a SAGD project. Using natural gas to melt a resource as dirty as bitumen is, as one executive said, like “burning a Picasso for heat.

SAGD EROEI IS VERY LOW

  • In 2008, the Canadian federal government revealed that 1 joule of energy was needed to produce only 1.4 joules of energy as gasoline in the SAGD projects.
  • The U.S. Department of Energy calculates that an investment of one barrel of energy yields between four and five barrels of bitumen from the tar sands.
  • Some experts figure that the returns on energy invested may be as low as two or three barrels.

Compare that with oil –on average, it takes 1 barrel of oil (or energy equivalent), to pump out 20 to 60 barrels of cheap oil.

Bitumen’s low-energy returns and earth-destroying production methods explain why the unruly resource requires capital investments up to $126,000 per barrel of daily production and market prices of between $60 and $80. Given its impurities, bitumen often sells for half the price of West Texas crude.

Here are just a few reasons why it’s so expensive:

  • High wages: high-school grads earn more than $100,000 a year driving the world’s largest trucks (400-ton vehicles with the horsepower of a hundred pickup trucks) to move $10,000 worth of bitumen a load.
  • Land: Suncor had started to clear-cut an estimated 290,000 trees for its Steep Bank mine, and surveyors and contractors staked out new mine sites for Shell and Syncrude. Bitumen leases that had sold for $6 an acre in 1978 now sold for $120. (By 2006, companies would be paying $486 per acre.)
  • Equipment: The trucks dump the ore into a crusher, which spits the bitumen onto the world’s largest conveyor belt, about 1,600 yards long.
  • Processing: The bitumen is eventually mixed with expensive light oil and piped to an Edmonton refinery.
  • Shell’s boreal-forest-destroying enterprise required 995 miles of pipe and consumes enough power to light up a city of 136,000 people. It gobbled up enough steel cable to stretch from Calgary to Halifax and poured enough concrete to build thirty-four Calgary Towers. tar-sands-34-calgary-towers-cement-shell-mine
  • The price tag for an open-pit mine plus an upgrader has climbed from $25,000 to between $90,000 and $110,000 per flowing barrel over the last decade. Conventional oil requires, on average, $1,000 worth of infrastructure to remove a flowing barrel a day

The rising price of oil largely obscured these extravagant costs until prices crashed in 2008 and again in 2014.

Pollution!!!

tar-sand-water-pollutionBiologists and ecologists understood that the environmental consequences of digging up a forest in a river basin that contained 20% of Canada’s fresh water could be enormous. According to Larry Pratt’s lively account of Kahn’s presentation in his book The Tar Sands, one federal government official calculated that the megaproject would dump up to 20,000 tons of bitumen into the Athabasca River every day and destroy the entire Mackenzie basin all the way to Tuk-toyaktuk. Studies and reports completed in 1972 had warned that the construction of “multi-plant operations” would “turn the Fort McMurray area of northeastern Alberta into a disaster region resembling a lunar landscape” or a “biologically barren wasteland.

At a 50 per cent use of groundwater, SAGD generates formidable piles of toxic waste. Companies can’t make steam without first taking the salt and minerals out of brackish water. As a consequence, an average SAGD producer can generate 33 million pounds of salts and water-solvent carcinogens a year, which simply gets trucked to landfills. Because the waste could contaminate potable groundwater, industry calls its salt disposal problem “a perpetual care issue.  Insiders remain alarmed by industry’s rising salt budget. “There is no regulatory oversight of these landfills, and these problems will be enormously difficult to fix,” says one SAGD developer.

Arsenic, a potent cancer-maker, poses another challenge. Industry acknowledges that in situ production (the terrestrial equivalent of heating up the ocean) can warm groundwater and thereby liberate arsenic and other heavy metals from deep sediments. No one knows how much arsenic 78 approved SAGD projects will eventually mobilize into Alberta’s groundwater and from there into the Athabasca River.

Pollution from the tar sands has now created an acid rain problem in Saskatchewan and Manitoba. With much help from 150,000 tonnes of acid-making air-borne pollution from the tar sands and local upgraders, Alberta now produces 25% of Canada’s sulfur dioxide emissions and a third of its nitrogen oxide emissions.  12 per cent of forest soils in the Athabasca and Cold Lake regions are already acidifying. Rain as acidic as black coffee is now falling in the La Loche region just west of Fort McMurray.

Albertans are expected to believe that the world’s largest energy project can displace more than a million tons of boreal forest a day, industrialize a landscape mostly covered by wetlands, create fifty square miles of toxic-waste ponds, spew tons of acidic emissions, and drain as much water from the Athabasca River as that annually used by Toronto, all with no measurable impact on water quality or fish.

Tailings Ponds pollution

Astronauts can see the ponds from space, and politicians typically confuse them with lakes. Miners call the watery mess “tailings.” Industry prefers the term “oil sands process materials” (ospm). Call them what you like, there is no denying that the world’s biggest energy project has spawned one of the world’s most fantastic concentrations of toxic waste, producing enough sludge every day (400 million gallons) to fill 720 Olympic pools.

The ponds are truly a wonder of geotechnical engineering. Made from earth stripped off the top of open-pit mines, they rise an average of 270 feet above the forest floor like strange flat-topped pyramids. By now, the ponds hold more than 40 years of contaminated water, sand, and bitumen.

Amazingly, regulators have allowed industry to build nearly a dozen of them on either side of the Athabasca River. The river, as noted, feeds the Mackenzie River Basin, which carries a fifth of Canada’s fresh water to the Arctic Ocean. The basin ferries wastes from the tar sands to the Arctic too.

The ponds are a byproduct of bad design and industry’s profligate water abuse. Of the 12 barrels of water needed to make one barrel of bitumen, approximately three barrels become mudlike tailings. All in all, approximately 90% of the fresh water withdrawn from the Athabasca River ends up in settling ponds engineered by firms such as Klohn Crippen Berger and owned by the likes of Syncrude, Imperial, Shell, or CNRL. After separating bitumen from sand with hot water and caustic soda, industry pumps the leftover ketchup-like mess into the ponds.

Engineers originally thought that the clay and solids would quickly settle out from the water. But bitumen’s clay chemistry confounded their expectations, and the ponds have been stubbornly growing ever since. They now cover fifty square miles of forest and muskeg. That’s equivalent to the size of Staten Island, New York, or nearly 150 Lake Louises without the Rocky Mountain scenery—or 300 Love Canals. Within a decade, the ponds will cover an area of eighty-five square miles. Experts now say that it might take a thousand years for the clay in the dirty water to settle out.

Given a tailings cleanup cost of $2–3 per barrel of oil, the ponds represent a $10-billion liability.

Every year the ponds quietly swallow thousands of ducks, geese, and shorebirds as well as moose, deer, and beaver.  Industry has tried to keep bird killing to a minimum by using scarecrows affectionately called Bit-U-Men.

In 2003, the intergovernmental Mackenzie River Basin Board identified the tailings ponds as a singular hazard. The board noted that “an accident related to the failure of one of the oil sands tailings ponds could have a catastrophic impact on the aquatic ecosystem of the Mackenzie River Basin.” Such catastrophes have happened before. In 2000, a tailings pond operated by the Australian-Romanian company Aurul S.A. broke after a heavy rain in Baia Mare, Romania. The pond released enough cyanide-laced water to potentially kill one billion people,

Bruce Peachey of New Paradigm Engineering. “If any of those [tailings ponds] were ever to breach and discharge into the river, the world would forever forget about the Exxon Valdez,” adds the University of Alberta’s David Schindler. (The Valdez released about 11 million gallons of crude oil into Prince William Sound, Alaska, in 1989. PAH concentrations alone in the tar ponds represent about 3,000 Valdezes.)

McDonald was born on the river, and he had trapped, fished, farmed, and worked for the oil companies. He fondly remembered the 1930s and 1940s, when Syrian fur traders exchanged pots and pans for muskrat and beaver furs along the Athabasca River. Families lived off the land then and had feasts of rabbit. They netted jackfish, pickerel, and whitefish all winter long. “Everyone walked or paddled, and the people were healthy,” McDonald said. “No one travels that river anymore. There is nothing in that river. It’s polluted. Once you could dip your cup and have a nice cold drink from that river, and now you can’t.

McDonald had recently told his son not to have any more children: “They are going to suffer. They are going to have a tough time to breathe and will have nothing to drink.” He dismissed the talk of reclaiming waste ponds and open-pit mines as a white-skinned fairy tale. “There is no way in this world that you can put Mother Earth back like it was.

Like most residents of Fort Chipewyan, Ladouceur believes there is definitely something wrong with the water. He has a list of suspects. Abandoned uranium mines on the east end of the lake, for example, have been leaking for years. “God knows how much radium is in this lake,” he says. Then there are the pulp mills and, of course, the tar sands and tar ponds. Ladouceur says his cousin collected yellow scum from the river downstream from the mines and dried it, and “it caught on fire.” Almost everyone in Fort Chip has witnessed oil spills or leaks on the Athabasca River.

Little if any regulation allows the destruction to continue unabated

The Ottawan government concluded that a massive tar-sands mega-scheme could overheat the economy, create steel shortages, unsettle the labor market, drive up the value of the Canadian dollar, and generally change the nation beyond recognition. The tar sands would also be needed to meet future domestic energy needs. “I don’t know why we should feel any obligations to rush into such large-scale production [of tar sands], rather than leave it in the ground for future generations,” reasoned Donald Macdonald.

But since the 1990s the destruction Kahn predicted has gone mostly unobstructed, because the Energy Resources Conservation Board (ERCB), the province’s oil and gas regulator, has become a captive regulator, largely funded by industry and mostly directed by lawyers and engineers with ties to the oil patch.

On paper, the ERCB has a mandate to develop and regulate oil and gas production in the public interest and claims to have the world’s most stringent rules. But these “rules” have allowed the board to:

  • Approve oil wells in lakes and parks, permit sour-gas wells — as poisonous as cyanide —near schools, Endorse the carpet-bombing of the province’s most fertile farmland with thousands of coal-bed methane wells and transmission lines
  • Until recently, the board refused to report the names of oil and gas companies not in compliance with its regulations, citing security reasons.
  • The agency has only two mobile air monitors to investigate leaks from 244 sour-gas plants, 573 sweet-gas plants, 12,243 gas batteries, and about 250,000 miles of pipelines.
  • In 2006, the board approved more than 95% of the 60,000applications submitted by industry.
  • After hearing in 2006 that the construction of Suncor’s $7-billion Voyageur Project would draw down groundwater by 300 feet, overwhelm housing and health facilities, and result in air quality exceedances for sour gas, benzene, and particulate matter, the board agreed that the project would “further strain public infrastructure” but declared the impacts “acceptable.”
  • After the Albian Sands Muskeg River Mine Expansion proposed to dig up 31,000 acres of forest, destroy 170 acres of fish habitat along the Muskeg River, and withdraw enough water from the Athabasca River to fill 22,000 Olympic-sized pools a year, the board concluded in 2006 that the megaproject was “unlikely to result in significant adverse environmental effects.

Mountain-top coal removal versus Tar Sands destruction

Mountaintop removal and open-pit bitumen mining are classic forms of strip mining, with a few key differences. In mountaintop removal, the company first scrapes off the trees and soil. Next, it blasts up to 800 feet off the top of mountains (in West Virginia alone, industry goes through 3 million pounds of dynamite every day.) Massive earth movers, like those used in the tar sands, then push the rock, or “excess spoil,” into river valleys, a process industry calls “valley fill.” Finally, giant drag lines and shovels scoop out thin layers of coal.

In the tar sands, companies specialize in forest-top removal. First they clear-cut up to 200,000 trees, then drain all the bogs, fens, and wetlands. Unlike in Appalachia, companies don’t throw the soil and rock (what the industry calls “overburden”) into nearby rivers or streams. Instead, they use the stuff to construct walls for the tar ponds, the world’s largest impoundments of toxic waste.

As earth-destroying economies, mountaintop removal and bitumen mining have few peers in their role as water abusers.

The EPA published its damning findings in a series of studies, despite massive interference along the way by the coal-friendly administration of George W. Bush. In an area encompassing most of eastern Kentucky, southern West Virginia, western Virginia, and parts of Tennessee, mountaintop removal smothered or damaged 1,200miles of headwater streams between 1985 and 2001, which bring life and energy to a forest. The studies were blunt: “Valley fills destroy stream habitats, alter stream chemistry, impact downstream transport of organic matter and . . . destroy stream habitats before adequate pre-mining assessment of biological communities has been conducted.” The EPA predicted that mountaintop removal would soon bury another 1,000 miles of headwater streams. Downstream pollution from the strip mines also contaminated rivers and streams with extreme amounts of selenium, sulfate, iron, and manganese. In addition, mountaintop removal dried up an average of 100water wells a day and dramatically polluted groundwater.  More than 450 mountains were destroyed during a six-year period, as well as 7% (370,000 acres) of the most diverse hardwood forest in North America.

The tar sands have already created a similar footprint in the Mackenzie River Basin, which protects and makes 20% of Canada’s fresh water. Throughout the southern half of the basin, bitumen mining destroys wetlands, drains entire watersheds, guzzles groundwater, and withdraws Olympic amounts of surface water from the Athabasca and Peace rivers. A large pulp mill industry struggles along in the wake of the oil patch, and a nascent nuclear industry threatens to become another water thief in the basin.

To date, no federal or provincial agency has done a cumulative impact study evaluating the industry’s footprint on boreal wetlands and rivers.

Bitumen is one of the most water-intensive hydrocarbons on the planet

If water shortages were to occur, both industry and government have limited courses of action—they can either reduce water consumption or build upstream, off-site storage for water taken from the Athasbasca during high spring flows.    Although industry and government have set goals of three million barrels a day by 2015, Peachey thinks water availability could well constrain such exuberance.

On average, the open-pit mines require 12 barrels of water to make 1 barrel of molasses-like bitumen. [Like tar sands, liquefied coal is often seen as a solution to oil decline, but liquid coal production is also highly limited by water which requires 6 to 15 tons of water per ton of coal-to-liquids(CTL).]

Most of the tar-sands water is needed for a hot-water process (similar to that of a giant washing machine) that separates the hydrocarbons from sand and clay.

Some companies recycle their water as many as 18 times, so every barrel of bitumen consumes a net average of 3 barrels of potable water. Given that the industry produces 1 million barrels of bitumen a day, the tar sands industry virtually exports 3 million barrels of water from the Athabasca River daily.

The industry will need more water as it processes increasingly dirtier bitumen deposits, because now the best ores are being mined.  In the future the clay content will increase, requiring ever larger volumes of water.

City-sized open-pit mines will soon be eclipsed by another water hog in the tar sands: in situ production. About 80% of all bitumen deposits lie so deep under the forest that industry must melt them into black syrup with technologies such as steam-assisted gravity drainage (SAGD). Twenty-five SAGD projects worth nearly $80 billion could produce 4 million barrels of bitumen a day by 2020 and easily surpass mine production. But as Robert Watson, president of Giant Grosmont Petroleum Ltd., warned in 2003 at a regulatory hearing: “David Suzuki is going to have problems with SAGD. Alberta natural gas consumers are going to have problems with SAGD . . . SAGD is not sustainable”.  Land leased for SAGD production now covers an area the size of Vancouver Island, which means in situ drilling will threaten water resources over an area 50 times greater than that affected by the mines. SAGD is not benign: it generally industrializes the land and its hydrology with a massive network of well pads, pipelines, seismic lines, and thousands of miles of roads.

Although industry spin doctors calculate that it takes about one barrel of raw water (most from deep salty aquifers) to produce 4 barrels of bitumen, most SAGD engineers admit to much higher water-to-bitumen ratios. Actually, SAGD could be removing as much water from underground aquifers as the mines are withdrawing from the Athabasca River within a decade.

Moreover, SAGD’s water thirst appears to be expanding. Industry used to think that it only needed 2 barrels’ worth of steam to melt 1 barrel of bitumen out of deep formations, but the reservoirs have proved uncooperative. Opti-Nexen’s multibillion-dollar Long Lake Project south of Fort McMurray, for example, originally predicted an average steam-oil ratio of 2.4. But Nexen now forecasts a 35% increase in steam (a 3.3 ratio). Most SAGD projects have increased their steam ratios to greater than 3 barrels, with a few projects already as high as 7 or 8.

“A lot of projects may prove uneconomic in their second or third phases because it takes too much steam to recover the oil,” explains one Calgary-based SAGD developer.

High-pressure steam injection into bitumen formations can cause micro earthquakes and heave the surface of land by up to eight inches. Steam stress can also fracture overlying rock, allowing steam to escape into groundwater or the empty chambers of old SAGD operations. (The steam stress problem is so dramatic, says one engineer, that all forecasts of SAGD potential production are probably grossly exaggerated.) Both Imperial Oil and Total have experienced spectacular SAGD failures that left millions of dollars of equipment soaking in mud bogs.

The dramatic loss in steam efficiency for deep bitumen deposits means companies have to drain more aquifers to boil more water. To boil more water, the companies have to use more natural gas (the industry currently burns enough gas every day to keep the population of Colorado warm), which in turn means more greenhouse gas emissions. By some estimates, SAGD could consume 40% of Canadian demand by 2035.

SAGD’S frightful natural gas addiction is now driving shallow drilling as well as coal-bed methane developments on prime agricultural land throughout central Alberta. (Coal-bed methane is the tar sands of natural gas: it requires more wells and more land disturbance than conventional gas and poses a huge threat to groundwater, which often moves along coal seams.) The quick removal of natural gas from underground pools and coal deposits creates a void that could, over time, fill up with either water or migrating gas. Nobody really knows at the moment how many old gas pools connect with water aquifers or how many are filling up with water. Bruce Peachey estimates that natural gas drilling could result in the eventual disappearance of 350 to 530 billion cubic feet of water in arid central Alberta.

Due to spectacular growth in SAGD (nearly $4 billion worth of construction a year until 2015), Alberta Environment can no longer accurately predict industry’s water needs. The Pembina Institute, a Calgary-based energy watchdog, reported that the use of fresh water for SAGD in 2004 increased three times faster than the government forecast of 110 million cubic feet a year. Government has made a conscious effort to get SAGD operations to switch to using salty groundwater. However, since it costs more to desalinate the water and creates a salt disposal problem, SAGD could be still be drawing more than 50 per cent of its volume from freshwater sources by 2015.

The biggest issue for SAGD production may be changes in the water table over time. “If you take out a barrel of oil from underground, it will be replaced with a barrel of water from somewhere,” explains Bruce Peachey. The same rule applies to natural gas. Peachey figures that if all the depleted gas pools near the tar sands were to refill with water, the water debt could amount to half the Athabasca River’s annual flow. This vacuum effect may also explain why the most heavily drilled energy states in the United States are experiencing the most critical water shortages.

Brad Stelfox, a prominent land-use ecologist who works for both industry and government, notes that a century ago all water in Alberta was drinkable. “Three generations later all water is non-potable and must be chemically treated,” he points out. “Is that sustainable?

Tar sands will also destroy  Saskatchewan province

By 2020, three provincial pipelines from Fort McMurray will ferry three million barrels of raw bitumen a day to Upgrader Alley, and in so doing transform the counties of Strathcona, Sturgeon, and Lamont and the City of Fort Saskatchewan into a “world class energy hub.” Just about every company with a mine or SAGD project in Fort McMurray, from Total to Statoil, has joined the rush to build nearly $45 billion worth of upgraders, refineries, and gasification plants. The colossal development will not only industrialize a 180-square-mile piece of prime farmland straddling the North Saskatchewan River (an area half the size of Edmonton) but consume the same amount of water as one million Edmontonians.

A landscape that once supported potato and dairy farms will soon be dotted with supersized industrial bitumen factories exporting synthetic crude and jet fuel to Asia and the United States.

Bitumen upgraders are among the world’s most proficient air polluters because, as the 2006 Alberta’s Heavy Oil and Oil Sands guidebook notes, they are “all about turning a sow’s ear into a silk purse.” Removing impurities from bitumen or adding hydrogen requires dramatic feats of engineering that produce two to three times more nitrogen dioxides (a smog maker), sulfur dioxide (an acid-rain promoter), volatile organic compounds (an ozone developer), and particulate matter (a lung and heart killer) than the refining of conventional oil.

From the government’s point of view, a multibillion-dollar upgrader is much more appealing than a farm. A typical midsized upgrader, for example, can pipe $450 million worth of taxes into federal and provincial coffers every year for twenty-five years. The construction of half a dozen upgraders can employ twenty thousand people for a decade and keep the economy growing like an algae bloom.

Relative to conventional crude, bitumen typically sells at such a heavy discount that U.S. refineries equipped to handle the product can turn over incredible profits. “The lost profits and lost opportunities are simply too large to ignore,” concluded Dusseault. But the Alberta government did ignore them, and by 2007 bitumen’s lower price differential amounted to a loss of $2 billion a year. Money is lost whenever raw bitumen is exported.

The oil patch is the second-highest water user in the North Saskatchewan River basin (using 18% of water withdrawals). The upgrader boom will make the petroleum sector number one. A 2007 report for the North Saskatchewan Watershed Alliance says that “nearly all of the projected increase in surface water use will be in the petroleum sector.” By 2015, the upgraders’ demands on river water will increase by 278%; by 2025, 339%. John Thompson, author of the report, says the absence of an authoritative study on the river’s ecosystem, an Alberta trademark, leaves a big hole. “We don’t know what it takes to maintain the river’s health.” Providing energy for the upgraders will also take a toll on water. Sherritt International and its investment partner, the Ontario Teachers’ Pension Plan, are proposing to strip-mine a 120-square-mile area just east of Upgrader Alley for coal.

Gasification plants would render the coal into synthetic gas and hydrogen to help power the upgraders. Current estimates suggest that the project will consume somewhere between 70 million and 317 million cubic feet of water from the North Saskatchewan annually. Strip-mining farmland will also “affect groundwater aquifers and surface water hydrology.

Enbridge, the largest transporter of crude to the U.S., also wants to open the floodgates to Asia with a proposed $5-billion global superhighway, the Northern Gateway Project. Now backed by ten anonymous investors, the project would ferry 525,000 barrels of dilbit (diluted bitumen) from Edmonton to the deep-water port of Kitimat, B.C., to help put more cars on the road in Shanghai. Paul Michael Wih-bey, a tar sands promoter, describes the pipeline as part of a grand “China-Alberta-U.S. Nexus” and “ a new global market order based on secure supplies of reasonably priced heavy oils.” The dual 700-mile-long pipeline would also import 200,000 barrels of condensate or diluent from Russia or Malaysia to help lubricate the export line. Enbridge calls the Northern Gateway Project “an important part of Canada’s energy future,” and the company has hired a former local mla and cbc journalist to talk up the project in rural communities. Given that the megaproject would cross 1,000 streams and rivers that now protect some of the world’s last remaining salmon fisheries, it was received coldly in many quarters.

Given that NAFTA rules force Canada to maintain a proportional export to the United States (Mexico wisely rejected the proportionality clause on energy exports), these three new pipelines will undermine our nation’s energy security. In the event of an international energy emergency, the pipelines guarantee that the United States will get the greatest share of Canadian oil. “It hasn’t dawned on most Canadians that their government has signed away their right to have first access to their own energy supplies,” says Gordon Laxer, director of the Parkland Institute.

The export of bitumen to retrofitted U.S. refineries will dirty waterways, air sheds, and local communities. About 70% of current refinery expansion proposed in the United States (a total of 17 renovations and five new refineries) is dedicated to bitumen from the tar sands. Companies such as BP, Marathon, Shell, and ConocoPhillips have announced plans to expand and refit nearly half a dozen older refineries in the Great Lakes region to process bitumen.

On the Canadian side of the Great Lakes, refineries are expanding in Sarnia’s notorious Chemical Valley. The area already boasts more than 65 petrochemical facilities, including a Suncor refinery that has been upgrading bitumen for 55 years. Shell wants to add a bitumen upgrader to the mix, and Suncor just completed a billion-dollar addition to handle more dirty oil. The region currently suffers from some of the worst air pollution in Canada. Industrial waste from Chemical Valley has feminized male snapping turtles in the St. Clair River, turned 45% of the whitefish in Lake St. Clair “intersexual,” and exposed 2,000 members of the Aamjiwnaang First Nation to a daily cocktail of 105 carcinogens and gender-benders. Newborn girls outnumber boys by two to one on the reserve. Two-thirds of the children have asthma, and 40% of pregnant women experience miscarriages. Calls for a thorough federal investigation have gone unheeded.

The marketplace and quislinglike regulators are directing our country’s insecure economic future without a vote or even so much as a polite conversation over coffee. Canadians can now choose between two nightmares: an air-fouling, river-drinking economy that upgrades the world’s dirtiest hydrocarbon on prime farmland or a traditional staples economy that exports cheap bitumen and thousands of jobs to polluting refineries in China, the Gulf Coast, and the Great Lakes while making Eastern Canada ever more dependent on the uncertain supply of foreign oil. There is currently no plan C.

The rapid development  of the tar sands has made climate change a joke about Everybody, Somebody, Anybody, and Nobody. Everybody thinks reducing carbon dioxide emissions needs to be done and expects Somebody will do it. Anybody could have reduced emissions, but Nobody did. Everybody now blames Somebody, when in fact Nobody asked Anybody to do anything in the first place.

In meetings and in its proposed rules for geologic storage, the EPA has strongly recommended that government map out the current state of groundwater and soil near potential storage sites. Once CO2 begins to be injected at carefully chosen sites, the EPA has proposed that regulators track CO2 plumes in salt water, monitor local aquifers above and beyond the storage site to assure protection of drinking water, and sample the air over the site for traces of leaking CO2. And this isn’t something to be done over twenty or fifty years—the EPA believes this oversight needs to be maintained for hundreds, if not thousands, of years.

Just how likely is leakage? If Florida’s experience with the deep injection of wastewater is any indication, there will be leakage, and lots of it. Since the 1980s, 62 Florida facilities have been pumping three gigatons—0.7 cubic miles—of dirty water full of nitrate and ammonia into underground saltwater caves, some 2,953 feet deep, every year to keep the ocean clean. During the 1990s, the wastewater migrated into at least three freshwater zones, contaminating drinking water, though the EPA didn’t acknowledge the scale of the problem until 2003. David Keith, who has studied the Florida problem, says surprises will occur with carbon capture; regulations must adapt and be based on results from a dozen large-scale pilot projects. Absolutely prohibiting CO2 leakage would be a mistake, he says, since “it seems unlikely that large-scale injection of CO2 can proceed without at least some leakage.” Keith suspects the risks to groundwater will be

Other scientists, such as a group at the U.S. Lawrence Berkeley National Laboratory, suspect keeping CO2 out of groundwater will be more difficult than managing liquid waste in Florida. They say CO2 injection involves more complex hydrologic processes than storing liquid waste, and it could even force salt water into freshwater sources. The group, now studying CCS and groundwater, says scientists don’t have a good idea of how CCS could change the pressure at the groundwater table level, impact discharge and recharge zones, and affect drinking water.

Nuclear power and tar sands

In 1956, Manley Natland had the kind of energy fantasy that the tar sands invite with predictable regularity. As the Richfield Oil Company of California geologist sat in a Saudi Arabian desert watching the sun go down, it occurred to him that a 9-kiloton nuclear bomb could release the equivalent of a small, fiery sun in the stubborn Alberta tar sands deposits. Detonating the bomb underground would make a massive hole into which boiled bitumen would flow like warmed corn syrup. “The tremendous heat and shock energy released by an underground nuclear explosion would be distributed so as to raise the temperature of a large quantity of oil and reduce its viscosity sufficiently to permit its recovery by conventional oil field methods,” Natland later wrote. He thought that the collapsing earth might seal up the radiation, and the bitumen could provide the United States with a secure supply of oil for years to come. Two years after his desert vision, Natland and other Richfield Oil representatives, the Alberta government, and the United States Atomic Energy Commission held excited talks about Project Cauldron, which planners later renamed Project Oil Sands. Natland selected a bomb site sixty-four miles south of Fort McMurray, and the U.S. government generously agreed to supply a bomb. Richfield acquired the lease site. Alberta politicians celebrated the idea of rapid and easy tar sands development, and the Canadian government set up a technical committee. Popular Mechanics magazine enthused about “using nukes to extract oil.

Edward Teller, the nuclear physicist and hawkish father of the hydrogen bomb, championed Natland’s vision. In an era when nuclear proponents got giddy about nuclear-powered cars, Teller regarded Project Cauldron as another opportunity to hammer the threat of nuclear swords into peaceful ploughs. “Using the nuclear car to move the fossil horse” was a promising idea, the bomb maker wrote. Chance, however, intervened. Canadian Prime Minister John D. Diefenbaker didn’t relish the idea of nuclear proliferation, or of the United States meddling in the Athabasca tar sands. The Soviets had experimented with nuking oil deposits only to learn that there was no market for radioactive oil. The promise of cheaper conventional sources in Alaska also lured Richfield Oil away from Project Cauldron. The moment passed for Natland. But the idea of using a nuclear car to fuel a hydrocarbon horse never really died, and these days some new scheme to run the tar sands on nuclear power emerges weekly with great fanfare. The CEO of Husky Energy, John Lau, seems interested, and Gary Lunn, the federal minister of natural resources, says he’s “very keen,” adding that it’s a matter of “when and not if.” Roland Priddle, former director of the National Energy Board and the Energy Council of Canada’s 2006 Energy Person of the Year, speaks enthusiastically about the synthesis “of nuclear and oil sands energy,” as does Prime Minister Stephen Harper. Bruce Power, an Ontario-based company, has proposed four reactors at a cost of $12 billion for tar sands production in Peace River country. France’s nuclear giant Avera wants to build a couple of nukes in the tar sands too. Saskatchewan, an Alberta wannabe, has proposed two nuclear facilities: one near the tar sands and one on Lake Diefenbaker. Employees of Atomic Energy of Canada Ltd. (aecl), a federal Crown corporation that designs and markets candu reactors, told a Japanese audience in 2007 that “nuclear plants provide a sustainable solution for oil sands industry energy requirements, and do not produce ghg emissions.” If realized, these latest

In sunny Alberta, nukes for oil are being celebrated these days as some sort of magic bullet for carbon pollution as well as for rapid depletion of natural gas supplies. Natural gas now fuels rapid bitumen production, and it takes approximately 1,400 cubic feet of natural gas to produce and upgrade a barrel, equal to nearly a third of the barrel’s energy content. The tar sands are easily Canada’s biggest natural gas customer. They burn the blue flame to generate electricity to run equipment and facilities, they convert it as a source of hydrogen for upgrading, and they use it to heat water. SAGD operations, which need anywhere from two to four barrels of steam to melt deep bitumen deposits, are super-sized natural gas consumers. Thanks to the unexpectedly low quality of many bitumen deposits, SAGD requires more steam and therefore more natural gas every year.

Nuclear plants overheat without regular baths of cool water. (This explains why current proposals have placed nuclear reactors on the Peace River, one of Alberta’s longest rivers, or Lake Diefenbaker, the source of 40 per cent of the water for Saskatchewan.) The Darlington and Pickering facilities in Ontario require approximately two trillion gallons of water for cooling a year, about nineteen times more water than the tar sands use. In fact, water has become an Achilles heel for the nuclear industry. Recent heat waves in Europe and the United States either dried up water supplies or forced nuclear plants to discharge heated wastewater into shallow rivers, killing all the fish.

How tar sands corrupt democracy

  • When revenue comes from oil, citizens pay lower taxes, and all the government has to do is approve more tar sands projects, regardless of the harm they will do to the environment
  • Without taxation, people don’t pay much attention to how it’s spent, ask questions, or vote.
  • In turn, oil revenue driven governments are less likely to listen to voters, and better able to buy votes and influence people, enrich their friends and family
  • These oil-corrupted government leaders then use some of the money to discourage thought, debate, or dissent. For example, the Alberta government spends $14 million a year on 117 employees to tell Albertans what to think, and another $25 milloin in convincing Alberta’s citizens and U.S. oil consumers that tar sands are quite green and not as nasty as some have portrayed.
  • In Mexico and Indonesia, oil funds have propped up one party rule, used the money to buy guns, tanks and other means of putting rebellions down.

[ Canadians above all should really read this book, because they’re being robbed now and for millennia in the future of the financial gains and a stretched-out, longer use of this energy for their own nation.  The tar sands are open to anyone to exploit.  This is because most people who work in the oil industry know that peak oil is real and the tar sands are the last place on earth where oil companies can make an investment and grow production. ]

“In the big picture, deepwater oil and the oilsands are the only game left in town.  You know you are at the bottom of the ninth when you have to schlep a ton of sand to get a barrel of oil,” notes CIBC chief economist Jeffrey Rubin.

History

Mair didn’t see the grand and impossible future of Canada until the steamer docked at Fort McMurray, a “tumble-down cabin and trading-store.” That’s where he encountered the impressive tar sands, what Alexander Mackenzie had described as “bituminous fountains” in 1778 and what federal botanist John Macoun almost a century later called “the ooze.” Federal surveyor Robert Bell described an “enormous quantity of asphalt or thickened petroleum” in 1882. Mair called the tar sands simply “the most interesting region in all the North.” The tar was everywhere. It leached from cliffs and broke through the forest floor. Mair observed giant clay escarpments “streaked with oozing tar” and smelling “like an old ship.” Wherever he scraped the bank of the river, it slowly filled with “tar mingled with sand.” The Cree told him that they boiled the stuff to gum and repair canoes. One night Mair’s party burned the tar like coal in a campfire.

Against all economic odds, visionary J. Howard Pew, then the president of Sun Oil and the seventh-richest man in the United States, had built a mine and an upgrader (now Suncor) on the banks of the Athabasca River in 1967. Pew’s folly, then the largest private development ever built in Canada, would lose money for twenty years by producing the world’s most expensive oil at more than $30 a barrel.

But Pew reasoned that “no nation can long be secure in this atomic age unless it be amply supplied with petroleum.” Given the inevitable depletion of cheap oil, he recognized that the future of North America’s energy supplies lay in expensive bitumen.

Project Independence, the title given to U.S. government energy policy in the early 1970s. The policy stated that “there is an advantage to moving early and rapidly to develop tar sands production” because it “would contribute to the availability of secure North American oil supplies.

Mining Canada’s forest for bitumen would give the United States some time to figure out how to economically exploit its own dirty oil in places such as Colorado’s oil shales and Utah’s tar sands.

Given the current energy crisis and OPEC’s reluctance to boost oil production, Kahn hailed the bituminous sands of northern Alberta as a global godsend. He then presented a tar sands crash-development program to Prime Minister Pierre Elliott Trudeau and Energy Minister Donald Macdonald.

Like everything about Kahn, his rapid development scheme was big and bold. (A crash program, said Kahn, was really “overnight go-ahead decision making.”) This one called for the construction of 20 gigantic open-pit mines with upgraders on the scale of Syncrude, soon to be one of the world’s largest open-pit mines. The futurist calculated that the tar sands could eventually pump out 2 to 3 million barrels of oil a day, all for export. Canada wouldn’t have to spend a dime, either. A global consortium formed by the governments of Japan, the United States, and some European countries would put up the cash: a cool $20 billion. Korea would provide 30 to 40,000 temporary workers, who would pay dues and contribute to pension plans to keep the local unions happy. Kahn pointed out that Canada would receive ample benefits: the full development of an under-exploited resource, high revenues, a refining industry, a secure market, and lots of international trade. The audacity of the vision stunned journalist Clair Balfour at the Financial Post, who wrote, “It would be as though the 10,000 square miles of oil sands were declared international territory, for the international benefit of virtually every nation but Canada.

In the late 1990s, development exploded abruptly with the force of a spring flood on the Athabasca River. The region’s fame spread to France, China, South Korea, Japan, the United Arab Emirates, Russia, and Norway. Everyone wanted a piece of the magic sand-pile. The Alberta government, with its Saudi-like ambitions, promised that the tar sands would be “a significant source of secure energy” in a world addicted to oil. But since then, greed and moral carelessness have turned the wonder of Canada’s Great Reserve to dread.

Tar sand investments now total nearly $200 billion. That hard-to-imagine sum easily makes the tar sands the world’s largest capital project. The money comes from around the globe, including France, Norway, China, Japan, and the Middle East. But approximately 60% of the cash hails from south of the border. An itinerant army of bush workers from China, Mexico, Hungary, India, Romania, and Atlantic Canada, among other places, is now digging away.

The Alberta tar sands are a global concern. The Abu Dhabi National Energy Company (taqa), an expert in low-cost conventional oil production, bought a $2-billion chunk of bitumen real estate just to be closer to the world’s largest oil consumer, the United States. South Korea’s national oil company owns a piece of the resource, as does Norway’s giant national oil company, Statoil, which just invested $2 billion. Total, the world’s fourth-largest integrated oil and gas company, with operations in more than 130 countries, plans to steam out two billion barrels of bitumen. Shell, the global oil baron, lists the Athabasca Oil Sands Project as its number-one global enterprise and plans to produce nearly a million barrels of oil a day — more oil than is produced daily in all of Texas. Synenco Energy, a subsidiary of Sinopec, the Chinese national oil company, says it will assemble a modular tar sands plant in China, Korea, and Malaysia, then float the whole show down the Mackenzie River. Japan Canada Oil Sands Limited has put up money.

Over 50,000 temporary foreign workers have poured into Alberta to feed the bitumen boom.  Abuse of these guest workers is so widespread that the Alberta government handled 800 complaints in just one three-month period in 2008.

With just 5% of the world’s population, the United States now burns up 20.6 million barrels of oil a day, or 25% of the world’s oil supply. Thanks to bad planning and an aversion to conservation, the empire must import two-thirds of its liquid fuels from foreign suppliers, often hostile ones. “The reality is that at least one supertanker must arrive at a U.S. port every four hours,” notes Swedish energy expert Kjell Aleklett. “Any interruption in this pattern is a threat to the American economy.” This crippling addiction has increasingly become an unsustainable wealth drainer. In 2000, the United States imported $200 billion worth of oil, thereby enriching many of the powers that seek to undermine the country. By 2008, it was paying out a record $440 billion annually for its oil.

The undeclared crash program in the tar sands has transformed Canada’s role in the strategic universe of oil. By 1999, the megaproject had made Canada the largest foreign supplier of oil to the United States. By 2002, Canada had officially replaced Saudi Arabia and Mexico as America’s number-one oil source, an event of revolutionary significance. Canada currently accounts for 20% of U.S. oil imports (that’s 12% of American consumption), and the continuing development of the tar sands will double those figures. Incredibly, only two in ten Americans and three in ten Canadians can accurately identify the country that now keeps the U.S. economy tanked up.

The rapid development of the Alberta tar sands has also served as a dirty-oil laboratory. Utah has 60 billion barrels of tar sands that are deeper and thinner, and therefore uglier, than Alberta’s resource. To date, appalling costs and extreme water issues have kept Americans from ripping up 2.4 million acres of western landscape. But that may soon change. Republican Utah Senator Orrin G. Hatch said that ”U.S. companies active in the tar sands are only waiting for the U.S. government to adopt a policy similar to Alberta’s which promotes rather than bars the development of the unconventional resources”.

In 2006, a three-volume report by the Strategic Unconventional Fuels Task Force to the U.S. Congress gushed that Alberta’s rapid development approach to “stimulate private investment, streamline permitting processes and accelerate sustainable development of the resource” was one that should be “adapted to stimulate domestic oil sands.” Even with debased fiscal and environmental rules, though, the U.S. National Energy Technology Laboratory has calculated that it would take 13 years and a massively expensive crash program to coax 2.4 million barrels a day out of the U.S. tar sands. A 2008 report by the U.S. Congressional Research Service concluded that letting Canada do all the dirty work in the tar sands made more sense than destroying watersheds in the U.S. Southwest: “In light of the environmental and social problems associated with oil sands development, e.g., water requirements, toxic tailings, carbon dioxide emissions, and skilled labor shortages, and given the fact that Canada has 175 billion barrels of reserves . . . the smaller U.S. oil sands base may not be a very attractive investment in the near-term.

In 2009, the U.S. Council on Foreign Relations, a non-partisan think tank that informs public policy south of the border, critically examined the tar sands opportunity. The council’s report, entitled “Canadian Oil Sands,” found that the project delivered “energy security benefits and climate change damages, but that both are limited.” Natural gas availability, water scarcity, and “public opposition due to local social and environmental impacts” could clog the bitumen pipeline, the report said.

Criminal Intelligence Service Alberta, a government agency that shares intelligence with police forces, reported in 2004 that the boom had created fantastic opportunities for the Hell’s Angels, the Indian Posse, and other entrepreneurial drug dealers: “With a young vibrant citizen base and net incomes almost double the national average, Fort McMurray represents a tremendous market for illegal substances.” By some estimates, as much as $7 million worth of cocaine now travels up Highway 63 every week on transport trucks. According to the Economist, a journal devoted to studying global growth, about “40 per cent of the [tar sands] workers test positive for cocaine or marijuana in job screening and post accident tests.” Health food stores can’t keep enough urine cleanse products in stock for workers worried about random drug trials. There is even a black market in clean urine.

After years of denial and delays, the Alberta Cancer Board announced in May 2008 that it would conduct a comprehensive review of cancer rates in Fort Chipewyan. The peer-reviewed report, released in 2009, completely vindicated O’Connor and the people of Fort Chipewyan. The study found that the northern community had a 30 per cent higher cancer rate than models would predict and a “higher than expected” rate of cases of cancers of the blood, lymphatic system, and soft tissue.

Many of the companies digging up wetlands along the Athabasca River, such as Exxon (part of the Syncrude consortium) and Shell, have already left an expensive legacy in Louisiana. Like Alberta, the bayou state has been a petro-state for years, producing 30 per cent of the domestic crude oil in the United States. For more than three decades, the state’s oil industry compromised coastal marshes and wetlands with ten thousand miles of navigational canals and thirty-five thousand miles of pipelines. These industrial channels, carved into swamps, invited salt water inland, which in turn killed the trees and grasses that kept the marshes intact. The U.S. Geological Survey suspects that the sucking of oil from the ground has also abetted the erosion. Since the 1930s, nearly one-fifth of the state’s precious delta has disappeared into the Gulf of Mexico. In fact, the loss of coastal wetlands now threatens the security of the industry that helped to destroy them. Without the protective buffer of wetlands, wells, pipelines, refineries, and platforms are more vulnerable to storms and hurricanes.  Federal scientists now lament that the state loses a wetland the size of a football field every 38 minutes.

The government’s own records show that it has knowingly permitted the province’s reclamation liability to rocket from $6 billion in 2003 to $18 billion in 2008. If not addressed, the public cost of cleanup could eventually consume more than two decades’ worth of royalties from the tar sands. The ERCB holds but $35 million in security deposits for $18-billion worth of abandoned oil field detritus.

Quotes from the book:

  • “Control oil and you control nations; control food and you control the people.” Henry Kissinger, U.S. National security advisor, 1970
  • Vaclav Smil, Canada’s eminent energy economist says that the main problem is unbridled energy consumption and points out that “All economies are just subsystems of the biosphere and the first law of ecology is that no trees grow to heaven. If we don’t reduce our energy use, the biosphere may do the scaling down for us in a catastrophic manner”.
  • “I do not think there is any use trying to make out that the tar sands are other than a ‘second line of defense’ against dwindling oil supplies.” Karl A. Clark, research engineer, letter to Ottawa, 1947.  

References

Brandt A.R., et al. 2013. The energy efficiency of oil sands extraction: Energy return ratios from 1970 to 2010. Energy.

CAPP. 2015. Canadian crude oil production forecast 2014–2030. Canadian Association of Petroleum Producers.

Kolbert, E. November 12, 2007. Unconventional Crude. Canada’s synthetic fuels boom. New Yorker.

Lambert, J G., C.A.S. Hall, et al. 2014. Energy, EROI and quality of life. Energy Policy 64:153–167.

Mearns, E. 2008. The global energy crisis and its role in the pending collapse of the global economy. Presentation to the Royal Society of Chemists, Aberdeen, Scotland. See http://www. theoildrum.com/node/4712

Murphy, D.J., C. Hall, M. Dale, and C. Cleveland. 2011. Order from chaos: a preliminary protocol for determining the EROI of fuels. Sustainability 3(10):1888–1907.

NEB. 2013. Canada’s energy future, energy supply and demand to 2035. Government of Canada National Energy Board.

Soderbergh, B., et al. 2007. A crash programme scenario for the Canadian oil sands industry. Energy Policy 35.

Weissbach, D., G. Ruprecht, A. Huke, K. Czerski, S. Gottlieb, and A. Hussein. 2013. Energy intensities, EROIs, and energy payback times of electricity generating power plants. Energy 52:1, 210–221.


Posted in Tar Sands (Oil Sands) | Tagged , , , | 2 Comments