From Horsepower to Horse Power. When Trucks stop, Horses start.

Preface. Before the industrial revolution there were only four sources of mechanical power of any economic significance. They were human labor, animal labor, water power (near flowing streams) and wind power.   Work done by animals, especially on farms, was still important at the beginning of the 20th century and remained significant until mid-century, when trucks and tractors displaced horses and mules (Ayres 2003).

Just as horses were indispensable the past millennia, so have the cars and trucks of the 20th century become essential to our way of life.  If one horsepower equals the power one horse can generate (this is roughly true), then the 268.8 million cars and trucks in the United States, let’s say with an average horsepower of 120 HP, then that’s nearly 32.3 billion horses.  If each needs an acre of pasture, then that’s over 50 million square miles of land. But the U.S. is only 3.5 million square miles.  Clearly we can’t go back to horses – except we have to at some point because oil is finite (I’m assuming you’ve read my book When Trucks Stop Running: Energy and the Future of Transportation to understand why biofuels, CTL, batteries, overhead wires, natural gas, and hydrogen can’t replace petroleum powered internal combustion engines).

Alice Friedemann   www.energyskeptic.com  author of “When Trucks Stop Running: Energy and the Future of Transportation”, 2015, Springer and “Crunch! Whole Grain Artisan Chips and Crackers”. Podcasts: Derrick Jensen, Practical Prepping, KunstlerCast 253, KunstlerCast278, Peak Prosperity , XX2 report

Eric Morris. April 1, 2007. “From Horse Power to Horsepower”. Access Magazine, University of California.

The horse was the dominant mode of transportation for thousands of years. Horses were absolutely essential for the functioning of the 19th-century city—for personal transportation, freight haulage, and even mechanical power. Without horses, cities would quite literally starve.

From 1800 to 1900, US per capita GDP rose from $1,148 to $4,676 (in 2000 dollars). This meant greater trade, and virtually all goods were, at some point in their journey, transported by horse. In ten major US cities, the number of teamsters rose 328 percent between 1870 and 1900, while the population as a whole rose only 105 percent. At first glance, it might seem as if the railroad would have offered relief from the horse pollution problem. But in fact it exacerbated it. Railroads were as much a complement for horses as a substitute for them. Nearly every item shipped by rail needed to be collected and distributed by horses at both ends of the journey. So as rail shipments boomed, so did shipments by horse. Ironically, railroads tended to own the largest fleets of horses in nineteenth-century cities.

This situation was made even worse by the introduction of the horse into an area from which it had been conspicuously absent: personal intra-urban transportation. Prior to the nineteenth century, cities were traversed almost exclusively on foot. Mounted riders in US cities were uncommon, and due to their expense, slow speeds, and jarring rides, private carriages were rare; in 1761, only eighteen families in the colony of Pennsylvania (population 250,000) owned one. The hackney cab, ancestor of the modern taxi, was priced far beyond the means of the ordinary citizen.

This changed with the introduction of the omnibus in the 1820s. Essentially large stagecoaches traveling fixed routes, these vehicles were reasonably priced enough to cater to a much larger swathe of the urban population. By 1853 New York omnibuses carried 120,000 passengers per day. Needless to say, this required a tremendous number of horses, given that a typical omnibus line used eleven horses per vehicle per day. And the need for horses was to spiral even further when omnibuses were placed on tracks, increasing their speeds by fifty percent and doubling the load a horse could pull. Fares dropped again, and passengers clamored for the new service. By 1890 New Yorkers took 297 horsecar rides per capita per year.

Horses need to eat. According to one estimate each urban horse probably consumed on the order of 1.4 tons of oats and 2.4 tons of hay per year. [7600 lbs/year = 21 lbs a day One contemporary British farmer calculated that each horse consumed the product of five acres of land, a footprint which could have produced enough to feed six to eight people. Probably fifteen million acres were needed to feed the urban horse population at its zenith, an area about the size of West Virginia. Directly or indirectly, feeding the horse meant placing new land under cultivation, clearing it of its natural animal life and vegetation, and sometimes diverting water to irrigate it, with considerable negative effects on the natural ecosystem.

And what goes in must come out. Experts of the day estimated that each horse produced between fifteen and thirty pounds of manure per day. For New York and Brooklyn, which had a combined horse population of between 150,000 and 175,000 in 1880 (long before the horse population reached its peak), this meant that between three and four million pounds of manure were deposited on city streets and in city stables every day. Each horse also produced about a quart of urine daily, which added up to around 40,000 gallons per day for New York and Brooklyn.

Horse manure is the favored breeding ground for the house fly, and clouds of flies hatched in it (one estimate is that three billion flies hatched in horse manure per day in US cities in the year 1900).

Flies are also potent disease vectors. Flies pick up bacteria and other pathogens on their feet, hairy appendages, and proboscides, then transmit them as they fly between filth and humans and their food. They also deposit germs through their feces and vomit. Flies transmit dozens of diseases, and studies have found that nineteenth century outbreaks of deadly infectious maladies like typhoid and infant diarrheal diseases can be traced to spikes in the fly population.

Horses killed in other, more direct ways as well. As difficult as it may be to believe given their low speeds, horse-drawn vehicles were far deadlier than their modern counterparts. In New York in 1900, 200 persons were killed by horses and horse-drawn vehicles. This contrasts with 344 auto-related fatalities in New York in 2003; given the modern city’s greater population, this means the fatality rate per capita in the horse era was roughly 75 percent higher than today. Data from Chicago show that in 1916 there were 16.9 horse-related fatalities for each 10,000 horse-drawn vehicles; this is nearly seven times the city’s fatality rate per auto in 1997.

The reason is that horse-drawn vehicles have an engine with a mind of its own. The skittishness of horses added a dangerous level of unpredictability to nineteenth-century transportation. This was particularly true in a bustling urban environment, full of surprises that could shock and spook the animals. Horses often stampeded, but a more common danger came from horses kicking, biting, or trampling bystanders. Children were particularly at risk.

In addition, the vehicles themselves (especially the omnibus) presented safety hazards. They were difficult to brake, and the need to minimize friction meant that they required large wheels. These made for top-heavy, ungainly carriages prone to capsizing, a problem exacerbated by winding street layouts. Moreover, drivers had a reputation for recklessness.

The clatter of horseshoes and wagon wheels on cobblestone pavement jangled nineteenth-century nerves.

Congestion was another problem. Traffic counts indicate that traffic across the nation more than doubled between 1885 and 1905. Not only was the number of vehicles rising rapidly, but the nature of the vehicles themselves caused tremendous problems. A horse and wagon occupied more street space than a modern truck. Obviously, horse-drawn vehicles traveled at very slow speeds, and horses, especially those pulling heavy loads or hitched in teams, started forward very slowly, a great difficulty in stop-and-go conditions. Streets of the era were not adequate to handle the traffic, and hills caused problems.

In addition, horses often fell, on average once every hundred miles of travel. When this took place, the horse (weighing on average 1,300 pounds) would have to be helped to its feet, which was no mean feat. If injured badly, a fallen horse would be shot on the spot or simply abandoned to die, creating an obstruction that clogged streets and brought traffic to a halt. Dead horses were extremely unwieldy, and although special horse removal vehicles were employed, the technology of the era could not easily move such a burden. As a result, street cleaners often waited for the corpses to putrefy so they could more easily be sawed into pieces and carted off. Thus the corpses rotted in the streets, sometimes for days, with less than appealing consequences for traffic circulation, aesthetics, and public health.

Falls were not the only reason horses expired in the streets. One might think it would be in the interest of horse owners to keep their animals in good condition; a horse was a fairly large capital investment. But unfortunately, economics caused owners to reach quite the opposite conclusion. Due to the costs of feeding the animals and stabling them on expensive urban land, it made financial sense to rapidly work a small number of horses to death rather than care for a larger group and work them more humanely. As a result, horses were rapidly driven to death; the average streetcar horse had a life expectancy of barely two years. In 1880, New York carted away nearly 15,000 dead equines from its streets, a rate of 41 per day.

In addition to frequent whippings and beatings from drivers, urban horses faced another peril: the condition of the street surfaces. Paved streets were far more slippery than the dirt roads they replaced. They were especially slick when wet or frozen. Horses, shod in iron shoes providing poor traction, frequently lost their step and tumbled, often to their deaths.

Stables were generally dark and lacked ventilation; some were rarely cleaned and reeked of excrement. Due to the expense of urban land, horses were crowded into them. This was not just uncomfortable; it was deadly as well, as it left horses open to the ravages of infectious disease. The Great Epizootic Epidemic of 1872 killed approximately five percent of the urban horses in the Northeast and debilitated many others. Transportation halted, food prices soared, goods piled up at the docks. Fire ravaged downtown Boston because there were not enough healthy horses to pull the fire trucks.

References

Ayres, R.U., et al. March 2003. Exergy, power and work in the US economy, 1900–1998. Energy Vol 28 #3 219-273.

Clay McShane. Down the Asphalt Path: The Automobile and the American City. (New York: Columbia University Press, 1994).

Lawrence H. Larsen, “Nineteenth-Century Street Sanitation: A Study of Filth and Frustration,” Wisconsin Magazine of History, vol. 52, no. 3, Spring 1969.

Clay McShane and Joel A. Tarr. “The Centrality of the Horse in the Nineteenth Century American City,” in The Making of Urban America, ed. Raymond A. Mohl (Wilmington DE: Scholarly Resources, 1997).

Nigel Morgan, “Infant Mortality, Flies and Horses in Later-Nineteenth-Century Towns:

A Case Study of Preston,” Continuity and Change, vol. 17, no. 1, 2002.

Joel A. Tarr, “The Horse: Polluter of the City,” in The Search for the Ultimate Sink: Urban Pollution in Historical Perspective, ed. Joel A. Tarr (Akron, Ohio: University of Akron Press, 1996).

Francis Michael Longstreth Thompson, ed. Horses in European Economic History: A Preliminary Canter (Great Britain: British Agricultural History Society, 1983).


Posted in Life Before Oil, Muscle Power | Tagged , , , | 8 Comments

Muscle Power

Preface. Below is a review of “Prime Mover: A Natural History of Muscle: from Natural History Magazine.

Since both my books explain why we will be returning to biomass and muscle power, here’s yet another preparation opportunity: breed horses and animal and human powered treadwheels. Or generate electricity from the 54 million gym members

Before fossil fuels, the energy to do work came from muscle power and the heat from burning biomass, mainly wood.  When I visited the Deutsches museum in Munich in 2017, I saw two animal treadmills. The first picture shows a dog treadwheel in a nailmaker’s workshop in 1850. The dog ran inside the “drum” with the treadwheel operating the bellow to fan the smith’s fire. When more fire was needed, the nailer shouted at the dog to make it run more quickly to fan the fire more strongly. Dog treadwheels were used at nailmaker’s until about 1930.

The picture below is a treadmill used by either horses or oxen in 1900 to drive farm machinery. The treadmill comprises an endless belt of wooden planks. Oxen or horses are roped to it in such a way that they are strangled if they do not continually walk on the belt. The rotary movement is taken up by a pulley. With a small working load a centrifugal brake ensures that the belt does not run too quickly. Treadmills were also built for two animals working side by side and for small animals, such as dogs or goats.

As you can see below, water, wind, firewood, and animal and human muscle power provided little power compared to coal from 1561 to 1859.

This image has an empty alt attribute; its file name is muscle-vs-coal-power.jpg

Figure 1. Annual energy consumption per person (megajoules) in 
England and Wales 1561-70 to 1850-9 and in Italy 1861-70.
Figure by Tony Wrigley, Cambridge University. Chart from Gail Tverberg's
post Rethinking Renewable Mandates

As fossil energy declines, muscle power will increasingly have to replace it.  Or as Vaclav Smil wrote in “Energy and Civilization”: “The simplest way of transporting loads is to carry them. Where roads were absent people could often do better than animals: their weaker performance was often more than compensated for by flexibility in loading, unloading, moving on narrow paths, and scrambling uphill. Similarly, donkeys and mules with panniers were often preferred to horses: steadier on narrow paths, with harder hooves and lower water needs they were more resilient. The most efficient method of carrying is to place the load’s center of gravity above the carrier’s own center of gravity-but balancing a load is not always practical. In relative terms, people were better carriers than animals. Typical loads were only about 30% of an animal’s weight (that is, mostly just 50-120 kg) on the level and 25% in the hills. Men aided by a wheel could move loads far surpassing their body weight. Recorded peaks are more than 150 kg in Chinese barrows where the load was centered right above the wheel’s axle.”

Alice Friedemann  www.energyskeptic.com  Author of Life After Fossil Fuels: A Reality Check on Alternative Energy; When Trucks Stop Running: Energy and the Future of Transportation”, Barriers to Making Algal Biofuels, & “Crunch! Whole Grain Artisan Chips and Crackers”.  Women in ecology  Podcasts: WGBH, Planet: Critical, Crazy Town, Collapse Chronicles, Derrick Jensen, Practical Prepping, Kunstler 253 &278, Peak Prosperity,  Index of best energyskeptic posts

***

Steven Vogel. 2003.  Prime Mover: A Natural History of Muscle. W. W. Norton   Reviewed in June 2004. Natural History Magazine

Today we have machines for making people move in place: run, walk uphill, push pedals back and forth or up and down, row, ski, or even climb a never-ending staircase. Machines that are designed to waste energy and that usually rely on still more energy, in the form of electricity, to run-who would have anticipated their popularity? Thanks to the ingenuity of these contraptions’ designers and purveyors (people who, one might say, live off the fat of the land), the toils of Sisyphus have been transformed into a healthful pastime.

Such machines mirror the ancient technology of animal-powered engines. Millennia ago, humans discovered that wheels could do something other than turn tables for shaping pottery or underpin a vehicle and that a domesticated animal could do something other than carry a load or pull a wagon. We figured out that animals could do lots of useful tasks by turning wheels that were fixed in place. In an era when the non-muscular power sources included only a few types of sails and waterwheels, such a realization was no small matter. The diverse devices that followed had in common a fixed position, rotational motion, and whole-animal muscle power. Few looked much like today’s fancy exercise machines. Some were designed to be powered by humans, others by (usually) domesticated animals, and a few by either (depending on availability) showing, perhaps, how little the inventors distinguished a serf, a slave, or a convict from other sources of involuntary labor.

We can recognize three major designs. In the oldest, a horizontal bar jutted from a vertical shaft. An animal attached to the bar turned the shaft by circling. Because the animal itself rotated, the machine needed no true crank, such as the kind we use to pedal bicycles. Sometimes the vertical shaft was itself part of the business end of the machine, as in systems that ground grain between stones. Sometimes a pair of gears connected the vertical shaft to a horizontal one, often to run a chain of buckets descending into a well.

In a second type, a human or a domestic animal worked within a huge hollow wheel, like a hamster in an exercise wheel. The motor thus climbed rather than pulled. A greater load on the wheel meant a greater resistance to its being turned, and this meant that the living motor had to climb farther up the inside of the wheel to keep it going. The increasing slope gave the wheel a neatly self-regulating character: the motor’s output was automatically matched with the load. Bipeds such as humans made particularly good motors, but these cage wheels didn’t require domesticated creatures-even bears, contend historians, could be pressed into service.

The third design also made an animal climb, but it used a moving sloped platform instead. This ancestor of our fitness treadmills presented severe mechanical challenges: its sliding platform had to support both an animal’s weight and the impact of its feet, as well as be durable and sufficiently flexible to go around revolving drums fore and aft. But the challenges were worth overcoming: its slope could be adjusted to match the motor with the load, and the variable slope made the machine less finicky about what sort of animal powered it. However, the engineering feats required to build such true treadmills meant that they were uncommon before the 19th century.

Not that the three basic designs exhausted the possibilities for muscle-powered engines: A person could sit on a plank and rotate an inclined disk by pushing the edge with his feet, or an animal could walk in place uphill on top of the disk. A person could pull downward on crossbars on the outside of a revolving vertical wheel (essentially replacing water on a waterwheel) or pull on a slack chain hung over such a wheel. Indeed, the makers of modern exercise equipment might profitably peruse the works of great Renaissance engineers such as Georgius Agricola, Agostino Ramelli, and Fausto Veranzio when deciding what new kinds of devices to unleash on the public.

Although muscle-powered engines are ancient, they originated long after chariots, carts, and potters’ wheels-probably about 4,000 years ago, in the Middle East or India. Their main use in that part of the world was (and remains) lifting water with a bucket chain, a task that demanded a reliable way to turn horizontal into vertical motion. The problem’s solution-putting a pair of gears at right angles to each other-was far from obvious, and this may have delayed its invention or adoption. Rotary grain mills needed no such gears, but these mills came into use later, perhaps initially invented by the Greeks about 400 B.C. By the first century A.D, the Romans used slaves and donkeys to power a highly effective version-their mola asinaria (asinine, or donkey, mill).

Revolving cage wheels may have been a Roman innovation. Unambiguous images of them occur on bas-reliefs, and remnants of the actual wheels have been found at Pompeii. As with rotary grain mills, humans and donkeys provided the energy. Such wheels powered cranes that lifted blocks into place during the building of tall structures. Centuries later, similar cranes helped a more technologically savvy culture erect the great medieval cathedrals.

Because wells and irrigation systems were widespread and the hulls of wooden ships usually leaked, pumping water was a common use of stationary muscle-driven engines. Sometimes these engines were used to lift water to heroic heights. In one Roman mine, a cascade of eight pairs of scoop wheels raised water almost a hundred feet. Grinding grain and lifting stonework were not these engines’ only other tasks; in medieval Europe they also ran sawmills, pile drivers, dough-kneading machines, dockside cranes, bellows, and even one wheel (powered by a dog) that turned a roasting spit.

Muscle-powered mechanical engines also provided an alternative to sails and oars for the propelling of boats. On China’s rivers, human-powered cage wheels drove paddle wheelers as long ago as the eighth century A.D, though this mating of two relatively efficient devices never caught on in the West. Here shipbuilders stuck with oars, but building large oar-powered ships proved difficult: no matter how many were added to power a bigger ship, the oars couldn’t keep pace with the increased drag of the vessel. Also, larger oars were heavy and clumsy to maneuver and required multiple oars-men. By contrast, paddle wheelers lose nothing by being big, and it’s easy to link the paddle wheel to the cage wheel amidships.

One form of animal-powered boat did appear in the West, mainly in eastern North America, during the first half of the nineteenth century. Shortly after steamboats came into use, horse-powered “teamboats” began serving as ferries across waterways such as New York’s Hudson River. They were less expensive than steam, more reliable than sail, and required none of the human labor–more scarce in the New World than in the Old–demanded by oars. In one design, two or more horses walked in a circle on deck, turning a capstan amidships that was geared to a paddle wheel set between a pair of catamaran-like hulls. Another version had a turntable below deck, with horses in fixed stalls and two paddle wheels, one on each side of a single hull.

Usually, however, the nineteenth century’s many muscle-powered engines operated away from water: in prisons and on the prairie. Penal versions abounded. In its entry for “treadmill,” the great Oxford English Dictionary, compiled at the century’s end, recognized only a penal application for the machines. Punishment and useful work-what a nice combination. British parliamentary commissions repeatedly examined and endorsed the treadmill’s safety and beneficial effects on the health of inmates.

Great Britain was not alone in using these mills as a correctional device. New York City began using one in Bellevue Penitentiary in about 1820. Eight prisoners climbed the wide rows of steps that formed a revolving drum, while four sat in reserve. Each team member (some were women) therefore worked two-thirds of the time. Still, treadmills remained relatively uncommon in America; the shortage of labor meant that humans were rarely employed as motors when other animals would do.

Used judiciously, however, a muscle-powered engine provided aerobic exercise to incarcerated people who otherwise would have lacked it. Furthermore, the engines supplied necessities, such as ground grain for prison bakeries. An 1824 report (“The History of the Treadmill,” by James Hardie) makes much of the safety of the New York wheel, and its assertions about the health of inmates using it don’t seem unreasonable. Inmates apparently received sufficient food for the work. But its punitive character is evident: the jailers claimed rapid attitude adjustments in formerly obstreperous prisoners. As Thomas Henry Huxley, famous defender of Charles Darwin, put it when complaining about an adversary, “I would willingly agree to any law which would send him to the treadmill.”

For size and technological audacity, nothing has ever come close to the agricultural machines used during the nineteenth century on the North American prairie. After about 1880, large “combines,” pulled by up to forty horses, reaped and threshed wheat as they moved through the fields. But in the preceding decades, the threshing of grain depended on stationary machines called sweeps, powered by as many as twenty horses pulling radial bars as they circled. The machine’s parts were brought to a threshing location the evening before the scheduled work was begun, and the thresher was assembled before dawn; after being run all day, it was dismantled and moved (by its own horses) to the next farm. While these big and otherwise sophisticated machines incorporated a novel level of portability, they also relied on the oldest of designs for muscle-powered engines.

Unlike the combines, most nineteenth-century American devices were relatively small, general- purpose machines powered by one to four horses or oxen. These often used the third basic design, a suspended treadmill of two rollers and an inclined “belt.” The belt consisted of wooden boards, laid perpendicularly to the animals’ path and hinged side-to-side, forming an endless moving platform that slid on greased tracks or small rollers positioned between the big front and rear rollers. A one- or two-animal model looked like an open horse trailer. This machine worked much like a modern tractor motor; it could be connected to various machines and could be pulled out of the barn and positioned wherever it was needed for chores such as sawing logs. These multipurpose units appeared in farm catalogs as late as 1890.

Smaller versions of the giant threshing sweeps also appeared as late as 1890. For some tasks, either a treadmill or a sweep was suitable. Sweeps, which were simpler and lighter relative to their potential power, demanded more goading of the driving animals, and many designs required that the animals step over a horizontal drive-shaft once during every revolution. Treadmills, which were more compact and easier to move and put to work than the sweeps, were harder on the animals’ hooves. But treadmills were advertised as being twice as effective, which was not an unreasonable claim: on an inclined belt, an animal works by lifting itself; attached to a sweep, a harnessed animal pulls-a less natural activity, severely constrained by the effectiveness of the harness.

Like other muscle-powered machinery, treadmill devices were not designed only for horses or oxen. Household (or dooryard) models even included a butter churn; the manufacturer asserted that dogs, goats, sheep, or children could power it.

Such devices demonstrate that mechanization needn’t involve muscle-displacing motorization. Nonetheless, by the end of the century, steam power had largely replaced muscle power. The small steam engines of the nineteenth century may have been less fuel-and weight-efficient than gasoline-powered engines, but in low-population areas they were a good solution. Engines in which steam pushed pistons operated at relatively low pressures and temperatures, so they could be built simply, of common metals, and were easy to repair. Furthermore, they could burn anything combustible. Farm museums across North America still display such steam engines-self-propelled tractors that could also work as stationary power sources, powering all the same accessories as the treadmills that preceded them.

How good were these ingenious animal-powered machines at making muscle do useful work?

Where humans worked against gravity, as they did inside cage wheels and upon treadmills, we can calculate the power outputs. As a benchmark, we might use data, first obtained in the eighteenth century by British scientists Jean Desaguliers and John Smeaton, of the power a human laborer could produce if working steadily all day: 90 to 100 watts. In contemporary terms, this means that if you attach a generator to an exercise machine, you can watch TV as long as you climb, pedal, or row.

By the same token, a Roman cage wheel sixteen feet in diameter and eight feet across accommodated six to eight men, who could, forty times per hour, jointly lift one ton a distance of twenty-seven feet-which equals a power output of 600 foot-pounds per second. Dividing that among eight workers, we calculate a power output per person of just over 100 watts. That figure attests both to respectable efficiency for the machine and to considerable effort for the workers (who may have worked in relays).

On the Bellevue Penitentiary treadmill, prisoners climbed on treads protruding from a wheel that was slightly over five feet in diameter and turned three times each minute. If one assumes that a typical prisoner weighed 132 pounds, then the prisoner must have worked at a power of almost 140 watts. Since the normal duty cycle allowed each prisoner to rest one-third of the time, the sustained output would have been a little over 90 watts-sustained, according to the report, for up to ten hours a day. That figure of 90 watts confirms the reported unpleasantness of the task. A similar output was demanded of nineteenth-century Australian convicts, who worked up to twelve hours per day; some said they’d rather hang than work their mill.

We can view that 90 watts in yet another context. At best, only about one-fourth of the energy in food emerges as useful mechanical work. Thus, laboring on the treadmill-sustaining 90 watts for ten hours-itself requires more than 3,000 Calories. So Bellevue’s inmates worked hard enough and long enough to require double the food intake of a normally active adult male.

Although nonhuman animals don’t complain and can be fed cheaper food, attaching them to machines greatly lessens their efficiency. Which animals give the best service? Biology tells us that bigger is better. The strength and power of muscle tissue vary little from animal to animal, and mammals all have about the same amount of muscle: about 40 percent of body weight. But larger creatures spend relatively less energy on basic body functions, and this increases the fraction of their food that can be appropriated for labor-so forget battalions of wheel-turning rodents. Insects put out lots of power for long periods while spending less on personal maintenance than even big mammals do; in particular, they don’t insist on staying warm when idle. Under laboratory conditions, flying insects such as fruit flies and migratory locusts have powered stationary engines with their beating wings. But even large insects remain impractically small for our purposes.

Nor can practicality be ignored at the other end of the scale. Elephants, whatever their potential efficiency, are awkwardly large. Oxen have given excellent service for millennia, and horses for a little more than a thousand years-since the invention of the horse collar, which enabled them to pull effectively-but only on sweeps and treadmills. Few if any tractable animals come close to the mechanical versatility of agile humans.

Today, only a few types of muscle-powered stationary engines remain in use. A “treadle pump” first disseminated in Bangladesh during the 1980s and now used by many farmers in Asia and sub-Saharan Africa) pumps water for irrigation; it’s run by a person who climbs what looks like a Stair-Master stair climber. More sophisticated and convenient I means of generating energy have largely taken the place of muscle-powered machinery Engines powered by fossil fuels require far less infrastructure than do working animals and come in a much wider i range of sizes and models. Still, why not take instruction from history and hook a generator to your exercise bike or rowing machine? That power source could run some entertainment device that performs only when you do likewise.

You Expect Me to Do Watt?

A worker doing hard physical labor all day long-or a felon turning a treadmill-can put out about 100 watts of power. That’s the output, in the form of a little light and a lot of heat, of the familiar light bulb. It’s a little more than the rate at which an inactive human heats a room. But to understand 100 watts of muscle power, one needs to turn to a quantifiable everyday task that humans do with reasonable efficiency. Climbing stairs fits that bill.

When you climb a flight of stairs, what’s your power output? Just multiply your weight in pounds by the height of each step in inches and by your climbing rate in steps per second, and then divide by 9. The last number takes care of gravity and converts the figure into watts. I weigh 140 pounds. When climbing seven-inch steps at two per second, I put out about 220 watts-a rate that I, an age-challenged man, can sustain only briefly. Ascending a down escalator, I work at 140 watts.

But what climbing rate corresponds to an output of 100 watts? Divide 900 by your weight in pounds and by the step height in inches; the resulting figure is how many steps per second you would have to climb. On seven-inch stairs, I’d have to ascend them at a little less than one step per second-trivial for the first couple of flights but a tiring regimen to keep up for even an hour.

What about fuel? We’re at best only about 25 percent efficient, so an output of 100 watts requires a minimum input of 400 watts, which translates (when we multiply by 0.86) into about 350 Calories per hour. Burning a tenth

1  pound of good fuel-fat-yields 350 Calories, so working at 100 watts for eight hours costs less than a pound of body fat-still nearly double a human male’s normal energy use.

By any technological yardstick, we animals, whether horses or humans, are strange engines. For a difficult task of only a few seconds’ duration, a person can put out thousands of watts–many times the 746 watts in one official horsepower. For tasks lasting a few minutes, a fit human can generate perhaps 1,000 watts. For an activity that must be sustained for an hour, output drops to around 300; for an activity kept up all day, 150 watts is about the maximum. But by physiological standards, horses and humans (and dogs but not cats) sustain especially high power outputs. Fleet-footed ancestors bequeathed us the lungs and hearts that let us work long and hard.

Figure 1. Annual energy consumption per person (megajoules) in England and Wales 1561-70 to 1850-9 and in Italy 1861-70. Figure by Tony Wrigley, Cambridge University.
Posted in Agriculture, Energy Books, Life Before Oil, Muscle Power, What to do | Tagged , | 3 Comments

Challenges to the Integration of Renewable Resources at High System Penetration

Preface.  This overview of challenges for wind and solar written in 2010 is still true today. We are far from being able to reach even a 50% renewable grid (excluding hydropower from the total) given the lack of storage, the problem that the best wind and solar are far from towns and cities – too far to justify extending transmission lines, we lack a “smart grid” system due to the many challenges of processing huge amounts of data, and so on.

California is up to 29% renewable power, but it is terribly seasonal, and not dependable for more than half of the year, when the majority of power needs to come from fossil fuels, mainly natural gas.

I liked this paper because it is less technical than most papers on this topic, probably because it was written for policymakers.

Alice Friedemann   www.energyskeptic.com  author of “When Trucks Stop Running: Energy and the Future of Transportation”, 2015, Springer and “Crunch! Whole Grain Artisan Chips and Crackers”. Podcasts: Derrick Jensen, Practical Prepping, KunstlerCast 253, KunstlerCast278, Peak Prosperity , XX2 report

***

Meier, Alexandra von. 2010. Challenges to the Integration of Renewable Resources at High System Penetration. California Energy Commission, California Institute for Energy and Environment. Publication number: CEC-500-2014-042.

Renewable and distributed resources introduce space (spatial) and time (temporal) constraints on resource availability and are not always available where or when they are wanted. Although every energy resource has limitations, the constraints associated with renewables may be more stringent and different from those constraints that baseload power systems were designed and built around.

These unique constraints must be addressed to mitigate problems and overcome difficulties while maximizing the benefits of renewable resources. New efforts are required to coordinate time and space within the electric grid at greater resolution or with a higher degree of refinement than in the past.

This requires measuring and actively controlling diverse components of the power system on smaller time scales while working toward long-term goals. These smaller time scales may be hourly or by the minute, but could also be in the milli- or even microsecond range. It also important to plan and design around the diverse details of local distribution circuits while considering systemic interactions throughout the Western interconnect.


Temporal coordination specifically addresses the renewable resources time-varying behavior and how this intermittency interacts with other components on the grid where not only quantities of power but rates of change and response times are crucially important.

Research needs for temporal coordination relate to: resource intermittence, forecasting and modeling on finer time scales; electric storage and implementation on different time scales; demand response and its implementation as a firm resource; and dynamic behavior of the alternating current grid, including stability and low-frequency oscillations, and the related behavior of switch-controlled generation. Different technologies, management strategies and incentive mechanisms are necessary to address coordination on different time scales.

A challenge to “smart grid” coordination is managing unprecedented amounts of data associated with an unprecedented number of decisions and control actions at various levels throughout the grid.

More work is required to move from the status quo to a system with 33 percent of intermittent renewables. The complex nature of the grid and the refining temporal and spatial coordination represented a profound departure from the capabilities of the legacy or baseload system. Any “smart grid” development will require time for learning, especially by drawing on empirical performance data as they become available. Researchers concluded that time was of the essence in answering the many foundational questions about how to design and evaluate new system capabilities, how to re-write standards and procedures accordingly, how to create incentives to elicit the most constructive behavior from market participants and how to support operators in their efforts to keep the grid working reliably during these transitions. Addressing these questions early may help prevent costly mistakes and delays later on.


Renewable and distributed resources introduce space or location (spatial) and time (temporal) constraints on resource availability. It is not always possible to have the resources available where and when they are required

New efforts will be required to coordinate these resources in space and time within the electric grid.

A combination of economic and technical pressures has made grid operators pay more attention to the grid’s dynamic behaviors, some of which occur within a fraction of an alternating current cycle (one-sixtieth of a second). The entire range of these relevant time increments in electric grid operation and planning spans fifteen orders of magnitude: from the micro-second interval on which a solid-state switching device operates, to the tens of years it may take to bring a new fleet of generation and transmission resources online or as a billion seconds (Figure 1).

Figure 2: Distance Scales for Power System Planning and Operation

Because of their unique properties, any effort to integrate renewable resources to a high penetration level will push outward time and distance scales on which the grid is operated. For example, it will force distant resource locations to be considered as well as unprecedented levels of distributed generation on customer rooftops. The physical characteristics of these new generators will have important implications for system dynamic behavior. In extending the time and distance scales for grid operations and planning, integrating renewable resources adds to and possibly compounds other, pre-existing technical end economic pressures.


This white paper explains some of the crucial technical challenges, organized as temporal and spatial refinement of energy and information management. It identifies areas that are poorly or insufficiently understood, and where a clear need exists for new or continuing research.

Work must proceed simultaneously on multiple fronts.

The fact that solar and wind power are intermittent and non-dispatchable is widely recognized. More specifically, the problematic aspects of intermittence include the following:

High variability of wind power. Not only can wind speeds change rapidly, but because the mechanical power contained in the wind is proportional to wind speed cubed, a small change in wind speed causes a large change in power output from a wind rotor.

High correlation of hourly average wind speed among prime California wind areas.  With many wind farms on the grid, the variability of wind power is somewhat mitigated by randomness: especially the most rapid variations tend to be statistically smoothed out once the output from many wind areas is summed up. However, while brief gusts of wind do not tend to occur simultaneously everywhere, the overall daily and even hourly patterns for the best California wind sites tend to be quite similar, because they are driven by the same overall weather patterns across the state.

Time lag between solar generation peak and late afternoon demand peak.  The availability of solar power generally has an excellent coincidence with summer-peaking demand. However, while the highest load days are reliably sunny, the peak air-conditioning loads occur later in the afternoon due to the thermal inertia of buildings, typically lagging peak insolation by several hours.

Rapid solar output variation due to passing clouds. Passing cloud events tend to be randomized over larger areas, but can cause very rapid output variations locally. This effect is therefore more important for large, contiguous photovoltaic arrays (that can be affected by a cloud all at once) than for the sum of many smaller, distributed PV arrays. Passing clouds are also less important for solar thermal generation than for PV because the ramp rate is mitigated by thermal inertia (and because concentrating solar plants tend to be built in relatively cloudless climates, since they can only use direct, not diffuse sunlight).

Limited forecasting abilities. Rapid change of power output is especially problematic when it comes without warning.

In principle, intermittence can be addressed by firming resources, including o reserve generation capacity

  • dispatchable generation with high ramp rates o generation with regulation capability
  • dispatchable electric storage o electric demand response that can be used in various combinations to offset the variability of renewable generation output. Vital characteristics of these firming resources include not only the capacity they can provide, but their response times and ramp rates.

Figure 3: Load Duration Curve Filled with Renewables


Figure 3 suggests that while the integration of renewable resources at very high system penetration may present some serious problems, matching generation with load on an hourly basis, at least from the theoretical standpoint of resource availability, is probably not one of them. Rather, the more critical technical issues seem to appear at finer time resolution, as illustrated in Figure 4.

One problematic aspect is resource forecasting on a short time scale. Solar and wind power forecasting obviously hinges on the ability to predict temperature, sunshine and wind conditions. While weather services can offer reasonably good forecasts for larger areas within a resolution of hours to days, ranges of uncertainty increase significantly for very local forecasts.

Figure 1: Resource Modeling and Forecasting Time Scales

Needed:

  • Real-time forecasting tools for wind speed, temperature, total insolation (for PV) and direct normal insolation (for concentrating solar), down to the time scale of minutes
  • Tools for operators that translate weather forecast into renewable output forecast and action items to compensate for variations.

The most responsive resources would include hydroelectric generators and gas turbines.

The more difficult question is how much of each might be needed. Electric storage includes a range of standard and emerging technologies:

  • pumped hydro
  • stationary battery banks
  • thermal storage at solar plants
  • electric vehicles o compressed air (CAES)
  • supercapacitors
  • flywheels
  • superconducting magnetic (SMES)
  • hydrogen from electrolysis or thermal decomposition of H2O

The spectrum of time scales for different storage applications is illustrated in Figure 5.

  • months: seasonal energy storage
  • 4-8 hours: demand shifting
  • 2 hours: supplemental energy dispatch o 15-30 minutes: up- and down-regulation
  • seconds to minutes: solar & wind output smoothing
  • sub-milliseconds: power quality adjustment; flexible AC transmission system (FACTS) devices that shift power within a single cycle

3.1 Transmission Level: Long-distance Issues

The need for transmission capacity to remote areas with prime solar and wind resources is widely recognized.


We know where the most attractive resources are – and they are not where most people live.

On the technical side:  

  • Long-distance a.c. power transfers are constrained by stability limits (phase angle separation) regardless of thermal transmission capacity
  • Increased long-distance a.c. power transfers may exacerbate low-frequency oscillations (phase angle and voltage), potentially compromising system stability and security

Simply adding more, bigger wires will not always provide increased transmission capacity for the grid. Instead, it appears that legacy a.c. systems are reaching or have reached a maximum of geographic expansion and interconnectivity that still leaves them operable in terms of the system’s dynamic behavior.

Further expansion of long-distance power transfers, whether from renewable or other sources, will very likely require the increased use of newer technologies in transmission systems to overcome the dynamic constraints.

Needed:

  • Dynamic system modeling on large geographic scale (WECC) providing analysis of likely stability problems to be encountered in transmission expansion scenarios
  • benefit potential of various d.c. link options
  • Continuing R&D on new infrastructure materials, devices and techniques that enable transmission capacity increases, including
  • dynamic thermal rating
  • power flow control, e.g. FACTS devices
  • fault current controllers
  • intelligent protection systems, e.g. adaptive relaying
  • stochastic planning and modeling tools
  • new conductor materials and engineered line and system configurations

Brown, Merwin, et al., Transmission Technology Research for Renewable Integration, California Institute for Energy and Environment, University of California, 2008, provides a detailed discussion of these research needs.

With all the research needs detailed in this white paper, the hope is that questions addressed early may help prevent costly mistakes and delays later on. The more aggressively these research efforts are pursued, the more likely California will be able to meet its 2020 goals for renewable resource integration.

Posted in Electric Grid, Solar, Wind | Tagged , , , , , , | Comments Off on Challenges to the Integration of Renewable Resources at High System Penetration

Vaclav Smil. Making the modern world: materials and dematerialization

Preface.  I can’t believe I read this book, it is just a long litany of the  gigantic amounts of materials we exploit, with no analysis, implications, or the meaning of what impact this will have on the planet.

I certainly don’t expect anyone to read even this shortened version of his book, but it might be worthwhile to skim for an idea of how much material we’re consuming.

As I point out in my review of the United Nations 2016 report Global material flows and resources productivity” here, in order to accommodate an additional 2 billion people in 2050, material consumption will need to nearly triple to 180 billion tonnes of materials, almost three times today’s amount. If 180 billion tonnes grows in the future at a 5% compound rate, in 497 years the entire earth will be consumed, all 5.972 x 10²¹ tonnes of it, and we’ll be floating in outer space.

After reading this book, it’s hard to believe there’s anything left to exploit, though here it is 5 years later and the earth is still being pillaged.  But from Smil’s gargantuan numbers and the exponential exploitation of just about everything, clearly this will end badly.  The issue of peak sand has been in the news more frequently lately, which is essential for civilization to make concrete, computer chips, solar PV, and fracking.

Smil covers a wide range of materials that are essential to civilization that you may not have thought much about, and all the myriad uses of silicon, plastics, nitrogen, aluminum, steel, hydrogen, ammonia, cement, and more.  All of them made possible by oil.  All of them essential for civilization, so if one fails….(Liebig’s law of the minimum).

Nor can we avoid our predicament by recycling. Smil states that While some metals can be reused indefinitely (albeit with some mass losses) recycling of most materials often entails considerable loss of quality and functionality”.

Alice Friedemann   www.energyskeptic.com  author of “When Trucks Stop Running: Energy and the Future of Transportation”, 2015, Springer and “Crunch! Whole Grain Artisan Chips and Crackers”. Podcasts: Derrick Jensen, Practical Prepping, KunstlerCast 253, KunstlerCast278, Peak Prosperity , XX2 report

***

Vaclav Smil. 2013. Making the Modern World: Materials and Dematerialization.  Wiley.

An overwhelming majority of people lived in pre-modern societies with only limited quantities of simple possessions that they made themselves or that were produced by artisanal labor as unique pieces or in small batches – while the products made in larger quantities, be they metal objects, fired bricks and tiles, or drinking glasses, were too expensive to be widely owned. The principal reason for this limited mastery of materials was the energy constraint: for millennia our abilities to extract, process, and transport biomaterials and minerals were limited by the capacities of animate prime movers (human and animal muscles) aided by simple mechanical devices and by only slowly improving capabilities of the three ancient mechanical prime movers: sails, water wheels, and wind mills.

An updated inventory, with data for aggregate categories extending until 2006, was published in 2009 (Matos 2009) and data on individual elements, compounds, and materials are updated annually (USGS 2013).

the series does not include materials contained in traded finished goods: given their mass and variety their tracking would be very difficult.

The ships that made the first Atlantic crossings were remarkably light: a Viking ship (based on a well-preserved Gokstad vessel built around 890 CE) required the wood of 74 oaks (including 16 pairs of oars).

The Egyptian pyramids at Giza are unique: Khufu’s pyramid not only remains the largest stone structure ever built (195 m high, it required 2.5 million stones whose average weight was 2.5 t) but this mass of more than 6 Mt of stone

Romans are credited with the invention of concrete, but this is an inaccurate attribution. Concrete is a mixture of cement, aggregates (sand, pebbles), and water and cement is a finely ground mixture of lime, clay, and metallic oxides fired in kilns at a high temperature. There was no cement in Roman opus cementitium and hence this sturdy mixture, strong enough to build large vaults and domed structures, was not the material now known as concrete. Opus cementitium contained aggregates (sand, gravel, stones, broken bricks, or tiles) and water but its bonding agent was lime mortar (Adam, 1994). The combination of slaked lime and volcanic sand from the vicinity of Puteoli near Mount Vesuvius (pulvere puteolano, later known as pozzolana), produced a superior mixture that could harden even under water and that could be used to build not only massive and durable walls but also spectacular vaults.

The most consequential material development in antiquity was the ability to smelt and to shape a growing array of metals. All of this devastated local and regional wood resources, and copper smelting was a leading cause of Mediterranean deforestation, particularly in Spain and Cyprus.

[We still live in] the Iron Age, with the total consumption of other metals adding up to a small fraction of iron use.

Global population increased by less than 60% during the 500 years between 1000 and 1500 but then more than doubled (from about 460 million to nearly a billion) by 1800 – but remained overwhelmingly rural, with cities accounting for less than 5% of all humanity

Fuel-wasting fireplaces and braziers resulted in a huge demand for fuelwood and charcoal to heat the expanding cities of the pre-coal era. In Paris, the demand rose from more than 400,000 loads of wood in 1735 to more than 750,000 loads in 1789 (about 1.6 Mm3) and the same amount of charcoal, prorating to more than a ton of fuel per capita (Roche, 2000).

Wood remained indispensable not only for building houses and transportation equipment (carts, wagons, coaches, boats, ships) but also—as iron smelting rose in parts of Europe—for charcoal production for blast furnaces (substitution by coke began only during the latter half of the eighteenth century and was limited to the UK). And as Europe’s maritime powers (Spain, Portugal, England, France, and Holland) competed in building large ocean-going vessels—both commercial and naval—the increasing number of such ships and their larger sizes brought unprecedented demand for the high-quality timber needed to build hulls, decks, and masts.

With wooden hulls, masts, and spars being as much as 70% of the total mass (the remainder was divided among ballast, supplies, sails, armaments, and crew) these pioneering vessels contained 60–75 t of sawn timber (Fernández-González, 2006).

Iron production in small blast furnaces required enormous quantities of charcoal and combined with inefficient wood-to-charcoal conversion this led to widespread deforestation in iron-smelting regions: by 1700 a typical English furnace consumed 12 000 t of wood a year (Hyde, 1977).

Only during the mid 1950s that Alastair Pilkington introduced the molten tin bath that allowed production of very large pieces of flat glass with near-perfect uniformity

By 1900 the railroads on five continents added up to 775,000 km, with about 250,000 km in Europe, more than 190,000 km in the USA, 53,000 km in Russia, and 30,000 km in the UK (Williams, 2006). Given the wide range of terrains covered by rail tracks it is impossible to estimate a typical volume of bulk construction materials – earth displaced and replaced to create cuts or embankments, stone cut to create tunnels or incision in mountainsides, and stone quarried to produce gravel for access roads and rail beds – that had to be handled for an average kilometer of new track. Even a highly conservative assumption of 3000 m3/km would result in nearly 2.5 Gm of bulk materials associated with the global railway construction of the second half of the nineteenth century. A similarly conservative assumption of at least 2000 t of ballast (crushed stones packed underneath and around ties) per kilometer would translate to at least 1.5, and more likely to 2 Gt, of coarse gravel applied to hold in place the tracks built between 1830 and 1900. Mineral aggregates were also needed in unprecedented volumes for the building of new factories, for the expansion of ports, and for the construction of hard-top roads.

All ties (sleepers) installed during the nineteenth century were wooden; concrete sleepers were introduced only around 1900 but remained uncommon until after World War II. Standard construction practice requires the placement of about 1900 sleepers per km of railroad track, and with a single tie weighing between roughly 70 kg (pine) and 100 kg (oak) every kilometer needed approximately 130–190 t of sawn (and preferably creosote-treated) wood. My calculations show that the rail tracks laid worldwide during the nineteenth century required at least 100 Mt of sawn wood for original construction and at least 60 Mt of additional timber for track repairs and replacements (Smil, 2013).

Rails used during the nineteenth century weighed between 20 and 30 kg/m and, assuming an average of 25 kg/m, the railway construction between 1850 and 1900 would have required about 20 Mt of steel, while replacement would have more than doubled that total. Steel became the favorite material for railway bridges:

Because of their renewability, annually harvested crop residues used to be indispensable materials in all traditional agricultural societies. In many deforested regions they were the only source of household fuel, straw–clay mixtures were made into bricks and straw bundles were used for roof thatching, in some countries peasants wore straw sandals and coats, and cereal straws were used as both feed and bedding for domesticated ruminants

There are no reliable data about the final fate of crop residues: in many agroecosystems they should be directly recycled to maintain soil organic matter and to prevent erosion, but often their mass is judged to be excessive and they are simply burned in fields. This undesirable practice is particularly common in rice-growing regions of Asia. Straw continues to be burned even in some affluent countries, most notably in Denmark where about 1.4 Mt of wheat straw (nearly a quarter of the total harvest) is used for house heating or even in centralized district heating and electricity generation (Stenkjaer, 2009).

A global aggregate of around 40 EJ in 2000 is thus a good consensus value and implies a nearly 70% increase in biomass fuel demand between 1950 and 2000 and a doubling of wood and crop residue harvests during the twentieth century. But the intervening high population growth greatly reduced the average per capita consumption and the huge expansion of fossil fuel extraction cut the biofuel share from 50% in 1900, to less than 10% of global primary energy supply in the year 2000, and (because of inferior efficiencies of wood and straw combustion) to less than 5% in terms of useful final energy supply. Among the major economies, wood has the highest national share of primary energy supplies in Brazil, at about 10%, while its share in affluent nations ranges from negligible values (just 1% in the UK and Spain) to about 20% in Sweden and Finland, with the US share falling from about 4.5% in 1950 to just 2% in 2010

Wooden railway ties, that quintessential nineteenth-century innovation, maintained their high share of the global market throughout the twentieth century. During the 1990s, 94% of America’s ties were wooden.


Better treatment of ties prolonged their average lifespan from about 35 years in 1940 to 40–50 years by the year 2000 (James, 2001). European and North American tie markets have been basically limited to replacements, mostly reinforced concrete

But most reinforced concrete has not gone into iconic structures but into ever-increasing numbers of nondescript or outright ugly (or brutal looking) apartment buildings, high rises, factories, garages, roads, overpass bridges, and parking lots.

Much more steel (in the form of sheets and rods) has gone into cars and trucks and new transportation infrastructures on land (ranging from multi-lane highways and bridges to new airports) and into the construction of large oil tankers, bulk carriers (transporting anything from grain to ores), and, starting in the 1960s, container ships and ports. Steel allows particularly captivating design of long suspension bridges with woven cables supporting lengthy road spans:

The transportation sector also became the leading user of aluminum: the combination of light weight and durability made the metal, and its alloys, an ideal choice for applications ranging from cooking pots to rapid train cars,

The fourth most important metal has been zinc, with a consumption of 12.6 Mt in 2010; but the steadily rising demand for lead has brought this formerly more distant number five close to the zinc total: in 2011 the global refined lead supply surpassed, 10 Mt for the first time, to reach 10.6 Mt, with about 45% being primary metal and the rest coming from recycled material

With a total of just over 1 billion cars and light and heavy trucks, and with an average mass of 10 kg Pb in automobiles and 13 kg Pb in truck batteries, there was nearly 11 Mt of lead on the world’s roads in 2010.

Silicon makes nearly 28% of the Earth’s crust, and while it is abundantly present as SiO2 (silica) in sand, sandstone, and quartz and in many silicates ranging from hard feldspars (rock-forming minerals) to soft kaolinite (a layered clay mineral), it is never found in pure, unbound elementary form. But the purest crystalline silicon is the material foundation of modern electronics: intricate webs of semiconductors

Global production of all plastics

265 Mt in 2010:

we could not have supported the twentieth century global increment of 4.5 billion people consuming increasingly better diets without a huge increase in nitrogen applications.

Global output of synthetic fertilizers (in terms of pure N): 85.13 Mt in and 2000, an increase of two orders of magnitude (roughly 570 times) in 80 years.

Global output of synthetic fertilizers (in terms of pur nitrogen) rose from just 150,000 tonnes in 1920 to 3.7 million tonnes in 1950 and 85.13 million tonnes in 2000, an increase of two orders of magnitude (roughly 570 times) in 80 years.

Remarkably that was not even an exceptionally large gain, as the global production of other new materials saw even greater increases over the course of the 20th century:

  • three orders of magnitude for aluminum (roughly 3600 times, from just 6800 t in 1900 to 24.3 Mt in 2000)
  • four orders of magnitude for plastics (from about 20,000 t in 1925 to 150 Mt in 2000).
  • 30 times more production of paper and steel (from 28.3 to 850 Mt)
  • 27 times more copper (from 495 000 t to 13.2 Mt)

In comparison, the global population increased 3.8 times between 1900 and 2000, and the gross world product (in constant monies) rose about 20-fold,

The annual output of bovine (cattle and water buffalo) hides surpasses 6 Mt, that of sheep and lambskins over 400,000 t, and some 300,000 t of goat and kidskins are turned into leather product annually (FAO, 2011). Production of wool, the most important animal fiber, rose from about 960 000 t in 1950 to 2.9 Mt in 1970, fluctuated afterwards (peaking at 3.3 Mt in 1990), and declined to just below 2 Mt in 2011 (FAO, 2013). In contrast, production of silkworm cocoons has more than doubled during the past 50 years, to about 500 000 t in 2010.

30% of humanity continues to live in structures whose material, locally available clay, has not undergone any elaborate processing and that can be made without any modern energy inputs.

Production of all durable soil- or earth-based materials requires firing in kilns, with temperatures ranging from less than 500 °C for low-quality bricks to as much as 1100 °C for ceramic tiles, 1300 °C for vitrified bricks, and 1400 °C for glass, while the pyro-processing of Portland cement requires 1400–1450 °C (Berge, 2009).

Sequential washing, screening, crushing, and dewatering eliminate any organic matter and clay and produce a specific coarseness of material with low moisture. The best available estimates indicate that, in the USA, 41% of construction sand and gravel ends up as concrete aggregates, a quarter of the total is destined for road building, 13% for construction fill, and 12% for asphaltic concrete and similar mixtures (USGS, 2012). The small remainder is used for filtration, snow and ice control on roads (some municipalities also use salt), railroad ballast and golf courses, as well as for replenishment of eroding beaches

The construction of the US Interstate Highway System was a major component of this rising demand (USGS, 2006). About 60% of these multi-lane highways are paved in concrete whose standard thickness is 28 cm and hence 1 km of a four lane highway (each lane is 3.7 m wide) requires about 4150 m3. This adds up to roughly 10,000 t of concrete for every kilometer and the entire system of 73,000 km embodies about 730 Mt of concrete in driving lanes, with more emplaced in shoulders, medians, approaches, and overpasses.

Global compilations of CO2 emissions from the cement industry show its contribution almost 5% in 2010 (CDIAC, 2013).

Concrete (particularly its reinforced form) is now by far the most important manmade material both in terms of global annual production and cumulatively emplaced mass.

While this material provides shelter and enables transportation and energy and industrial production, its accumulation also presents considerable risks and immense future burdens. These problems arise from the material’s vulnerability to premature deterioration that results in unsightly appearance, loss of strength, and unsafe conditions that sometimes lead to catastrophic failures, and whose prevention requires expensive periodic renovations and eventually costly dismantling. Concrete, both exposed and buried, is not a highly durable material and it deteriorates for many reasons (AWWS, 2004; Cwalina, 2008; Stuart, 2012). Exposed surfaces are attacked by moisture and freezing in cold climates, bacterial and algal growth in warm humid regions (biofouling recognizable by blackened surfaces), acid deposition in polluted (that is now in most) urban areas, and vibration. Buried concrete structures (water and sewage pipes, storage tanks, missile silos) are subjected to gradual or instant overloading that creates cracks, and to reactions with carbonates, chlorides, and sulfates filtering from above. Poor-quality concrete can show excessive wear and develop visible cracks and surficial staining due to efflorescence in a matter of months. Alternations of freezing and thawing damage both the horizontal surfaces (roads, parking) that collect standing water, as well as vertical layers that collect water in pores and cracks. While concrete’s high alkalinity (pH of about 12.5) limits the corrosion of the reinforcing steel embedded in the material, as soon as that cover is compromised (due to cracks or defoliation of external layers) the expansive corrosion process begins and tends to accelerate. Chloride attack (on structures submerged in seawater, from deicing of roads, in coastal areas from NaCl present in the air in much higher concentrations than inland) and damage by acid deposition (sulfate attack in polluted regions) are other common causes of deterioration, while some concretes exhibit alkali-silica and alkali-carbonate reactions that lead to cracking. Unsightly concrete blackened by growing algae embedded in the material’s pores is a common sight in all humid (especially when also warm) environments. Given the unprecedented rate of post-1990 global concretization, it is inevitable that the post-2030 world will face an unprecedented burden of concrete deterioration.


This challenge will be particularly daunting in China, the country with by far the highest rate of new concrete emplacement, where the combination of poor concrete quality, damaging natural environment, intensive industrial pollutants, and heavy use of concrete structures will lead to premature deterioration of tens of billions of tons of the material that has been poured into buildings, roads, bridges, dams, ports, and other structures during the past generation. Because maintenance and repair of deteriorating concrete have been inadequate, the future replacement costs of the material will run into trillions of dollars. To this should be added the disposal costs of the removed concrete: some concrete structures have been recycled but the separation of the concrete and reinforcing metal is expensive. The latest report card on the quality of American infrastructure gives poor to very poor grades to all sectors where concrete is the dominant structural material:

with an estimated investment of at least $3.6 trillion needed by 2020 in order to prevent further deterioration (ASCE, 2013).

Transposed to post-2030 China, this reality implies the need for an unprecedented rehabilitation and replacement of nearly 100 Gt of concrete emplaced during the first decade of the twenty-first century, at a cost of many tens of trillions of dollars.

The world’s impervious surface area (built-up, paved) at about 580 000 km2: that is less than 0.5% of ice-free surface, but an area equal to Kenya. In per capita terms, high-income countries in northern latitudes had the largest areas of impervious surfaces (Canada 350 m2, USA 300 m2, Sweden 220 m2)

Of course, not all impervious surfaces are concrete but the material accounts for their largest share.


In 2010, humanity put in place close to 40 Gt of them (dominated by 33 Gt of concrete and 4.5 Gt of bricks), an equivalent of at least 17 km3. For comparison, the volume of one of the world’s best known mountains, Japan’s Fuji, is about 400 km3

By the year 2000 the global output of iron ore, pig iron, and steel had reached new global records: at 1 Gt/year iron ore extraction was surpassed only by the output of fossil fuels and bulk construction materials, pig (cast) iron production rose to nearly 600 Mt, and at roughly 850 Mt/year steel output was about 30 times higher than in 1900. That total was also almost 20 times larger than the aggregate smelting of aluminum, copper, zinc, lead, and tin, and in per capita terms it rose from less than 20 to about 140 kg/year. Demand for copper increased by a similar rate (27-fold, to 13.2 Mt) and zinc production rose almost 20-fold, from about 480 000 t to 8.77 Mt (Kelly and Matos, 2013).

Gold output rose nearly 7-fold, but in absolute terms it amounted only to about 2600 t in the year 2000, compared to 18,100 t for silver,

Polyethylene (PE) is by far the most important thermoplastic (it accounted for 29% of the world’s aggregate plastic output, or roughly 77 Mt, in 2010), polypropylene (PP) comes next (with about 19% or 50 Mt in 2010), followed by polyvinyl chloride (PVC, about 12% or 32 Mt in 2010).

In 2010, packaging consumed almost 40% of the total (mostly as various kinds of PE and PP), construction about 20% (mostly for plastic sheets used as vapor barriers in wall and ceiling insulation), the auto industry claimed nearly 8% (interior trim, exterior parts), and the electrical and electronic industry took about 6% (mostly for insulation of wires and cables).

All of these products begin as ethane. In North America and the Middle East ethane is separated from natural gas, and low gas prices and abundant supply led to surplus production for export and favored further construction of new capacities: in 2012 Qatar launched the world’s largest LDPE plant and, largely as a result of shale gas extraction, new ethylene capacities are planned in the USA (Stephan, 2012). The dominant feedstock for ethane in Europe, where prices of imported natural gas are high, is naphtha derived by the distillation of crude oil.

Transparent or opaque bags (sandwich, grocery, or garbage), sheets (for covering crops and temporary greenhouses), wraps (Saran, Cling), and squeeze bottles (for honey), HDPE garbage cans, containers (for milk, detergents, motor oil), and toys (including Lego bricks). Among a myriad of hidden PE applications are HDPE for house wraps (Tyvek) and water pipes; PEX for water pipes and as insulation for electrical cables; and UHMWPE for knee and hip replacements.

Other plastic uses:

  • massive LDPE water tanks
  • indoor–outdoor carpeting to lightweight fabrics woven from PP yarn and used particularly for outdoor apparel,
  • insulated wires, water, and sewage pipes to food wraps and her car’s interior and body undercoating
  • disposable and surgical gloves, flexible tubing for feeding, breathing and pressure monitoring, catheters, blood bags, IV containers, sterile packaging, trays, basins, bed pans and rails, thermal blankets, lab ware (Smil, 2006, p. 131)
  • construction (house sidings, window frames), for outdoor furniture, water hoses, office gadgets, toys,

Plastics have a limited lifespan in terms of functional integrity: even materials that are not in contact with earth or water do not remain in excellent shape for decades. Service spans are no more than 2–15 years for PE, 3–8 years for PP, and 7–10 years for polyurethane; among the common plastics only PVC can last two or three decades and thick PVC cold water pipes can last even longer (Berge, 2009).

[In conclusion, then, it is clear] plastics, [and the fossil fuels they are derived from], are indispensable for the functioning of modern civilization.

Industrial Gases

The three most important elements – oxygen, hydrogen, and nitrogen – deserve such ranking because without them we could not produce steel in the most efficient way, and could not have our modern petrochemical and nitrogen fertilizer industries. Other elements and compounds classified as industrial gases include acetylene, argon, carbon dioxide, helium, neon, and nitrous oxide.

Without the synthesis of ammonia (predicated on large-scale supply of pure nitrogen) we would not be able to feed billions of people, and without oxygen we could not produce most of the world’s most important alloy. Ammonia synthesis is the world’s largest consumer of nitrogen: in 2010 it required 130 Mt of the gas (about 112 Gm3 of N2). Nitrogen’s other key uses as a feedstock include ammonia for the synthesis of nitric acid, hydrazines, and amines.


Nitrogen cooling of metal parts enables tight assembly fits and, in reverse, it allows the taking apart of closely-fitted parts. With the expansion of modern electronics, nitrogen found a new market in those instances (particularly during soldering) when it is necessary to reduce the presence of oxygen and to maintain a clean atmosphere (by 1985 this use claimed 15% of US consumption).

Ferrous metallurgy is by far the largest user of oxygen: the gas is blown into blast furnaces, EAFs, and BOFs

Chemical syntheses (above all ethylene oxidation) are the second largest market, and oxygen is also used in smelting color metals (lead, copper, and zinc furnaces), in the construction material industries (producing a more intense flame and reduced fuel use in the firing of glass, mineral wool, lime, and cement),

Argon, the cheapest truly inert gas, goes into incandescent and fluorescent lights

Hydrotreating, hydrodesulfurization, and hydrocracking used to process roughly 3.7 Gt of oil in 2010 claimed (assuming that H2 demand averaged 0.5% of the total crude input, or roughly 60 m3/t) about 20 Mt of the gas.

Hydrogen

Industrial gases are used in sectors that account for more than half of the world’s economic output and the value of their production has been growing faster than the growth rate of the global economy: in 2000 their global market was worth about $34 billion, a decade later it had nearly doubled as it exceeded $60 billion, and it is heading to about $80 billion by 2015

Liquid hydrocarbons (principally naphtha) are the feedstock for hydrogen production in crude oil refineries where the gas is needed for the catalytic conversion of heavier fractions to lighter fuels, and also in order to comply with ever stricter environmental regulation and to desulfurize the refined products.

Synthesis of ammonia remains the leading user of hydrogen, followed by refinery needs

Post-1950 expansion was rapid, with global ammonia synthesis rising from less than 6 Mt in 1950, to about 120 Mt in 1989, 164 Mt in 2011 (USGS, 2013).

Two-thirds (65–57%) of all synthesized NH3 has been recently used as fertilizer, with the total global usage more than tripling since 1970, from 33 to about 106 Mt N in 2010. Because ammonia is a gas under ambient pressure, it can be applied to crops only by using special equipment (hollow steel knives), a practice that has been limited to North America. The compound has been traditionally converted into a variety of fertilizers (nitrate, sulfate) but urea (containing 45% N) has emerged as the leading choice, especially in rice-growing Asia, now the world’s largest consumer of nitrogenous fertilizers; ammonium nitrate (35% N) comes second.

Compared to traditional harvests, the best national yields of these three most important grain crops have risen to about 10 t/ha for US corn (from 2 t/ha before World War II), 8–10 t/ha for European wheat (from about 2 t/ha during the 1930s), and 6 t/ha for East Asian rice (from around 2 t/ha).


High-yielding US corn now receives, on average, about 160 kg N/ha, European winter wheat more than 200 kg N/ha, and China’s rice gets 260 kg N/ha, which means that in double-cropping regions annual applications are about 500 kg N/ha. According to my calculations, in the year 2000 about 40% of nitrogen present in the world’s food proteins came from fertilizers that originated from the Haber–Bosch synthesis of ammonia (Smil, 2001).

The rising use of nitrogen had to be accompanied by a rising use of the other two essential macronutrients

Agricultural phosphate consumption: 20.3 Mt P in 2010.

Potassium is obtained mostly by underground mining of sylvinite, a mixture of about a third KCl and two-thirds NaCl; Saskatchewan has the largest reserves of the rock and is the leading global producer. Worldwide extraction (expressed in terms of K2O equivalent) rose to nearly 34 Mt by 2010, with Canada (nearly 10 Mt) and Russia (more than 6 Mt) being the largest producers and worldwide exporters. About 85% of all KC ends up as fertilizer.

Silicon

The raw material for producing silicon is abundant, but an energy-intensive high-temperature deoxidization with carbon – SiO2 + 2C + Si + 2CO (using graphite electrodes in electric furnaces) – is required to yield element that is 99% pure. But even 99% purity is quite unacceptable for solar and electronic industries, and hence the metallurgical-grade Si has to undergo elaborate and costly processing that makes it many orders of magnitude purer in order to meet the specifications for producing semiconductors, solar cells, and optical fibers (Föll, 2000).

In 1965, when the number of transistors on a microchip had doubled to 64 from 32 in 1964, Gordon Moore predicted that this rate of doubling would continue,

By 2012 the count reached 5 billion in Xeon Phi Coprocessor (Intel, 2012). Mass deployment of these increasingly powerful microprocessors in conjunction with increasingly capacious memory devices has transformed every sector of modern economies thanks to unprecedented capacities for communication, control, storage, and retrieval of information.

Wafer shipments for semiconductor applications rose from just $4 billion in 1977 to  $292 billion in 2012 (SIA, 2013).

During the first decade of the twenty-first century, electronics ceased to be the major consumer of high-grade silicon as most of that material now ends up in PV cells.

There are hundreds of PV-powered satellites used for weather and Earth monitoring, telecommunication, and spying;

The best commercially available models are rated at 19–22% (NREL, 2013; Solarplaza, 2013). For decades, PV cells were made with off-grade polycrystalline material that was not good enough for electronic applications, but as the heavily subsidized market for PV installation rose from less than 100 MW/year in 1995 to more than 10 GW/year in 2009, it was necessary to divert increasing amounts of purified polycrystalline metal into the solar cell industry. In 1997 the industry used only 800 t of such metal, by 2009 it required 69,100 t, three times as much as consumed by electronics, to produce about 44,500 t of solar cells, mostly by the casting of polycrystalline metal (Takiguchi and Morita, 2011).

While some metals can be reused indefinitely (albeit with some mass losses) recycling of most materials often entails considerable loss of quality and functionality.

Increasing burdens of environmental pollution and the critique of economic thinking that tended to ignore such matters. Ayres et al. (1969, pp. 283–84), describing the reality in clear physical terms, noted that such omissions “may result in viewing the production and consumption processes in a manner that is somewhat at variance with the fundamental law of the conservation of mass,” and pointed out the obvious consequences for the environment, namely that in the absence of trade and net stock accumulation “the amount of residuals inserted into the natural environment must be approximately equal to the weight of basic fuels, food, and raw materials entering the processing and production system, plus oxygen from the atmosphere.” But it took nearly two decades before this admonition was transformed into the first fairly comprehensive studies of material requirements on a national level, as it was only during the late 1990s that several research teams began to reconstruct direct material inputs (DMIs) as well as outflows, and total material requirements (TMRs) of the world’s leading affluent economies. Fischer-Kowalski et al. (2011)

There are other approaches to the investigation of material flows; one attempts to trace the life-cycles of individual commodities on a national, regional, or global level; another looks at the energy costs of commodities and products; and yet another traces the environmental impacts of their production, use, and abandonment (or recycling). Life-cycle assessments (or analyses, in either case the acronym is LCA) have been performed at different scales for many elements and compounds – for example, chlorine by Ayres (2008) and polyvinyl chloride (PVC) by the European Commission (EU, 2004) – and for products ranging from aluminum cans (Mitsubishi, 2005) to steel truck wheels (Alcoa, 2012).

Limiting the account to DMI will greatly underestimate the overall resource demand in all modern economies engaged in intensive international trade, and particularly in such major powers as the USA, Germany, or Japan that rely on imports for large shares of many materials. Correcting this by the inclusion of net imports of all raw materials is only a partial (and increasingly deficient) solution, because many metals and other minerals are not imported in the form of ores or concentrates or bulk shipments but are instead embodied in finished products. Identifying the specific material content of these products (even their limited inventory would run to many hundreds of individual machines, tools, components, and consumer items) presents a major challenge – but the adjustment should not end there, as many items imported from a particular country contain components made of materials in a number of other countries that, in turn, imported parts or raw materials from yet another country or, more likely, a set of countries.

The global on-line database and most of the global and national studies of material flows have been produced by a small group of researchers from Austria and Germany and that most of them have been published in just two sources, in the Journal of Industrial Ecology and in Ecological Economics.

I question the utility of constructing these all-encompassing national or global flow accounts because I am not sure what other revealing conclusions to derive from these summations of disparate input and output categories besides the obvious confirmations of substantial differences in national aggregates and in the rates of long-term growth. Of course, the maximalist aggregates of the all-encompassing variety also have an undoubted heuristic and curiosity value and they do convey the truly massive scale of global mobilization of raw materials.

Half a dozen studies of global material extraction at the beginning of the twenty-first century, that include all harvested biomass, all fossil fuels, ores and industrial minerals, and all bulk construction materials (but exclude hidden flows, water, or oxygen), cluster fairly tightly around 50 Gt/year. This is hardly surprising given the fact that these studies derive the flows from the same sets of data:

with roughly 18 Gt coming from biomass, 10 Gt from fossil fuels, nearly 5 Gt from ores and other minerals, and more than 17 Gt from bulk construction materials.

given the uncertainties in estimating the mass of bulk construction minerals (above all for the extraction of sand and gravel) that account for at least two-thirds of the all material flows, the mass of 0.5 Gt is well within the minimal range of estimation error

and the total of roughly 25 Gt thus remains my preferred aggregate of directly used global materials in the year 2000. That total prorates to just over 4 t of materials per person (the global population was 6.08 billion in the year 2000), with at least 2.5 t (and perhaps as much as 3 t) accounted for by bulk construction materials and only about 0.8 attributed to all metals and nonmetallic minerals. These rates compare to nearly 1 t of food and feed crops (fresh weight), close to 0.5 t of wood (excluding fuelwood), and about 1.7 t of fossil fuels (roughly 0.8 t of coal, 0.6 t of crude oil, and 0.3 t of natural gas) extracted for every inhabitant of the world in the year 2000.


pre-1950 global totals are nothing but questionable estimates, and even the recent aggregates depend critically on what is included. For example, Krausmann et al. (2009) put the worldwide biomass extraction (crops, their residues, roughages, and wood) at 19.061 Gt in 2005, while in my detailed account of phytomass harvest (Smil, 2013) I showed that in the year 2000 the total for woody phytomass alone could be anywhere between 2 and 13.4 Gt depending on the boundaries chosen for the analysis.

Consequently, there can be no single accurate total, as the search for global totals will be always determined by assumptions, and even if everybody agrees on common boundaries the basic results will be largely predictable. Physical realities dictate that the mass of sand and gravel used to emplace and maintain modern concrete-based infrastructures must be substantially greater than the mass of metallic ores; and that the mass of iron, a metal of outstanding properties produced from abundant ores with a moderate energy intensity, must be orders of magnitude higher than the mass of titanium, an even more remarkable metal but one derived from relatively rare ores with a great energy expense. At the same time, it must be kept in mind that data for inexpensive, readily available bulk construction materials (particularly for sand and gravel) that are usually sold not far from their points of extraction are generally much less reliable than the statistics for metal ores and industrial nonmetallic minerals that are globally traded.

the world now consumes in one year nearly as much steel as it did during the first post-World War II decade, and (even more incredibly) more cement than it consumed during the first half of the twentieth century.

little guidance for future decision-making (beyond the obvious point that the recent high growth rates cannot continue for many decades).

Useful insights can be gained from two kinds of finer focus: through closer examination of material flows on the national level, and by putting more restrictive analytical boundaries on the set of examined materials and tracing the flows of individual commodities with some clear goals in mind. This can be done by detailing their uses, dispersal, and persistence in a society, and by attempting life-cycle analyses of those materials that circulate on a human timescale, that is by quantifying their direct and indirect requirements for energy or by identifying and assessing the environmental impacts of their production and use.

During the twentieth century, natural growth potentiated by immigration increased the US population nearly 4-fold (3.7), and the country’s GDP (expressed in constant monies) was 26.5 times higher in 2000 than in 1900: not surprisingly, the combination of these two key factors drove absolute consumption increases in all material categories, with the multipliers ranging from 1.7 for materials produced by agriculture to more than 90 for nonrenewable organics (and 8 for primary metals, 34 for industrial minerals, and 47 for construction materials). The importance of renewable materials (wood, fibers, leather) fell from about 46% of the total mass (when bulk construction materials are included) or 74% (with stone, sand, and gravel excluded) in 1900 to just 5% (or 22%) for analogical rates in the year 2000, a trend that was expected given the increasing reliance on light metals and plastics. Aggregate wood demand rose less than 1.4-fold during the twentieth century, but consumption of primary paper and paperboard multiplied about 19 times and was supplemented by rising quantities of recycled paper: when the data collection in the latter category began in 1960, recycled paper accounted for about 24% of all paper and paperboard use, but by the year 2000 its share was up to 46% even as large quantities of waste paper are exported (in 2000 this amounted to about 22% of all domestic collections), primarily to China (FAO, 2013).

The fact that bulk minerals used in construction (crushed stone, sand, and gravel) have increasingly dominated America’s annual flows during the twentieth century – in 1900 they accounted for 38% all materials, by 2006 their share reached 77% – is not surprising given the enormous expansion of material-intensive transportation infrastructures after World War II. Construction of the Interstate system began in 1956 and required the building of many new bridges (USDOT, 2012), while the introduction of commercial jetliners led to the rapid expansion of airports, a process recently repeated in China. Large demands for bulk construction materials also came from the building of new container ports, stream regulation (above all in the Mississippi basin), electricity generation (hydroelectric dams, nuclear power plants), new factories, commercial real estate (warehouses, shopping centers), and housing. The mass of construction materials used in the USA rose about 7-fold between 1900 and 1940 and then doubled between 1945 and 1951, doubled again by 1959 to 1.1 Gt, but the next doubling, to 2.26 Gt, took until 1997.

End-use data indicate that the largest identifiable category of sand and gravel consumption (about a fifth of the total surpassing 1 Gt/year) is as aggregate added to cement in the production of concrete, followed by road base and coverings, fill, and as aggregate added to asphaltic and bituminous mixtures; but unspecified uses make up the largest category, accounting for about a quarter of the total. Differently-sized aggregates used in the production of concrete are also the leading final uses for crushed stone, and railroad ballast is another indispensable application. With a ballast minimum depth of 15 cm and up to 50 cm for high-speed lines, and an overall width of roughly 4.5 m, this amounts commonly to more than 1000 m3/km or (with density of 2.6 t/m3) to around 3000 t of crushed stone per kilometer.

In comparison to construction sand, the total use of industrial sand is minuscule but qualitatively very important. Annual consumption has recently fluctuated around 25 Mt/year: about 40% of this total is pure silica used in glassmaking, and a fifth goes to foundries to make moldings and refractories as well as silicon carbide for flux and metal smelting. Smaller but functionally irreplaceable uses include abrasives used in blasting and sanding, sands for water filtration, and sands for creating artificial beaches and sporting areas. A new, and rapidly rising, market is for the special kinds of sands used in hydraulic fracturing of gas- and oil-bearing shales, well-packing, and cementing.


390 Mt in 2010. Its largest constituents include salt (about 55 Mt in 2010), phosphate rock (about 30 Mt), nitrogen (about 14 Mt), and sulfur (about 11 Mt). America’s salt consumption is remarkably high (20% of the world total in 2010); the two dominant uses (each about 18 Mt in 2010) are production of alkaline compounds and chlorine, and for road deicing; amounts an order of magnitude smaller (both about 1.8 Mt) are used in food production and in animal feed, and more than 1 Mt/year is used in water treatment (in water-softening to remove mineral ions).

Consumption of 10.3 Mt of primary metals in 1900

by the year 2000, with total metal consumption at nearly 144 Mt, they supplied 44%.

I must reiterate that actual domestic US consumption of virtually all metals is, often significantly, higher than shown by the USGS balances because substantial amounts of various metals reach the country embedded in products, and that presence is excluded from nationwide aggregates of apparent domestic consumption. Major components of these unaccounted flows include not only such leading metals as steel and aluminum in cars, airplanes, machinery, and appliances, but also such toxic heavy metals as lead in automotive lead-acid (PbSO4-H2SO4) batteries and cadmium in rechargeable Ni-Cd batteries.

In 1900, the total consumption of nonrenewable organics (mostly paving materials and lubricating oils) was less than 2 Mt, but subsequent extension of paved highways, mass ownership of cars, the rise of the trucking industry, and, above all, rapid expansion of crude oil- and natural gas-based synthetic materials made this the fastest growing material category in the USA: by 1950 the flow surpassed 30 Mt and by 1999 it had reached 150 Mt, with nearly two thirds being hydrocarbon feedstocks (naphtha and natural gas) used to make ammonia, the starting compound for all synthetic nitrogen fertilizers. The second largest input by mass is asphalt and road oil; consumption of these paving and surfacing materials rose from less than 10 000 t in 1900 (when few paved roads existed outside cities) to 100 times that mass in less than two decades, it reached more than 10 Mt by 1950 and, until the 2008 recession, it was on the order of 30 Mt/year.

In aggregate terms, the USGS accounts translate to a domestic consumption of about 1.9 t/capita in 1900, 5.6 t in 1950, and 12 t/capita in the year 2000; after leaving out bulk construction materials these rates are reduced, respectively, to 1.2, 2.3, and 3 t/capita, which means that the use of construction materials rose from about 0.7 t/capita in 1900 to 3.3 t in 1950, and 9 t in the year 2000. Wood is the only material category showing a century-long decline of per capita consumption, from about 800 kg in 1900 to about 400 kg by 1950 and about 300 kg/capita in 2000. Materials produced by agriculture rose slightly from 40 to 47 kg/capita during the first half of the twentieth century, but afterwards they declined to just 18 kg

Consumption of all metals has shown a similar pattern, rising from 135 kg in 1900 to 515 kg/capita in 1950, but by the year 2000 were essentially the same at 510 kg/capita (once more a somewhat misleading rate given the country’s large post-1970 net imports of cars, airplanes, and machinery).

In comparison with the USA, the EU-27 has similar metal consumption (0.4 vs. 0.5 t/capita) but a much lower demand for construction minerals (4.6 vs. nearly 10 t/capita), a difference that is due mostly to the continent’s much higher population density and more compact transportation infrastructure.


According to official statistics, between 1980 and 2010 China’s annual rate of economic growth was only below 5% three times (1981, 1989, and 1990) and was above 10% 16 times, while the average for the three decades was 9.6% (IMF, 2013). This implies a doubling every 7.3 years resulting in a 2010 GDP (in constant prices) 17.8 times higher than in 1980. In per capita terms, the multiple was still roughly 13-fold (NBSC,

The pace of China’s frenzied concretization and its overall scale has been stunning. In 1980 the country produced just short of 80 Mt of cement, a decade later it had more than doubled the total to about 210 Mt, by the year 2000 it rose to 595 Mt and by 2010 that total had tripled and reached 1.88 Gt (nearly 24 times the 1980 total and 57% of the global production for less than 20% of the world’s population), and it rose further to 2 Gt in 2011 (NBSC, 2013).

such a pace of construction guarantees that a substantial share of newly poured concrete will be of substandard quality, a conclusion confirmed by the obvious dilapidation of China’s concrete structures built during the late 1980s and the early 1990s,

The quality of concrete used to construct many of China’s new dams (by 2010 the total stood at more than 87,000 structures of all sizes including the world’s largest dam, Sanxia) is of particular concern, even more so as thousands of them are located in areas of repeated, vigorous seismic activity.

raw steel output rose 17.2 times between 1980 and 2010, from 37.1 Mt in 1980 to 637.4 Mt in 2010, when it accounted for nearly 45% of the global output (WSA, 2013). But as the extraction of iron ores increased about 14 times (from 75 000 t to 1.07 Gt) an increasing share of this output has come from imported materials. In 2010, China imported 618 Mt of iron ore, more than a third of the total input into its blast furnaces, and it has been by far the largest iron ore importer (nearly 60% of the global total and close to 70% of the domestic demand) with Australia and Brazil being the major suppliers. And while the country has been the near-monopolistic exporter of rare earths and a major exporter of molybdenum and magnesium (also of graphite), it has been also the world’s largest importer of bauxite (44 Mt in 2010) and, at nearly 1.2 Mt in 2010, of copper ores and concentrates.

the material category that has seen the greatest production increase has been the synthesis of plastics, with a nearly 70-fold rise between 1980 and 2010. Of course, that large multiple is due to a rapid development from a very low base (less than 900 000 t in 1980) but the absolute output of 62 Mt in 2010 was larger than the production of about 57 Mt in EU27 (Europe Plastics, 2011).

The need to secure more food and better nutrition for a still-growing population has led to substantial gains in the production (and imports) of fertilizers. New Haber–Bosch plants were added to raise the output of nitrogenous fertilizers from 10.3 Mt N in 1980 to 45.2 Mt in 2010, but in 2009 the record output was 48.6 Mt N, a nearly 5-fold increase in three decades, while production of phosphate fertilizers posted a roughly 8-fold increase to 19 Mt. Disparity between N and P growth rates is explained by China’s attempt to move away from excessive nitrogen uses toward more balanced fertilization with N:P:K ratios improving the efficiency of applications. As a result, China has been buying record amounts of potash from Canada. China has also become a prominent importer of materials for recycling, and the USA has been their greatest supplier. In 2010, Chinese imports of waste paper were nearly 25 Mt/year, with the USA as the leading exporter (Magnaghi, 2011). Similarly, in 2010 China bought almost 6 Mt of scrap steel – becoming the world’s third largest importer of the material after Turkey and South Korea (WSA, 2013) – with the USA again as the leading supplier. This trade is certainly one of the most remarkable indicators of changing national fortunes, as the world’s largest affluent economy has become the primary supplier of waste materials to the second largest economy experiencing a rapid rate of growth. In 2011 the USA exported more than $11 billion of waste and scrap (materials belonging to the 910 category of the North American Industry Classification System) to China. This was less than the exports of transportation equipment or agricultural products – but more than the exports of all nonelectric machinery and more than five times as much as the shipments of all electrical equipment and appliances (Smil, 2013). China is also the world’s largest importer of plastic and electronic waste.

Before any materials can start flowing through economies, energies must flow to power their extraction from natural deposits or their production by industrial processes ranging from simple mechanical procedures to complex chemical reactions. These energies belong to two distinct streams: direct flows of fuels and electricity used to energize the production processes (producing mechanical energy, heat or pressure and lighting, and electronically controlling a process) and indirect flows (embedded energies) needed to produce the requisite materials, machines, equipment, and infrastructures.

the energy needed to smelt a ton of iron from its ore in a blast furnace (as coke and supplementary coal, gas, or oil) will be vastly greater than energy embedded in the furnace’s steel, lining, and charging apparatus and prorated per unit of output. Modern blast furnaces can operate without relining for two decades, and during that time can produce tens of millions of tons of hot metal. Similarly, the energy needed to create the combination of high temperature and pressure that is required by many chemical syntheses will be far greater that any prorated energy embedded in the initial construction of reaction vessels, pipes, boilers, compressors, and computerized controls. This explains why the second category of flows is almost always neglected

Most appraisals of energy costs have followed one of two distinct approaches: either a quantification based on input–output tables of economic activities, or a process analysis that traces all important energy flows needed to produce a specific commodity or manufactured item. In the first instance, relevant prices are used to convert values of energy flows in a matrix of economic inputs and outputs (for major industrial sectors or, where available, disaggregated to the level of product groups or individual major products) to energy equivalents in order to assemble direct and indirect energy requirements. In contrast to this aggregate approach, process analysis can focus on a particular product in specific circumstances as it identifies all direct energy inputs and as many relevant indirect needs as possible, a process that is in itself quite valuable as a management tool. As with all appraisals that deal with complex inputs and encompass sequential processes, the setting of analytical boundaries will affect the outcome of process analysis. In most cases, the truncation error inherent in counting only direct energy inputs (purchased fuels and electricity) will be small, but in some instances it could be surprisingly large. For example, Lenzen and Dey (2000) found the energy costs of Australian steel to be 19 GJ/t with process analysis, but 40.1 GJ/t with input–output analysis.

Another complication is introduced due to increasing shares of globally traded commodities and products: in some cases the additional energies required for import of raw materials and export of finished products will be a negligible share of the process energy cost, in other cases their omission will cause a serious undercount. For example, two identical looking steel beams used at two construction sites in New York may have two very different histories: the first being a domestic product made by the scrap-EAF-continuous (electric arc furnace) casting route in an integrated operation in Pennsylvania, the other coming from China where Australian iron ore and coke made from Indonesian coal were smelted in a blast furnace in one province and the beams were made from ingots in another one before loaded for a trans-Pacific shipment and then transported by railroads across the continent. Approximate energy costs of long-distance transportation can be easily calculated by assuming the following averages (all in ton-kilometers for easy comparability, ranked from the highest rates to the lowest): air transport 30 MJ, diesel-powered trucks (depending on their size) mostly between 1 and 2.5 MJ, diesel-powered trains 600–900 kJ, electricity-powered trains 200–400 kJ, smaller cargo ships 100–150 kJ, and large tankers and bulk cargo carriers just 50 kJ/tkm (Smil, 2010). Obviously, energy-intensive air shipments will be restricted to high value-added products, while bringing iron ore by a bulk carrier from a mine 3000 km from a Chinese blast furnace would entail energy expenditure equal to less than 10% of overall requirements for steel production – while the energy cost of shipping construction stone from Europe or Asia to the USA may be equal to 25–50% of the energy used to cut and polish it. These realities should be kept in mind when examining and comparing the values reviewed in this section. Energy costs – presented here in a uniform way as gigajoules per ton (GJ/t) of raw material or product –as with any analytical tool, they alone cannot be used to guide our choices and preferences of material use without concurrent considerations of affordability, quality, durability, or esthetic preference; if the latter were to be ignored concrete, a material of low energy intensity, would rule the modern world even more than it actually does.

The energy cost of market-ready lumber (timber) is low, comparable to the energy cost of many bulk mineral and basic construction materials produced by their processing. Tree felling, removal of boles from the forest, their squaring and air drying will add up to no more than about 500 MJ/t, and even with relatively energy-intensive kiln-drying (this operation may account for 80–90% of all thermal energy) the total could be as low as 1.5 and more than 3.5 GJ/t (including cutting and planing) for such common dimensional construction cuts as 2 × 4 studs used for framing North American houses.

The low energy cost of wood is also illustrated by the fact that, in Canada, the energy cost of wood products represents less than 5% of the cost of the goods sold (Meil et al., 2009). Energy costs on the order of 1–3 GJ/t are, of course, only small fractions of wood’s energy content that ranges from 15 to 17 GJ/t for air-dry material. Obviously, the energy cost of wood products rises with the degree of processing (FAO, 1990). Particle board (with a density between 0.66 and 0.70 g/cm3) may need as little as 3 GJ/t and no more than 7 GJ/t, with some 60% of all energy needed for particle drying and 20% for hot pressing.

The energy cost of papermaking varies with the final product and, given the size and production scale of modern papermaking machines (typically 150 m long, running speeds up to 1800 m/min., and annual output of 300 000 t of paper), is not amenable to drastic changes (Austin, 2010). Unbleached packaging paper made from thermo-mechanical pulp is the least energy-expensive kind (as little as 23 GJ/t); fine bleached uncoated paper made from kraft pulp consumes at least 27 GJ/t and commonly just over 30 GJ/t (Worrell et al., 2008). Most people find it surprising that this is as much as a high-quality steel.

Recycled and de-inked newsprint or tissue can be made with less than 18 GJ/t, but the material is often down-cycled into lower quality packaging materials.

Construction aggregates whose production requires only extraction and some physical treatment (sorting, sizing, crushing, milling, drying) have generally very low to low energy costs, and higher fuel and electricity use comes only with the pyro-processing required to make bricks, tiles, glass, and, above all, cement. The energy cost of natural stone products is low, usually just around 500 MJ/t for quarried blocks, somewhat less for crushed stone, but twice as much for roughly cut or split stones,

The energy costs of sand extraction and processing can easily vary by a factor of 2, but even the higher costs leave them in the category of the least energy-intensive materials when compared in mass terms. The simplest mining and preparation sequence to produce fairly clean sand and uniformly-sized sand may require no more than 100 MJ/t, and even more costly gravel sorting (or crushing as needed) should have an energy cost well below 500 MJ/t. The highest energy input is required for the preparation of the industrial sand that is used in glassmaking, ceramics and refractory materials, metal smelting and casting, paints, and now also increasingly in hydraulic fractioning of gas- and oil-bearing shales: its moisture must be reduced (in heavy-duty rotary or fluidized-bed dryers) to less than 0.5%, and this may consume close to 1 GJ/t. Bricks fired in inefficient rural furnaces in Asia may require as much as 2 GJ/t, just 1.1–1.2 GJ/t is typical for Chinese enterprises (Global Environmental Facility, 2012; Li, 2012) while US production of high-quality bricks requires 2.3 GJ/t (USEPA, 2003). Cement production is fairly energy-intensive because of high temperatures required for the thermo-chemical processing of the mineral charge. Limestone supplies Ca and other oxides, and clay, shale, or waste material provide silicon, aluminum, and iron; in order to produce a ton of cement about 1.8 t of raw minerals are ground and their mixture is heated to at least 1450 °C.

This sintering process combines the constituent molecules, and the resulting clinker is ground again with the addition of other materials to produce 1 t of clinker that is then ground to produce fine Portland cement. Fly ash (captured in coal-fired power plants) or blast furnace slag can be used to lower the amount of clinker. Additional energy is to needed to rotate large kilns. These inclined (3.5–4 °) metal cylinders are commonly around 100 m, up to 230 m, long, with diameters of 6–8 m, and they turn typically at 1–3 rpm, with the charged raw material moving down the tube against the rising hot gases (Peray, 1986; FLSmidth, 2011). Disaggregation of all energy inputs shows that the extraction of minerals (limestone, clay, shale) and their delivery to cement kilns is a minimal burden. Kiln feed preparation is electricity-intensive as crushing and grinding of the charge consumes about 25–35 kWh/t and the grinding and transportation of the finished product (clinker) claims at least 32–37 kWh/t (Worrell and Galitsky, 2008). This leaves the bulk of energy consumption for the pyro-processing, a sequence of water evaporation, decomposition of clays to yield SiO2, decomposition of limestone or dolomite (calcination) that releases CaCO3, formation of belite (Ca2SiO4, making up about 15% of clinker by mass), and finally sintering, production of alite (Ca3O·SiO4, that makes up some 65% of the clinker mass) (Winter, 2012). Total energy use in cement production varies with the principal fuel used, the origin of the electric supply, and the method of production. Average specific energy consumption in the cement industry has declined as a more efficient dry process replaced the old wet method. The highest electricity consumption in the dry process is for the grinding of raw materials and clinker and for the kiln and the cooler, in aggregate more than 80% of the total that averages mostly between 90 and 120 kWh/t of cement (Madlool et al., 2011). Heating of dry kilns (mostly with coal, petroleum coke, and waste materials in the USA, and with coal in China) consumes between mostly 3 and 4 GJ/t; the range is 3.0–3.5 GJ/t for kilns with four or five stages of preheating, while a six-stage process could work with as little as 2.9–3 GJ/t (IEA, 2007; Worrell and Galitsky, 2008).

World best practice can now produce Portland cement with total primary energy inputs of 3.3–3.5 GJ/t, while the rates for fly-ash cement and blast furnace slag cement can be as low as, respectively, 2.4 and 2.1 GJ/t (Worrell et al., 2008). In contrast, many plants in low-income countries still need around 4.5 GJ/t for Portland cement.

Energy requirements for glass production range mostly between 4 and 10 GJ/t, with about 7 GJ/t being a typical value

the energy cost of ceramic products rises with the degree of pyro-processing and the quality of items: unglazed tiles need only 6 GJ/t, glazed tiles up to 10 GJ/t, fine ceramics as much as 70 GJ/t,

The usual approach for quantifying the energy costs of the iron and steel industry is to include the energy costs of coke, pelletizing and sintering of ore, iron and steel making, cold and hot rolling, and galvanizing and coating; this leaves out the energy costs of coal and ore mining and transportation, of such energy-intensive inputs as electrodes and refractories, as well as the embodied energy cost of scrap metal. Analyses performed (more or less) within these boundaries show that average energy consumption in the global steel industry was about 20 GJ/t by the year 2000 (Yellishetty et al., 2010).

A review of best industry practices for the entire iron–steel sequence ended up with 16.3–18.2 GJ/t for the blast furnace-BOF-continuous (basic oxygen furnace) casting route, 18.6 GJ/t for direct iron reduction followed by EAF steelmaking and thin-slab casting, and 6 GJ/t for melting scrap metal in EAF and thin-slab casting (Worrell et al., 2008).

A comparative analysis of the energy costs of the iron and steel industry in the USA and China illustrates this reality: it shows that the aggregate input in 2006 was, respectively, 14.9 GJ/t and 23.11 GJ/t of crude steel (Hasanbeigi et al., 2012).

electricity’s share is 20% of the total primary energy used in the US steelmaking, but only 10% in China’s industry. Taking 25 GJ/t as a mean would suggest that in the year 2010 the global iron and steel industry needed roughly 36 EJ of energy, or about 6% of the worldwide consumption of primary commercial energy. For comparison, Allwood and Cullen (2012) put the global energy use in steelmaking at 38 EJ. Aluminum production is much more energy intensive than making steel. Fuel and electricity consumption in the Bayer process, between 10 and 13 GJ/t of alumina, is a small share of the overall cost that is dominated by the electrolysis that is done, preferably with the cheapest kind of electricity produced in large hydro stations (it supplies about 60% of the industry’s needs worldwide).

The IEA put the weighted energy cost of the entire sequence at 175 GJ/t in 2004, and a review of best industry practices came up with a nearly identical rate of 174 GJ/t of metal (Worrell et al., 2008). That is nearly twice the energy intensity of copper and almost 10 times as much as the least energy-intensive production of steel using the blast furnace-BOF-continuous casting route. Global 2010 production of 40.8 Mt of Al would have thus required about 7.1 EJ, less than 1.5% of the world’s total primary commercial energy supply. Metal’s high electricity requirements steer the location of primary aluminum production to countries with abundant hydro resources, and the four such largest producers (China, Russia, Canada, and the USA) account for half of the world output. Secondary aluminum requires only 7.6 GJ/t (for remelting only). As already noted, titanium has the highest energy cost among the other relatively commonly used metals (400 GJ/t), followed by nickel at about 160 GJ/t and copper (global average of 93 GJ/t), while chromium, manganese, tin, and zinc have a very similar energy cost of about 50 GJ/t (IEA, 2007). Not surprisingly, very low metal concentrations of even the best exploited deposits raise the energy intensities of silver and gold orders of magnitude above common metals: the average for silver is about 2.9 TJ/t (30 times higher than for copper) and for gold it is 53 TJ/t, roughly 300 times the energy cost of aluminum.

A World Bank review of PE energy costs found ranges of 87.4–107.8 GJ/t for high density polyethylene (HDPE) and 74.4–116.3 for low-density polyethylene (LDPE), with the processing energy being as low as 25–28 GJ/t and as high as 45 GJ/t (Vlachopoulos, 2009).

The heavy dependence of modern production of plastics on hydrocarbon feedstocks has not been, so far, a major burden, as the industry still claims less than 5% of the world’s natural gas and crude oil output. Rising demand for plastic materials and higher costs, particularly of crude oil, will change this, and in the long run plant-based bioplastics appear to be the only practical answer both to the eventually less abundant petrochemical feedstocks and to the presence of nonbiodegradable materials in the environment.


the lignin carbon fiber used in reducing the weight of passenger cars and other vehicles costs 670 GJ/t and carbon-fiber reinforced polymer (polyacrylonitrite) fiber requires just over 700 GJ/t (Das, 2011), more than three times that of aluminum.

synthesis of ammonia from its elements, the Haber–Bosch process

as little as 27 GJ/t NH3 in the year 2000. When Worrell et al. (2008) reviewed the best commercial practices, they rated natural gas-based synthesis at 28 GJ/t (roughly a third higher than the stoichiometric minimum), and coal-based process at 34.8 GJ/t. Naturally, typical performances are higher, around 30 GJ/t NH3 for gas-based plants, 36 GJ/t for heavy fuel oil feedstock, and more than 45 GJ/t NH3 for coal-based synthesis (Rafiqul et al., 2005). The IEA (2007) used regional means ranging from 48.4 GJ/t in China to 35 GJ/t in Western Europe, resulting in a global weighted mean of 41.6 GJ/t for the year 2005.

treating the insoluble rocks with sulfuric and nitric acids in order to produce water-soluble phosphorus compounds is much more energy intensive. Overall energy costs range from 18 to 20 GJ/t for superphosphates (single superphosphate with just 8.8% P, triple superphosphate with 20% P) to 28–33 GJ/t for diammonium phosphate containing 20% of soluble P (Smil, 2008). The energy cost of potash (sylvinite) extraction is low: in Saskatchewan, conventional underground mining followed by milling needs only 1–1.5 GJ/t, and surface mining and milling averages only about 300 MJ/t (NRC, 2009).

the entire production chain – starting with Si made from quartz and carbon through trichlorosilane, polysilicon, single crystal ingot, Si wafers, and actual fabrication and assembly of a microchip – consumes about 41 MJ for a 2-g chip. This implies a total electricity cost for shipped wafers of at least 2100 kWh/kg. Even if using only hydroelectricity this would prorate to about 7.6 GJ/kg, and energizing the entire process by electricity generated from fossil fuels would push the total primary energy to more than 20 GJ/kg for finished Si wafers, 2 orders of magnitude more than aluminum made from bauxite, and 3 orders of magnitude more than steel made from iron ore.

The typical rates presented in this section can be used (after rounding, to avoid impressions of unwarranted accuracy) to assess the global energy needs of major material sectors and to calculate their fractions of TPES (whose total was just over 500 EJ) in 2010 (BP, 2013). Not surprisingly, steel’s relatively high energy intensity (25 GJ/t) and its massive output (1.43 Gt in 2010, 1.5 Gt in 2011) make it the material with the highest total energy demand that dominates the total of about 50 EJ (or 10% of TPES) required to produce all metals in 2010. Plastics are next (assuming 80 GJ/t and an output of 265 Mt in 2010) with roughly 20 EJ (4% of TPES), well ahead of construction materials (cement, bricks, glass) with about 15 EJ, or 3% of TPES. Paper production required about 10 EJ and fertilizers added less than 8 EJ for the grand total of just over 100 EJ or 20% of the world’s TPES in 2010. For comparison, the IEA (2007) estimated energy input for the entire global industrial sector at almost 88 EJ for the year 2005. Paper (and paperboard) and aluminum each end up with very similar totals of close to 10 EJ (2% of TPES) as a result of aluminum’s much higher energy intensity (175 vs. 25 GJ/t) but much lower total output (53 vs. 400 Mt in 2010). Perhaps the most interesting result concerns the energy cost of inorganic fertilizers: given their truly existential importance it is reassuring to realize that the energy needed to produce them adds up to a surprisingly small share of global supply. Assuming averages of 55, 20, and 10 GJ/t for, respectively, N, P, and K (all including the cost of final formulation, packaging, and distribution) would result in a total demand of a bit more than 5 EJ in the year 2010 (with nitrogenous fertilizers accounting for about 90% of the total) – or only about 1% of the TPES.


the steadily increasing crowding of transistors has limited the annual mass of wafers needed to produce all of the world’s microchips to only about 7500 t in 2009 and to an aggregate energy expenditure of just 150 PJ, or about 0.03% of TPES.

These calculations also make it clear that modern civilization can afford all this steel and fertilizers and microchips because scientific discoveries and technical advances have greatly reduced their energy intensities.

LCA is now a mature analytical discipline that has its own periodical, International Journal of Life Cycle Assessment,

Varieties of LCA include complete cradle-to-grave sequences

LCAs of housing in cold climates show embodied energies as a small fraction of life-time total.

A 200 square meter Canadian house that cost 1.5 TJ to build, heating and lighting (averaging about 25 W/m2) will claim about 9.5 TJ in 60 years, reducing the construction share to just 14% of the overall cost. By coincidence, that share is nearly identical to the construction share of a medium-sized American car: it takes about 100 GJ to produce and (at about 8 l/100 km and 20 000 km/year) it will need about 550 GJ of fuel and oil in 10 years, while the initial construction will claim only about 15% of the overall cost, and even less once repairs and garaging are included (Smil, 2008). Embodied energies make up even lower shares in the life-cycles of machines that are in nearly constant operation: only 6–7% for jetliners, freight trains, and cargo ships (Allwood and Cullen, 2012).

Williams (2004) ended up with the reverse ratio. According to his analysis, the energy used to make a desktop with a Pentium III processor, 30 GB hard drive, and 42.5 cm monitor added up to 6.4 GJ, while during its relative life of three years the desktop would consume about 420 kWh of electricity or roughly 1.5 GJ of primary energy, yielding a manufacturing:usage energy split of 81:19.

For a Swiss desktop computer, the split was much closer at 46:54 (Ecoinvent, 2013).

LCAs also make it clear that over their life-time many infrastructures will cost nearly as much, or more, to maintain than their initial construction. A Canadian LCA for a high-volume two-lane concrete highway shows initial construction costs of 6.7 TJ/km and a rehabilitation cost of 4.1 TJ/km or 38% of the total 50-year cost of 10.8 TJ/km, and the burdens are actually reversed for a roadway made of flexible asphalt concrete that needs 15 TJ/km to build and 16% more (17.4 TJ/km) to rehabilitate over a 50-year life-cycle (Cement Association of Canada, 2006).

The LCA of repeatedly washed garments is yet another excellent illustration of the boundary problem noted at the beginning of the energy costs section, as products made from different materials have different durabilities and maintenance requirements and a complete account of these realities may shift the overall advantage from a material that requires less energy to produce to one that is more energy-intensive to make but whose life-long energy cost may be lower.

polyester production required twice as much energy as producing cotton lint (clear advantage cotton) but because of a higher cost of cloth manufacturing, the total energy cost of a cotton shirt was about 20% higher than that of its pure polyester counterpart (slight advantage polyester), and after including the energy costs of maintenance (washing, drying, ironing) the cotton shirt was about 3.6 time more energy intensive (clear advantage polyester).

Cotton appears even more disadvantaged once nonenergy impacts are compared: the water requirements of the blend are less than a third of those for pure cotton, and global warming and acidification potentials are 38% lower than those for producing and laundering two pure cotton sheets. Going even further, we can consider the long-term cost of excessive soil erosion in cotton fields, soil quality decline due to salinization in irrigated cotton fields in arid regions, and the presence of pesticide residues in soil and water (Smil, 2008). All of these are avoided by using a synthetic fiber – but its production depends on a nonrenewable feedstock. But so does the cultivation of cotton: PE synthesis consumes about 1.5 kg of hydrocarbons per kilogram of fiber but growing a kilogram of cotton requires nearly 500 g of fertilizers and 15 g of pesticides made from hydrocarbon feedstocks, as well as liquid fossil fuels for farm machinery.

But what LCAs have done is to allow comparisons within the same category of environmental consequences (when a choice of materials is possible, which one will have the lowest effect on water use or water pollution?) as well as more comprehensive rankings of materials according to several categories of environmental impact. This is important because material use is one of the three dominant ways that humans have been changing the biosphere: food production and energy supply (dominated by extraction and combustion of fossil fuels) are the other two great interventions. And when considered in its entirety, the intricate system of extraction, processing, transportation, use, reuse, and disposal of materials encompasses every major environmental interference, from land use changes (ranging from deforestation due to lumber and pulp production to destruction of plant cover and disruption of water cycle due to massive surface ore mines) to atmospheric emissions (ranging from acidifying gases to being a major contributor to anthropogenic warming).


there can be no ranking of anthropogenic environmental impacts. There is no unifying metric that would allow us to conclude that soil erosion should be a greater concern than photochemical smog, or that tropical deforestation is more worrisome than the enormous water demand of modern irrigated agriculture.

With CO2 usually being the leading contributor, this indicator will have a very high correlation with the mass of fossil fuel used in the initial production. For example, production of a kilogram of cement will release about 0.5 kg CO2 per kg of but making a kilogram of hot-rolled sheet steel will release about 2.25 kg of CO 2 liberated from fossil fuels (NREL, 2013b). The other two commonly assessed variables are acidification and eutrophication impacts. Emissions of sulfur and nitrogen oxides from combustion of fossil fuels, smelting of ores, and other industrial processes are the precursors of atmospheric sulfates and nitrates whose wet and dry deposition acidifies waters and soils. In LCAs this acidifying potential of products or processes is calculated in terms of grams of hydrogen ions per square meter (g H +/m2) or per volume of water (g H +/l). Eutrophication is the process of nutrient enrichment of fresh and coastal waters (most often by releases and leaching of nitrates and phosphates) that leads to excessive growth of algae whose decay deprives waters of dissolved oxygen and creates anoxic zones that either kill or impoverish heterotrophic life in affected waters

As just explained in the previous section, production of materials claims roughly a quarter of the world’s primary energy supply. Because the combustion of fossil fuels provides most of this energy – in global terms about 87% in 2010, with the rest coming from primary, that is mostly hydro and nuclear, electricity (BP, 2013) – production of materials is a leading source of emissions of particulate matter (including black carbon), SOx and NOx (whose conversion to sulfates and nitrates is the primary cause of acidifying precipitation), and GHGs. The water needed for processing, reaction, and cooling ends up contaminated or is released at elevated temperatures by many industries, and most of them also share the necessity of disposing of relatively large volumes of solid waste and small but potentially worrisome volumes of hazardous waste.


Production of a kilogram of typical construction steel sections generates about 1.5 kg of CO2 equivalent, 50 g of SO2 equivalent of acidification potential, a negligible amount of eutrophication potential (0.36 g), and just 0.8 g of the photochemical smog-inducing ethane (WSA, 2011b). Production of a kilogram of PVC (consuming around 60 MJ) requires about 10 kg of water (excluding cooling demand), produces 1.9–2.5 kg of CO2 equivalent, 5–7 g of acidification potential (as SO2), 0.6–0.9 g of nitrification potential (as PO4), nearly 0.5 of ethane (measure of photochemical ozone creation), 0.4–0.8 g of total particulate waste, and 5–8 g of hazardous waste (Sevenster, 2008).

Natural materials can be a better choice, and often resoundingly so in the case of biomaterials. For example, a comprehensive LCA by Bolin and Smith (2011) showed that a wood/plastic composite decking results in 14 times higher fossil fuel use, 3 times more GHG, almost 3 times more water use, 4 times higher acidification potential, and about 2 times more smog potential and ecotoxicity than a wooden deck built with lumber treated with alkaline copper.

Wooden floors are much less energy intensive than the common alternatives: the total energy per square meter of flooring per year of service was put at 1.6 MJ for wood (usually oak or maple) compared to 2.3 MJ for linoleum and 2.8 MJ for vinyl.

Remarkably, many life-cycle assessments take a cavalier approach to life-spans and just assume what seems to be a reasonable length or use (often unexplained)

There are no LCAs taking into account the great longevity of some plastics (on the order of hundreds of years) and their now ubiquitous, and clearly highly disruptive, distribution in aquatic environments. Their buoyancy, their breakdown into progressively smaller particles, and their eventual sinking through the water column to the sea bottom combine to make them a truly global and omnipresent environmental risk to marine biota: they are now found on the remotest islands as well as in the abyss, but their highest concentrations are in surface water and on beaches (Moore, 2008; Barnes et al., 2009).

Great Pacific Garbage Patch (Moore and Phillips, 2011). Later studies estimated that at least 6.4 Mt of plastic litter enters the oceans every year; that some 8 million pieces are discarded every day; that the floating plastic debris averages more than 13 000 pieces per km2 of ocean surface; and that some 60% of all marine litter stems from shoreline activities (UNEP, 2009). Additionally, the latest summaries show that, despite many efforts to limit this, now planet-wide, degradation the accumulation is still increasing (STAP, 2011). Dangers to ocean life are posed by every size unit of discarded plastics: among the largest items are abandoned or damaged fishing nets that can ensnare fishes, dolphins, and often even whales; while aquatic birds often mistake small-size pieces of plastic for small fish or invertebrates and regurgitate them to their fledglings: the stomachs of many species show a distressing collection of such objects. And microplastics – the smallest pieces (sizes less than 5, 2, or 1 mm) that are manufactured for cosmetics, drugs, and industrial uses and that arise from abrasion and photodegradation of larger pieces – can be ingested by marine biota and can have serious metabolic and toxic effects (Cole et al., 2011). Inevitably, masses of plastic microparticles have been also accumulating on shorelines where they endanger more organisms (Browne et al., 2011). This important example shows how incomplete and uncertain are even our best analytical procedures tracing the requirements and consequences of material production, use, and abandonment; it also provides a strong argument for much better management of materials and, obviously, recycling should be a key component of these efforts.


with most materials recycling is more accurately described as down-cycling: high-quality paper becomes packaging stock or cardboard, expensive plastics are turned into cheap items.

Production of recycled steel will require roughly 75% less energy and the LCA of common steel products (sections, hot-rolled coil, and hot-dip galvanized steel) showed recycling benefits of up to about 50% for both GWP and acidification potential (WSA, 2011b).

Delacquering (removal of any coatings) needs about 7 GJ/t, melting consumes 7 GJ/t, addition of pure aluminum to adjust the alloy composition takes about 8 GJ/t, and the production of containers (casting, rolling, blanketing, forming) adds 30 GJ/t for the total of about 52 GJ/t, a saving of 74% rather than 96% (Luo and Soria, 2008).

Benefits go beyond energy savings, as recycling lowers GWP, claims less water, and generates less water and air pollution: Grimes et al. (2008) provide many comparisons for steel, aluminum, and paper production. Recycled paper can be made with 40% less energy while generating 45% less waste water and 50% less solid waste (EPN, 2007). Energy savings for recycled high-density polyethylene are 45–50% and 40–45% for PVC.

recycling is also a quest that is often very difficult to pursue (be it because of logistic challenges, excessive costs, or negligible energy savings) and one that, unlike the flows of carbon or nitrogen atoms in grand biogeochemical cycles, often amounts to a fairly rapid down-cycling as the reused materials appear in less valuable guises.

The greatest challenge is to recycle the increasing amount of electronic waste that is, in mass terms, dominated by a few plastics, a few metals, and screen glass, but that also contains small, but in aggregate quite substantial, amounts of more than a dozen elements.

Of the 60 metals and metalloids examined by a UN report, more than half (including all rare earths, as well as germanium, selenium, indium, and tellurium) have recovery rates of less than 1%, for only five elements is the rate between 1 and 25%, and 18 common (or relatively common) metals have end-of-life recycling rates above 50%, but rarely above 60% (Graedel et al., 2011).

Unfortunately, some toxic heavy metals, whose release into the environment is particularly undesirable, have very low recycling rates. The only relatively common way of recycling cadmium is by returned Ni-Cd batteries, but their collection rate remains low. The recycling rate of fluorescent lights containing mercury is also too low.

Correct separation is difficult but imperative: a single PVC bottle in a load of 10 000 PET bottles can ruin the entire melt (ImpEE Project, 2013). Sorting is followed by cleaning (but removing print and labels cannot be 100% successful) and reduction to uniform pellet sizes ready for reuse, still mostly only in lower-grade applications such as cheap carpets, garbage cans, or park benches.

Collection of household waste paper is expensive, and a thorough processing of the material is needed to produce clean fibers for reuse. This includes defibering of paper, cleaning and removal of all nonfiber ingredients (most often adhesive tapes, plastics, and staples), and de-inking is needed if the fibers are to be reprocessed into white paper. Reprocessing shortens the cellulose fibers and this means that paper can be recycled no more than 4 to 7 times.

Recycling of e-waste is particularly challenging, because the devices commingle many compounds and elements that must be separated by a sequence of mechanical and chemical operations. Silicon is the core of modern computers, but transistors and microchips could not function without the presence of a multitude of materials, including many heavy metals.  Elements used to dope silicon include arsenic, phosphorus, boron, and gallium. Printed wire boards, disk drives, expansion cards, electrical supplies, and connections add up to a hoard of materials, small (and for many elements even miniature) per unit but highly consequention in the aggregate. Most of the mass in electronic devices is steel, glass, plastics, copper, and aluminum, but more than a dozen other metals are also present in tiny amounts, eight of them classified as hazardous (As, Cd, Cr, Co, Hg, Pb, Sb, and Se).

Lead is of the greatest concern. The lead in computer wire boards has 30 to 100 times the level of lead (5 mg/l) that classifies waste as hazardous.

In 1997 100 million cellphones were sold a year, a billion by 2009, and at the end of 2012 more than 6.5 billion devices in use, plus tablets, notebooks, and netbooks. These only last 1.5 to 2 years, so up to 1.2 billion cellphones a year are discarded.  In the USA recycling rates for all mobile devices was a dismal 8% in 2009 (and 17% for TVs, 38% for computers).  130 million discarded devices in the USA collectively have 2000 tons copper, 45 tons silver, 4 tons gold, 9,000 tons plastics, 2,500 tons ceramics and glass. Multiply by 6 or more for global amounts.


The USA buries nearly 80,000 tons of plastic in its landfills every day, with only 8% of discarded plastics recovered (23% for PET bottles but less than 1% for polypropylene waste).

ENERGY EFFICIENCIES

Late 19th to early 20th century hand-stoked coal stoves converted no more than 20-25% or less of the fuel’s chemical energy to useful heat, though that’s good compared to the less than 10% efficiency of wood-burning fireplaces before that. Oil-fired furnace efficiency can be up to 50%, natural gas home furnaces 70-75%.

Steam engines with top efficiency of 15% used to power small freight ships (less than 5,000 dwt). No bulk carriers (100,000 dwt+) are powered by diesel engines whose best efficiencies are close to or slightly above 50%.

The world’s copper resources are about 1.6 Gt.  To provide all 10 billion people in the future with the average per capita mean (170 kg) would require 1.7 Gt, more than the estimated resource in the crust (Gordon 2006).

Gordon, R.B., et al. 2006. Metals stocks and sustainability. Proceedings of the National Academy of Sciences (USA) 103:12-9-1214

Posted in Infrastructure Books, Life Before Oil, Limits To Growth, Peak Resources, Vaclav Smil | Tagged , , | 9 Comments

Steam engines. Exergy power. and work in the US

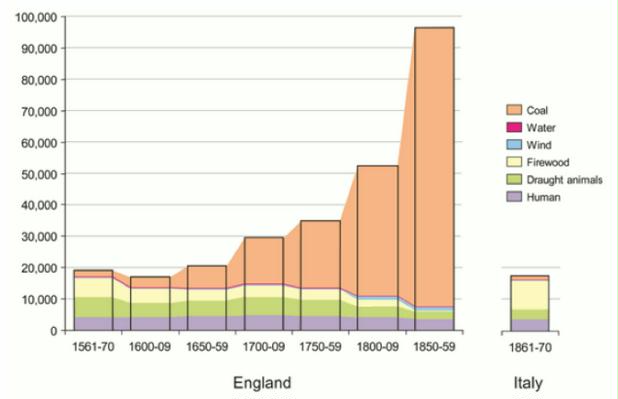
Preface.  At some point of fossil fuel decline future generations will be tempted to build steam engines again, and perhaps just as in America initially they’ll use wood to fuel the engines, since coal will be scarce at some point (steamships didn’t burn coal until 1850 when iron ships first appeared).  A good thing coal came along — burning wood in steam engines for locomotives, steam ships, factories, tractors, and other uses decimated America’s forests.

Steam engines are a great deal less efficient than internal combustion engines, making a recovery to today’s level of civilization unlikely.

Alice Friedemann   www.energyskeptic.com  author of “When Trucks Stop Running: Energy and the Future of Transportation”, 2015, Springer and “Crunch! Whole Grain Artisan Chips and Crackers”. Podcasts: Derrick Jensen, Practical Prepping, KunstlerCast 253, KunstlerCast278, Peak Prosperity , XX2 report

***

Ayres, R.U., et al. March 2003. Exergy, power and work in the US economy, 1900-1998. Energy Vol 28 #3 219-273.

During the first half of the century (1900-1950) steam locomotives for railroads were the major users, with stationary steam engines in mines and factories also significant contributors.

Steam turbine design improvements and scaling up to larger sizes accounted for most of the early improvements. The use of pulverized coal, beginning in 1920, accounted for major gains in the 1920s and 30s. Better designs and metallurgical advances permitting higher temperatures and pressures accounted for further improvements in the 1950s. Since 1960, however, efficiency improvements have been very slow, largely because existing turbine steel alloys are close to their maximum temperature limits.

The conversion efficiency of steam–electric power plants has increased by nearly a factor of ten, from 3.6% in 1900 or so to nearly 34% on average (including distribution losses) and 48% for the most advanced units. The consumption of electricity in the US has increased since 1900 by a factor of 1200, and continued to increase rapidly even after 1960.

In the case of large stationary or marine steam engines operating under optimal conditions at constant loads, the thermal efficiency exceeded 15% in the best cases. However, locomotive steam engines were not nearly so efficient — between 4% and 8% on average — and the best locomotive engine in 1900 achieved around 11%, increasing to perhaps 13% by 1910

Factory engines were generally older and even less efficient and transmission losses in factories (where a central engine was connected to a number of machines by a series of leather belts) were enormous. For instance, if a stationary steam engine for a factory with machines operating off belt drives circa 1900 had a thermal efficiency of 6%, with 50% frictional losses, the net exergy efficiency was 3%. The Dewhurst estimate, which took into account these transmission losses, set the average efficiency of conversion of coal energy into mechanical work at the point of use at 3% in 1900 (when most factories still used steam power) increasing to 4.4% in 1910 and 7% in 1920, when the substitution of electric motors for steam power in factories was approaching completion. The use of steam power in railroads was peaking during the same period.

In the case of railroad steam locomotives, average thermal efficiency circa 1920 according to another estimate was about 10%, whereas a diesel electric locomotive half a century later (circa 1970) achieved 35%. Internal friction and transmission losses and variable load penalty are apparently not reflected in either figure, but they would have been similar (in percentage terms) in the two cases. If these losses amounted to 30%, the two estimates are consistent for 1920. Coal-burning steam locomotives circa 1950 still only achieved 7.5% thermal efficiency; however, oil-burning steam engines at that time obtained 10% efficiency and coal-fired gas turbines got 17%. But the corresponding efficiency of diesel electric locomotives c. 1950 was 28%, taking internal losses into account. The substitution of diesel–electric for steam locomotives began in the 1930s and accelerated in the 1950s.

The work done by internal combustion engines in automobiles, trucks and buses (road transport) must be estimated in a different way. In the case of heavy diesel-powered trucks with a compression ratio in the range of 15–18, operating over long distances at highway speeds, the analysis is comparable to that for railways. The engine power can be optimized for this mode of operation and the parasitic losses for a heavy truck (lights, heating, engine cooling, air-conditioning, power- assisted steering, etc.) are minor. Internal friction and drive-train losses and losses due to variable load operation can conceivably be as low as 20%, though 25% is probably more realistic.

In the case of railroads the traditional performance measure is tonne–km. From 1920 to 1950 the improvement by this measure was threefold, most of which was due to the replacement of coal-fired steam locomotives by diesel–electric or electric locomotives. This substitution began in the 1930s but accelerated after the second World War because diesel engines were far more fuel-efficient — probably by a factor of five.

According to a study published in 1952, diesel engines can perform ten times as much work as steam engines in switching operations, five times as much in freight service and three times as much in passenger service. The overall gain might have been a factor of about five — and also required significantly less maintenance. But from 1950 to 1960 the service output (measured in vehicle–km traveled) per unit exergy input quadrupled and from 1960 to 1987 there was a further gain of over 50%. The overall performance increase from 1920 to 1987 by this measure (tonne–km per unit of fuel input) was around 20-fold. In 1920 US railways consumed 122 million tonnes of coal, which was 16% of the nation’s energy supply. By 1967 the railway’s share of national energy consumption had fallen to 1% and continued to decline thereafter.

It is obvious that much of the improvement has occurred at the system level. One of the major factors was that trucks took over most of the short-haul freight carriage while cars and buses took most of the passengers, leaving the railroads to carry bulk cargoes over long distances at (comparatively) high and constant speeds and with much less switching — which is very exergy intensive. Under these conditions the work required to move a freight train is reduced because rolling friction and air resistance are minimized, while work required for repeated accelerations and decelerations was sharply reduced or eliminated.

Another factor behind the gains was that the work required to overcome air and rolling resistance had been reduced significantly by straightening some of the rights-of-way, improving couplings and suspensions, and introducing aerodynamic shapes. A third source of gain was increasing power-to-weight ratios for locomotives; locomotives in 1900 averaged 133 kg/kW. By 1950 this had fallen to about 33 kg/kW and by 1980 to around 24 kg/kW. The lighter the engine, the less power is needed to move it. (This is an instance of dematerialization contributing to reduced exergy consumption.) If the railways in 1987 were achieving 30% thermal efficiency, and if the coal-fired steam locomotives of 1920 were averaging 7% (for an overall factor of four and a fraction), then an additional factor of five or so was achieved by increasing system efficiency in other ways. In effect, the work required to haul rail cargoes has declined dramatically since 1960, but the exergy input required per unit of mechanical work done has hardly changed since then.

Substitution of diesel for steam locomotives in the USA, 1935–1957.


Posted in Coal | Tagged , | 3 Comments

238 academics call on the EU to plan for a post-growth future

Preface. We know there’s going to be no growth soon due to peak oil and limits to growth, and ought to be planning for it so that the financial system doesn’t “freak out” and crash like Humpty Dumpty, beyond repair.  We will eventually be forced to reach a steady state economy, but the landing when civilization snaps from resource shortages could be softened by evolving to a non-growth society, which would also hugely help the environment and reduce biodiversity loss.

Alice Friedemann   www.energyskeptic.com  author of “When Trucks Stop Running: Energy and the Future of Transportation”, 2015, Springer and “Crunch! Whole Grain Artisan Chips and Crackers”. Podcasts: Practical Prepping, KunstlerCast 253, KunstlerCast278, Peak Prosperity , XX2 report

September 16, 2018. The EU needs a stability and well-being pact, not more growth. 238 academics call on the European Union and its member states to plan for a post-growth future in which human and ecological wellbeing is prioritised over GDP. The Guardian.

This week, scientists, politicians, and policymakers are gathering in Brussels for a landmark conference. The aim of this event, organised by members of the European parliament from five different political groups, alongside trade unions and NGOs, is to explore possibilities for a “post-growth economy” in Europe.

For the past seven decades, GDP growth has stood as the primary economic objective of European nations. But as our economies have grown, so has our negative impact on the environment. We are now exceeding the safe operating space for humanity on this planet, and there is no sign that economic activity is being decoupled from resource use or pollution at anything like the scale required. Today, solving social problems within European nations does not require more growth. It requires a fairer distribution of the income and wealth that we already have.

Growth is also becoming harder to achieve due to declining productivity gains, market saturation, and ecological degradation. If current trends continue, there may be no growth at all in Europe within a decade. Right now the response is to try to fuel growth by issuing more debt, shredding environmental regulations, extending working hours, and cutting social protections. This aggressive pursuit of growth at all costs divides society, creates economic instability, and undermines democracy.

Those in power have not been willing to engage with these issues, at least not until now. The European commission’s Beyond GDP project became GDP and Beyond. The official mantra remains growth — redressed as “sustainable”, “green”, or “inclusive” – but first and foremost, growth. Even the new UN sustainable development goals include the pursuit of economic growth as a policy goal for all countries, despite the fundamental contradiction between growth and sustainability.

The good news is that within civil society and academia, a post-growth movement has been emerging. It goes by different names in different places: décroissance, Postwachstum, steady-state or doughnut economics, prosperity without growth, to name a few. Since 2008, regular degrowth conferences have gathered thousands of participants. A new global initiative, the Wellbeing Economies Alliance (or WE-All), is making connections between these movements, while a European research network has been developing new “ecological macroeconomic models”. Such work suggests that it’s possible to improve quality of life, restore the living world, reduce inequality, and provide meaningful jobs – all without the need for economic growth, provided we enact policies to overcome our current growth dependence.

Some of the changes that have been proposed include limits on resource use, progressive taxation to stem the tide of rising inequality, and a gradual reduction in working time. Resource use could be curbed by introducing a carbon tax, and the revenue could be returned as a dividend for everyone or used to finance social programmes. Introducing both a basic and a maximum income would reduce inequality further, while helping to redistribute care work and reducing the power imbalances that undermine democracy. New technologies could be used to reduce working time and improve quality of life, instead of being used to lay off masses of workers and increase the profits of the privileged few.

Given the risks at stake, it would be irresponsible for politicians and policymakers not to explore possibilities for a post-growth future. The conference happening in Brussels is a promising start, but much stronger commitments are needed. As a group of concerned social and natural scientists representing all Europe, we call on the European Union, its institutions, and member states to:

1. Constitute a special commission on post-growth futures in the EU parliament. This commission should actively debate the future of growth, devise policy alternatives for post-growth futures, and reconsider the pursuit of growth as an overarching policy goal.

2. Incorporate alternative indicators into the macroeconomic framework of the EU and its member states. Economic policies should be evaluated in terms of their impact on human wellbeing, resource use, inequality, and the provision of decent work. These indicators should be given higher priority than GDP in decision-making.

3. Turn the stability and growth pact (SGP) into a stability and wellbeing pact. The SGP is a set of rules aimed at limiting government deficits and national debt. It should be revised to ensure member states meet the basic needs of their citizens, while reducing resource use and waste emissions to a sustainable level.

4. Establish a ministry for economic transition in each member state. A new economy that focuses directly on human and ecological wellbeing could offer a much better future than one that is structurally dependent on economic growth.

  • Dr Dan O’Neill, Associate Professor, University of Leeds, UK
  • Dr Federico Demaria, Researcher, Universitat Autònoma de Barcelona, Spain
  • Dr Giorgos Kallis, Professor, Universitat Autònoma de Barcelona, Spain
  • Dr Kate Raworth, Author of ‘Doughnut Economics’, UK
  • Dr Tim Jackson, Professor, University of Surrey, UK
  • Dr Jason Hickel, Lecturer, Goldsmiths, University of London, UK
  • Dr Lorenzo Fioramonti, Professor, University of Pretoria, South Africa
  • Dr Marta Conde, President of Research & Degrowth, Spain
  • Dr Kevin Anderson, Deputy Director, Tyndall Centre for Climate Change Research, UK
  • Dr Steve Keen, Professor, Kingston University, UK
  • Dr Saskia Sassen, Professor of Sociology, Columbia University, USA
  • Dr Ann Pettifor, Director, Policy Research in Macroeconomics (PRIME), UK
  • Dr Serge Latouche, Université Paris Sud, France
  • Dr Kate Pickett, Professor, University of York, UK
  • Dr Susan George, President of the Transnational Institute-TNI, Netherlands
  • Dr Joan Martinez Alier, Professor, Universitat Autònoma de Barcelona, Catalonia
  • Dr David Graeber, Professor, London School of Economics, UK
  • Dr Juan Carlos Monedero Fernández, Universidad Complutense de Madrid, Spain
  • Dr Dominique Méda, Professor, University Paris Dauphine, France
  • Dr Lourdes Beneria, Professor Emerita, Cornell University, USA
  • Dr Inge Røpke, Professor, Aalborg University, Denmark
  • Dr Niko Paech, Professor, University of Siegen, Germany
  • Dr Jean Gadrey, Professor, University of Lille, France
  • Dr Nadia Johanisova, Lecturer, Masaryk University, Brno, Czech Republic
  • Dr Wolfgang Sachs, Research Director Emeritus, Wuppertal Institut, Germany
  • Dr Stefania Barca, Senior Researcher, Centre for Social Studies, University of Coimbra, Portugal
  • Dr Gilbert Rist, Emeritus Professor, Graduate Institute of International and Development Studies, Switzerland
  • Dr György Pataki, Professor, Corvinus University of Budapest, Hungary
  • Dr Simone D’Alessandro, Professor, University of Pisa, Italy
  • Dr Ian Gough, Visiting Professor, London School of Economics, UK
  • Dr Iñigo Capellán-Pérez, Researcher, University of Valladolid, Spain
  • Dr Amaia Pérez Orozco, Researcher, Colectiva XXK, Spain
  • Dr Max Koch, Professor, Lund University, Sweden
  • Dr Fabrice Flipo, Professor, Institut Mines Télécom-BS et LCSP Paris 7 Diderot, France
  • Dr Matthias Schmelzer, Researcher, University of Jena and Konzeptwerk Neue Ökonomie, Germany
  • Dr Óscar Carpintero, Associate Professor, University of Valladolid, Spain
  • Dr Hubert Buch-Hansen, Associate Professor, Copenhagen Business School, Denmark
  • Dr Christos Zografos, Pompeu Fabra University, Spain
  • Dr Tereza Stöckelová, Associate Professor, Institute of Sociology of the Czech Academy of Sciences, Czech Republic
  • Dr Alf Hornborg, Professor, Lund University, Sweden
  • Dr Eric Clark, Professor, Lund University, Sweden
  • Dr Miklós Antal, Researcher, University of Leeds, UK
  • Dr Jordi Roca Jusmet, Professor, Universitat de Barcelona, Spain
  • Dr Philippe Defeyt, Chairman, Institute for Sustainable Development, Belgium
  • Dr Erik Swyngedouw, Professor, University of Manchester, UK
  • Dr Christian Kerschner, Assistant Professor, Modul University Vienna, Austria
  • Dr Agata Hummel, Assistant Professor, University of Adam Mickiewicz, Poland
  • Dr Frank Moulaert, Emeritus Professor, Katholieke Universiteit Leuven, Belgium
  • Dr Frank Adler, Researcher, Brandenburg-Berlin Institute for Social Scientific Research, Germany
  • Dr Janne I. Hukkinen, Professor, University of Helsinki, Finland
  • Dr Jorge Riechmann, Professor, Universidad Autónoma de Madrid, Spain
  • Samuel Martín-Sosa Rodríguez, Responsable de Internacional, Ecologistas en Acción, Spain
  • Dr John Barry, Professor, Queen’s University Belfast, Northern Ireland
  • Dr Linda Nierling, Senior Scientist, Karlsruhe Institute of Technology, Germany
  • Dr Ines Omann, Senior Researcher, Austrian Foundation for Development Research, Austria
  • Dr Hug March, Associate Professor, Universitat Oberta de Catalunya, Spain
  • Dr Jakub Kronenberg, Associate Professor, University of Lodz, Poland
  • Yayo Herrero, Miembro del Foro de Transiciones, Spain
  • Dr Isabelle Anguelovski, Professor, Universitat Autònoma de Barcelona, Spain
  • Dr François Schneider, Researcher, Research & Degrowth, France
  • Dr Vasilis Kostakis, Senior Researcher, Tallinn University of Technology, Estonia
  • Dr Enric Tello, Professor, University of Barcelona, Spain
  • Dr Andrew Sayer, Professor, Lancaster University, UK
  • Dr Kate Soper, Emerita Professor, London Metropolitan University, UK
  • Dr Klaus Hubacek, Professor, International Institute for Applied Systems Analysis, Austria
  • Dr Brent Bleys, Assistant Professor, Ghent University, Belgium
  • Dr Jill Jäger, Independent Scholar, Vienna, Austria
  • Dr Mauro Gallegati, Professor, Università Politecnica delle Marche, Italy
  • Dr Peadar Kirby, Professor Emeritus, University of Limerick, Ireland
  • Dr Inés Marco, Researcher, University of Barcelona, Spain
  • Dr Ivan Murray Mas, Assistant Lecturer, Universitat de les Illes Balears, Spain
  • Dr Alexandros Kioupkiolis, Assistant Professor, Aristotle University of Thessaloniki, Greece
  • Dr Aurore Lalucq, Co-Director, Veblen Institute, France
  • Dr Gaël Plumecocq, Researcher, French National Institute for Agricultural Research (INRA), France
  • Dr David Soto Fernández, Associate Professor, Universidad Pablo de Olavide, Spain
  • Dr Christian Kimmich, Researcher, Masaryk University Brno, Czech Republic
  • Dr Giacomo D’Alisa, Researcher, Centre for Social Studies, University of Coimbra, Portugal
  • Dr Seth Schindler, Senior Lecturer, University of Manchester, UK
  • Dr Philippe Roman, Researcher, ICHEC Brussels Management School, Belgium
  • Dr Lorenzo Pellegrini, Associate Professor, Erasmus University Rotterdam, Netherlands
  • Dr Erik Gómez-Baggethun, Professor, Norwegian University of Life Sciences, Norway
  • Dr Tommaso Luzzati, Assistant Professor, University of Pisa, Italy
  • Dr Christoph Gran, ZOE Institute for Future Fit Economies, Germany
  • Dr Tor A. Benjaminsen, Professor, Norwegian University of Life Sciences, Norway
  • Dr Barry McMullin, Professor, Dublin City University, Ireland
  • Dr Edwin Zaccai, Professor, Université Libre de Bruxelles, Belgium
  • Dr Jens Friis Lund, Professor, University of Copenhagen, Denmark
  • Dr Pierre Ozer, Researcher, Université de Liège, Belgium
  • Dr Louison Cahen-Fourot, Researcher, Institute for Ecological Economics, Wirtschaftsuniversität Vienna, Austria
  • Dr Tommaso Rondinella, Researcher, Italian National Institute of Statistics, Italy
  • Dr Julia Steinberger, Associate Professor, University of Leeds, UK
  • Dr Andrew Fanning, Marie Curie Research Fellow, University of Leeds, UK
  • Jose Luis Fdez Casadevante Kois, Miembro del Foro Transiciones, Spain
  • Dr Seema Arora-Jonsson, Professor, Swedish University of Agricultural Sciences, Sweden
  • Dr Astrid Agenjo Calderón, Lecturer, Universidad Pablo de Olavide, Spain
  • Dr Tom Bauler, Professor, Université Libre de Bruxelles, Belgium
  • Dr Gregers Andersen, Independent Researcher, Denmark
  • Dr Peter Söderbaum, Professor Emeritus, Mälardalen University, Sweden
  • Dr Lourenzo Fernandez Priero, Professor, Universidade de Santiago de Compostela, Spain
  • Dr John R Porter, Emeritus Professor, University of Copenhagen, Denmark
  • Dr François Thoreau, Senior Researcher, University of Liege, France
  • Mariagiulia Costanzo Talarico, Researcher, Universidad Pablo de Olavide, Spain
  • Dr Maria Nikolaidi, Senior Lecturer, University of Greenwich, UK
  • Dr Ekaterina Chertkovskaya, Lecturer, Lund University, Sweden
  • Dr Stefan Gaarsmand Jacobsen, Assistant Professor, University of Roskilde, Denmark
  • Dimitar Sabev, Researcher, University of National and World Economy, Bulgaria
  • Dr Mladen Domazet, Research Director, Institute for Political Ecology, Croatia
  • Dr Hans Diefenbacher, Professor, University of Heidelberg, Germany
  • Dr Marco Armiero, Director of the Environmental Humanities Laboratory, Royal Institute of Technology, Sweden
  • Dr Irene Ring, Professor, Technische Universität Dresden, Germany
  • Dr Christine Bauhardt, Professor, Humboldt-Universität zu Berlin, Germany
  • Dr Dominique Bourg, Professor, University of Lausanne, Switzerland
  • Dr Tomas Ryska, Lecturer, University of Economics, Czech Republic
  • Dr Filka Sekulova, Researcher, Universitat Autònoma de Barcelona, Spain
  • Dr Andrej Lukšič, Associate Professor, University of Ljubljana, Slovenia
  • Dr Adrian Smith, Professor, University of Sussex, UK
    Dr Serenella Iovino, Professor, Università di Torino, Italy
  • Dr Helga Kromp-Kolb, Professor, University of Renewable Resources and Life Sciences, Vienna, Austria
  • Dr Roberto De Vogli, Associate Professor, University of Padova, Italy
  • Dr Danijela Dolenec, Assistant Professor, University of Zagreb, Croatia
  • Dr Alexandra Köves, Senior Lecturer, Corvinus University of Budapest, Hungary
  • Dr Antoine Bailleux, Professor, Université Saint-Louis – Bruxelles, Belgium
  • Dr Christof Mauch, Director, Rachel Carson Centre for Environment and Society, Germany
  • Ajda Pistotnik, Independent Researcher, EnaBanda, Slovenia
  • Dr Branko Ančić, Researcher, Institute for Social Research for Social Research in Zagreb, Croatia
  • Dr Marija Brajdic Vukovic, Assistant Professor, University of Zagreb, Croatia
  • Dr Manuel González de Molina, Professor, Universidad Pablo de Olavide, Spain
  • Dr Kye Askins, Reader, University of Glasgow, UK
  • Dr Carlos de Castro Carranza, Profesor Titular de Física Aplicada, Universidad de Valladolid, Spain
  • Dr Annika Pissin, Researcher, Lund University, Sweden
  • Dr Eva Fraňková, Assistant Professor, Masaryk University, Czech Republic
  • Dr Helga Kromp-Kolb, Professor, University of Renewable Resources and Life Sciences, Vienna, Austria
  • Dr Lidija Živčič, Senior Expert, Focus, Association for Sustainable Development, Slovenia
  • Dr Martin Pogačar, Research Fellow, ZRC SAZU, Slovenia
  • Dr Peter Nielsen, Associate Professor, Roskilde University, Denmark
  • Yaryna Khmara, Researcher, University of Lodz, Poland
  • Dr Ika Darnhofer, Associate Professor, University of Natural Resources and Life Sciences, Austria
  • Dr Isabelle Cassiers, Professor, Université catholique de Louvain, Belgium
  • Dr Mihnea Tanasescu, Researcher, Research Foundation Flanders (FWO) and Vrije Universiteit Brussel (VUB), Belgium
  • Dr Daniel Hausknost, Assistant Professor, Institute for Social Change and Sustainability, Vienna University of Economics and Business, Austria
  • Dr Christoph Görg, Professor, University of Natural Resources and Life Sciences Vienna, Austria
  • Dr Andreas Novy, Professor, Vienna University of Economics and Business, Austria
  • Dr Fikret Adaman, Professor, Boğaziçi University, Turkey
  • Dr Bengi Akbulut, Assistant Professor, Concordia University, Canada
  • Dr Kevin Maréchal, Professor, Université de Liège, Belgium
  • Dr Anke Schaffartzik, Researcher, Universitat Autònoma de Barcelona, Spain
  • Dr Milena Buchs, Associate Professor, University of Leeds, UK
  • Dr Jean-Louis Aillon, Researcher, University of Genova, Italy
  • Dr Melanie Pichler, Researcher, University of Natural Resources and Life Sciences, Austria
  • Dr Helmut Haberl, Associate Professor, Institute of Social Ecology, University of Natural Resources and Life Sciences, Austria
  • Dr Julien-François Gerber, Assistant Professor, International Institute of Social Studies, Netherlands
  • Dr John Holten-Andersen, Associate Professor, Aalborg University, Denmark
  • Theresa Klostermeyer, Officer for Sustainability and Social Change, German League for Nature, Animal and Environmental Protection, Germany
  • Dr Lyla Mehta, Professor, Institute of Development Studies, UK
  • Dr Geneviève Azam, Professor, Université Jean Jaurès, France
  • Dr Hermann E. Ott, Professor, University of Sustainable Development Eberswalde, Germany
  • Dr Angelika Zahrnt, Professor, Institute for Ecological Economic Research, Germany
  • Dr Melissa Leach, Director, Institute of Development Studies (IDS), University of Sussex, UK
  • Dr Irmi Seidl, Assistant Professor, Swiss Federal Research Institute WSL, Switzerland
  • Dr Shilpi Srivastava, Research Fellow, Institute of Development Studies, UK
  • Dr Elgars Felcis, Researcher, University of Latvia, Chairman of Latvian Permaculture Association, Latvia
  • Dr Tilman Santarius, Professor, Technische Universität Berlin and Einstein Center Digital Futures, Germany
  • Nina Treu, Coordinator of Konzeptwerk Neue Ökonomie, Germany
  • Dr Laura Horn, Associate Professor, Roskilde University, Denmark
  • Jennifer Hinton, Researcher, Stockholm Resilience Centre, Stockholm University, Sweden
  • Dr Friedrich Hinterberger, President, Sustainable Europe Research Institute, Austria
  • Dr Miriam Lang, Assistant Professor, Universidad Andina Simón Bolivar, Ecuador
  • Dr Susse Georg, Professor, Aalborg University, Denmark
  • Dr Silvio Cristiano, Researcher, Università degli Studi di Napoli ‘Parthenope’ & Università Ca’ Foscari Venezia, Italy
  • Dr Petr Jehlička, Senior Lecturer, Open University, UK
  • Dr Maja Göpel, Professor, Leuphana University, Member Club of Rome, Germany
  • Dr Geraldine Thiry, Associate Professor, ICHEC Brussels Management School, Belgium
  • Dr Olivier Malay, Researcher, University of Louvain, Belgium
  • Dr Richard Lane, Researcher, Copernicus Institute of Sustainable Development, Utrecht University, Netherlands
  • Dr Laura Centemeri, Researcher, National Centre for Scientific Research, France
  • Dr Stephan Lessenich, Professor, Ludwig Maximilians University, Germany
  • Timothée Parrique, Researcher, Stockholm University, Sweden
  • Dr Ludivine Damay, Lecturer, Université libre de Bruxelles, Belgium
  • Dr Janis Brizga, Researcher, University of Latvia, Latvia
  • Dr Claudio Cattaneo, Associate Professor, Universitat Autònoma de Barcelona, Spain
  • Dr Miquel Ortega Cerdà, Advisor, Barcelona City Council
  • Dr Olivier De Schutter, Professor, Catholic University of Louvain, Belgium
  • Dr Annalisa Colombino, Assistant Professor, Institute of Geography and Regional Sciences, University of Graz, Austria
  • Dr Philip von Brockdorff, Head of the Department of Economics, University of Malta, Malta
  • Dr Sarah Cornell, Senior Researcher, Stockholm Resilience Centre, Stockholm University, Sweden
  • Dr Ruth Kinna, Professor, Loughborough University, UK
  • Francesco Gonella, Professor, Università Ca’ Foscari Venezia, Italy
  • Orsolya Lazanyi, Researcher, Corvinus University of Budapest, Hungary
  • Dr Eva Friman, Director at Swedesd, Uppsala University, Sweden
  • Dr Pernilla Hagbert, Researcher, KTH Royal Institute of Technology, Sweden
  • Vincent Liegey, Co-Author of ‘A Degrowth Project’, Hungary
  • Dr Manlio Iofrida, Associate Professor, University of Bologna, Italy
  • Dr Mauro Bonaiuti, Lecturer, University of Turin, Italy
  • Dr Marco Deriu, Researcher, University of Parma, Italy
  • Dr Eeva Houtbeckers, Postdoctoral Researcher, Aalto University, Finland
  • Dr Guy Julier, Professor, Aalto University, Finland
  • Dr Anna Kaijser, Lecturer, Linköping University, Sweden
  • Dr Petter Næss, Professor, Norwegian University of Life Sciences, Norway
  • Dr Irina Velicu, Researcher, Center for Social Studies, University of Coimbra, Portugal
  • Dr Ulrich Brand, Professor, University of Vienna, Austria
  • Dr Christina Plank, Researcher, University of Natural Resources and Life Sciences, Austria
  • Dr Karolina Isaksson, Senior Research Leader, Swedish National Road and Transport Research Institute, Sweden
  • Dr Jin Xue, Associate Professor, Norwegian University of Life Sciences, Norway
  • Dr Rasmus Steffansen, Researcher, Norwegian University of Life Sciences, Norway
  • Dr Irmak Ertör, Researcher, Universitat Autònoma de Barcelona, Spain
  • Dr Maria Hadjimichael, Researcher, University of Cyprus, Cyprus
  • Dr Carlo Aall, Researcher, Western Norway Research Institute, Norway
  • Dr Claudiu Craciun, Lecturer, National School of Political Studies and Administration (SNSPA), Romania
  • Dr Tuuli Hirvilammi, Researcher, University of Jyväskylä, Finland
  • Dr Tuula Helne, Senior Researcher, The Social Insurance Institution of Finland, Finland
  • Davide Biolghini, Researcher, Rete italiana Economia Solidale (RES), Italy
  • Dr Pasi Heikkurinen, Lecturer, University of Leeds, UK
  • Dr Anne Tittor, Researcher, University of Jena, Germany
  • Dr Dennis Eversberg, Researcher, University of Jena, Germany
  • Dr Herman Stål, Lecturer, Umea School of Business, Economics and Statistics, Sweden
  • Dr Hervé Corvellec, Professor, Lund University, Sweden
  • Dr Anna Heikkinen, Researcher, University of Tampere, Finland
  • Dr Karl Bonnedahl, Researcher, Umea University, Sweden
  • Dr Meri Koivusalo, Professor, University of Tampere, Finland
  • Dr Martin Fritz, Researcher, Bielefeld University, Germany
  • Dr Daniel Bergquist, Researcher, Swedish University of Agricultural Sciences, Sweden
  • Dr Yuri Kazepov, Professor, University of Vienna, Austria
  • Dr Salvador Pueyo, Researcher, Universitat de Barcelona, Catalonia
  • Dr Lars Rydén, Professor, Uppsala University, Sweden
  • Patrick ten Brink, Director of EU Policy, European Environmental Bureau, Belgium
  • Dr Ebba Lisberg Jensen, Associate Professor, Malmö University, Sweden
  • Dr Alevgul H. Sorman, Researcher, Basque Centre for Climate Change (BC3), Spain
  • Dr Aram Ziai, Professor, University of Kassel, Germany
  • Dr Panos Petridis, Researcher, University of Natural Resources and Life Sciences (BOKU), Austria
  • Dr Gary Dymski, Professor, University of Leeds, UK
  • Dr Markus Wissen, Professor, Berlin School of Economics and Law, Germany
  • Dr Wendy Harcourt, Professor, International Institute of Social Studies of Erasmus University, The Netherlands
  • Dr John Barrett, Professor, University of Leeds, UK
  • Dr Silke van Dyk, Professor, Friedrich-Schiller-Universität Jena, Germany
  • Dr Vasna Ramasar, Senior Lecturer, Lund University, Sweden
  • Danijela Tamše, Managing Editor of the Journal for the Critique of Science, Imagination, and New Anthropology, Slovenia
  • Dr Camil Ungureanu, Associate Professor, Universitat Pompeu Fabra, Spain
  • Dr Mirela Holy, Lecturer, VERN’ University of Zagreb, Croatia
Posted in Crash Coming Soon | Tagged , , , , | 5 Comments

The Butterfly Defect: How Globalization Creates Systemic Risks

Preface. I’m fascinated by system risks, so I’ve included this, though there’s no awareness at all of peak oil or limits to growth or that energy, not money, is the basis of civilization and foundation of every single widget made and transported.  But since the next economic collapse may well be due to the financial system, and since money is how most people view the world, here are my Kindle notes.  David Korowicz has the best articles about systemic risk, I review three of his publications here.

Alice Friedemann   www.energyskeptic.com  author of “When Trucks Stop Running: Energy and the Future of Transportation”, 2015, Springer and “Crunch! Whole Grain Artisan Chips and Crackers”. Podcasts: Practical Prepping, KunstlerCast 253, KunstlerCast278, Peak Prosperity , XX2 report

***

Ian Goldin & Mike Mariathasan. 2015. The Butterfly Defect: How Globalization Creates Systemic Risks, and What to Do about It. Princeton University Press.

We are so accustomed to globalization that we take for granted the products and services we consume from around the world.

Our information technology (IT) services may run on Israeli software provided from Mumbai as we consume entertainment from Los Angeles filmed in South Africa on computers manufactured in China or Taiwan assembled from parts from more than 20 countries.

Individual and local choices have global impacts and vice versa: what happens outside our borders has direct daily consequences for each of us, every day. These connections are complex, frequently opaque, and often beyond our control. Yet together they are shaping how the world develops. As we will see, there is a growing likelihood that events in one place will have cascading effects in other areas, jumping across national borders and sectors

Globalization can generally be understood as the process driven by and resulting in increased cross-border flows of goods, services, money, people, information, technology, and culture. 2 These flows are multi-dimensional, and the number of connections between them is unprecedentedly large and growing exponentially. It is becoming deeper in that these connections penetrate a growing range of human activities. Increasingly not only people but also things are being connected—cars, phones, merchandise, and a rapidly widening range of inanimate objects and sensors.

two additional examples of global connectivity that we feel are unique and have significantly lowered the transaction costs of economic integration. The first is innovation and technological progress, particularly with respect to computing power and information technologies.

The global movement of goods and people has been facilitated by the expansion and development of an increasingly complex system of roads, railways, shipping routes, and air traffic. In 2008 world container port traffic surpassed the threshold of 500 million TEUs (twenty-foot equivalent units) for the first time and was seven times greater than in 1988. World air travel has more than doubled since the mid-1990s. Over the same period, the real value of world trade has more than quadrupled as the demand for high-value traded goods has risen more rapidly than incomes, and production processes have fragmented geographically with the rise in global value chains, facilitated by more efficient logistics.

Finance, too, has seen a rapid expansion in connectivity and integration. An illustrative measure of volume is the interbank market activity conducted through the Federal Reserve System’s Fedwire interbank payment network. There are an extraordinary 70,000 links in just one day. The right-hand side depicts the core links at 75% of the day’s activity. A more global picture of integration in the financial sector emerges when we consider finance at the multinational level. As well as increased linkages within nations, in the figure we see the corresponding evolution of foreign direct and portfolio investments. The picture that arises from these graphs is one of cross-border capital flows increasing from the late 1980s onward.

Global integration has been a key contributor to recent improvements in living and health standards, but these improvements have for a long time also concealed a mutual interdependence. More than simple connectivity, our increasing interdependence represents complexity.

Our actions are bound to have systemic consequences that we cannot foresee before they occur and often fail to understand afterward; this is true for us individually, but potentially even more so for policy makers and institutions seeking to provide guidance and management in this highly complex environment.

The potential for mutual influence leads us to the second important consequence of complex linkages, an erosion of responsibility that occurs because our actions lead so indirectly to their effects. If a natural disaster disrupts a tightly linked global supply chain, who is to blame for the resulting shortage of cars, computers, or customized machinery? Is the owner responsible for not taking sufficient precautions? Is the manufacturer to be held accountable for operating in a risky location? Is the distributor at fault for using the supply chain without backups? Did the local government fail in its urban management duties by licensing an exposed area for industrial use? Is climate change the reason the disaster occurred in the first place? In this area, as in the case of financial crises, pandemics, and other highly complex cascading risks, it is increasingly difficult to identify the root cause of a hazard or even the channels of its transmission. Increasing global integration is making this task harder.

Complex system researchers Dirk Brockmann, Lars Hufnagel, and Theo Geisel simulated the effects of a single individual infected with severe acute respiratory syndrome (SARS) placed anywhere in the world using data that accounted for 95 percent of the entire global civil aviation traffic and assuming virulence equivalent to that of SARS. 32 Whereas in previous centuries the insular nature of parochial communities would contain such an infection and give the authorities time to consider their options, now two plane journeys on average would require the vaccination of 75 percent of the world’s population to avoid a global pandemic. After three flights, global vaccination would be required.

Analogous patterns of infectious risks spreading throughout the world can also be observed within the economic and infrastructural spheres. By 2009 the global financial crisis that began in 2007 had triggered losses of $4.1 trillion, with its effects felt in every world market. 34 Earlier events exhibited the same pattern of system-wide failure. The widespread implications of the 1929 Great Crash and the more recent 1987 stock market crash show how, already in the twentieth century, world systems were integrated and highly sensitive to distant shocks. More recently the turmoil of 1997–98 that began with the devaluation of the Thai baht led to the financial contagion associated with the Russian loan default, the collapse of the hedge fund Long-Term Capital Management, and crises across Asia.

the specification of contingencies becomes progressively more difficult as transport, communication, and financial and other world systems become increasingly integrated. This is because we start to lose sight of the effects of individual actions, introducing uncertainty and hazard. Given the pace of change, the traditional concepts of risk have become increasingly inappropriate as a basis of modern global governance. This means that the notion of risk needs to be expanded to include nonstochastic elements that cannot be easily quantified or defined using traditional tools and formulas from probability theory and mathematics. The classical distinction between risk and uncertainty is beginning to unravel, in our view, due to rising complexity and the difficulty of classifying real-world phenomena as either of these two. Additional concepts are increasingly required to understand the “possibility” or risk of failure in an increasingly complex and connected world where assigning probabilities to risks is becoming more difficult.

Systemic risk refers to the prospect of a breakdown in the entire system as opposed to the breakdown of individual parts. Implicit in this definition is the understanding that risk and uncertainty become more virulent in systems as the number of linkages grows. A “systemic risk” is a risk of a “common shock which is not the result of direct causation but … [of] indirect impacts.”  This distinction is crucial because it underlines the fact that it is increasingly difficult to identify direct causality for outcomes.

  1. A large shock or “macroshock” triggered when relatively modest tipping points, breaking points, or regime shifts hit their thresholds and produce large, cascading failures in most or all of the system.
  2. A shock propagated through a network via risk sharing (transferring) or contagion (transmission and amplification). The latter involves a cascading failure, that is, the “cumulative losses [that] accrue from an event that sets in motion a series of successive losses along a chain of institutions or markets comprising a system.” 46 3. A “common shock,” which is the result not of direct causation but of indirect effects. These indirect effects can be just as important as direct effects if not more so. 47 Systemic failure is also characterized by “hysteresis,” whereby the effects are much less resilient to recovery and are in some cases irreversible.

Geographical Risk

efficiency concerns rather than strategic political choices or logistical issues that determine the locations of production facilities, financial centers, and organizational hubs. These efficiency concerns have created a new class of geographical or spatial risk. We can divide this new type of risk into two categories: vector risk and density risk.

urbanization and heightened population density in cities. The risk that arises from these is illustrated best in the context of biological hazards and the transmission of viruses and diseases. One noteworthy study estimates that the breakdown of biogeographic barriers and the introduction of invasive species cost the world in excess of $120 billion annually. This cost includes that of the rise of pathogens that directly affect the health of humans, livestock, and animals.

vector risk

second geographical risk, density risk, relates to the growing concentration of activities in solitary or a small number of world epicenters. The global financial system is effectively rooted in New York and London, and global electrical manufacturing is concentrated in certain regions of China and Hong Kong, while Thailand produces 40 percent of the world’s hard disk drives. Silicon Valley continues to be the central hub for most IT engineering and innovation.

When the Nock-ten typhoon hit Thailand in 2011, it affected car and computer manufacturers all over the world because profit-driven outsourcing had led many firms to the same cost-efficient location.

What these instances had in common is that the source of the economic hazard in each case was entirely geographical. Had the financial system been less concentrated in lower Manhattan, the impact of the 9/11 attacks would have been felt, but the financial repercussions would have been lessened.

There are numerous reasons to be concerned about globalization. Our focus is on the systemic risk that is embedded in the current wave of globalization and the complexity it engenders, which give rise to uncertainty and unintended consequences, including the erosion of the responsibilities of individuals and firms. These unintended outcomes are “externalities” because profit-maximizing agents do not incorporate these social costs in their cost–benefit analyses. Systemic risks may thus be considered a contemporary manifestation of the tragedy of the commons. Exploiting Ricardo’s comparative advantage creates efficiency gains but simultaneously fosters interdependence. Using the benefits of trade leads to output growth but also to inequality.

The Internet has increased transparency and the flow of information but equally has the potential to facilitate the spread of rumors and panics as well as cybercrime and aggression.

Container traffic accelerates the transport of goods but enables the proliferation of illegal trade in weapons and spreads viruses and diseases.

Efficiency promotes “monocultures” of products and production and removes the fat that provides a cushion against shocks. Although in agriculture it has long been understood that monocultures are particularly susceptible to disease and extreme weather conditions, these simple insights have been neglected in other domains.

The global financial system has become more interconnected than ever before over the past decade due to policy and regulatory changes that have opened markets combined with the massive surge in computer power described in chapter 1. The increase, however, comes at the expense of a much higher potential for cascading collapse,

It also has been associated with a higher level of dependence on computer systems, which increases the vulnerability of markets to technical failures, human error, and cybercrime. More computing power implies greater complexity in code, increasing the potential for breaches of cybersecurity and also the potential for bugs.

Errors occur not only due to poor programming or interfacing problems but also as the result of human interaction with computers. The most notorious of these mistakes are so-called fat-finger trades, which occur when a trader mistakenly enters the wrong amount for a trade, for example, by keeping a finger on the “0” key on the keypad and adding an additional order of magnitude. On 18 September 2012 a fat-finger trade caused major market volatility when the shares of Rowan Cos., National Oilwell Varco Inc., and other oil drillers and equipment manufacturers jumped between 3 and 9%.  Relying heavily on computer systems carries the inherent risk of unanticipated errors and mistakes as well as increasing vulnerability to cyberfraud or cyberaggression.

Global financial concentration also increased. The share of the top three banks increased from 10% in 1990 to 40% in 2008 in the United States and from about 50% in 1997 to almost 80% in 2008 in the United Kingdom.  Such significant increases in market concentration lead to implicit bailout guarantees by the state in the event of insolvency. These guarantees, as the 2007/2008 crisis shows, can quickly turn into explicit guarantees that erode market discipline and encourage the largest banks to take on excessive risks, safe in the knowledge that they will be rescued if something should go wrong. Moral hazard thus fuels systemic risk

Concentration as a source of systemic risk is not found just in the financial system, however. A number of studies show how concentration in commodity networks also enables firms to exert control over suppliers, “making them captives.”

Financial traders have invented new ways to trade and to gain access to credit. Though marginal at the turn of the century, credit default swaps, collateralized debt obligations and the resale market for capital had all become ubiquitous operations by 2008. In less than a decade the over-the-counter derivative market expanded to 10 times global GDP, or roughly $600,000 billion.

Until 2002, banks issued more corporate debt than asset-backed securities. In 2005, however, banks issued almost twice as much in complex asset-backed securities as in corporate debt. The same trend can be observed when looking at the global issuance of collateralized debt obligations, which increased by a factor of five between 2002 and 2006

Securitization is the process in which banks repackage a number of risky assets (for example, mortgages, credit card receivables, and student loans) and sell claims to different parts of the return stream. Although securitization in itself might not be destabilizing, excessive securitization has a number of detrimental effects, including excessive opacity and complexity. One important reason for the excessive transfer of risk through securitization was that this process was a convenient method to reduce the amount of capital required for a certain risk. The models on which regulatory capital requirements relied had a tendency to overlook tail risks.  This loophole was exploited by banks that took $100 worth of loans for which they had to hold $8 of capital to generate a $100 security for which they had to hold much less, if any, capital. This regulatory and ratings arbitrage made it increasingly attractive for banks to engage in securitized lending. It also implied that the banks’ assets received favorable pricing.

With the endorsement of rating agencies, banks were able to combine small, risky individual mortgages into one large apparently riskless security.

When banks started issuing securitized assets they engineered a way to increase the share of highly rated assets and subsequently reduced the amount of capital they had to hold. In combination with light-touch regulation, securitization allowed banks to leverage up to unprecedented levels. Through securitization, risks could also be transferred to legal entities called special-purpose vehicles (SPVs). These vehicles in certain respects were like a bank, with the crucial difference that they were not subject to regulation. Moving risks to these SPVs was possible due to loopholes in the existing regulatory framework. And even if regulators had wanted to go after such SPVs they could not have done so because these legal entities were set up in places like the Cayman Islands, Liechtenstein, and other regulatory and tax havens. Banks then issued guarantees to the SPVs, which in turn enabled them to issue short-term liabilities (so-called asset-backed commercial papers) to outside investors.

These investors often were very large insurance companies or mutual funds that could not have invested in risky loans but were allowed to purchase these seemingly riskless securities. This apparently endless cycle resulted in a systemic maturity mismatch that ultimately led to a breakdown of markets once “the fuse was set on fire” and Lehman Brothers filed for insolvency. Securitization allowed banks to transfer large risks off their balance sheets, making credit available to investors with a seemingly insatiable appetite for allegedly riskless assets. When banks started leveraging instead of creating larger capital cushions, they were able to expand their balance sheets substantially. More and larger deals led to higher profits for the banks. Yet most of the profits from leveraging were not used to capitalize the banks but were paid out either as dividends or as bonuses, typically based on short-term successes such as revenue increases in a given quarter.

The maturity mismatch that ultimately led to a breakdown of markets once “the fuse was set on fire” and Lehman Brothers filed for insolvency. Securitization allowed banks to transfer large risks off their balance sheets, making credit available to investors with a seemingly insatiable appetite for allegedly riskless assets. When banks started leveraging instead of creating larger capital cushions, they were able to expand their balance sheets substantially. More and larger deals led to higher profits for the banks. Yet most of the profits from leveraging were not used to capitalize the banks but were paid out either as dividends  or as bonuses , typically based on short-term successes such as revenue increases in a given quarter.

Bankscope, https://bankscope2.bvdep.com/ .  A major contributor to instability was the fact that poorly designed remuneration schemes for senior executives and traders favored short-run profits and asset accumulation over prudence and stability. Bankers responded to these incentives, so it should not come as a surprise that they were primarily concerned with maximizing their returns (for example, through leverage) and minimizing each individual’s risk exposure. With the rise of securitization, bonuses on Wall Street tripled within six years, reaching an all-time high of nearly US$35 billion in 2006. The trend did not stop there, though. Even when bonuses were declining, generous dividends were still paid. In 2008, when the crisis reached its pinnacle when the insolvency of the U.S. investment bank Lehman Brothers was declared on 15 September, bonuses and dividend payments totaled about US$130 billion.

The rapid expansion of the sector was aided by a political culture that favored deregulation at the national level, along with resolute noncommittal to international regulation. Due to international competition among the various financial hubs around the globe, a race to the bottom led to the reduction in already weak regulatory standards. In the short term this provided more financial activity, higher revenues, more taxes, and more growth and explains why so many policy makers argued that their domestic financial system had to become “more competitive,” which they took to mean bound by less regulation.

The culture of deregulation became entrenched worldwide despite the efforts of groups such as the Basel Committee on Banking Supervision and warnings of a number of the world’s foremost economists. 3At the height of subprime lending in the United States, the attorneys general of all 50 states were seeking to investigate these risky practices but were “blocked by a coalition of major banks and the Bush administration,” which used the archaic National Banking Act of 1863 to prevent state-level action.  In the United States, the world’s largest national financial market, legislation such as the Glass-Steagall Act had aimed to foster financial stability since the Great Depression. Commercial and investment banking activities were separated, reducing speculation and risk taking by stopping banks from “gambling” with savings. In the decades after Glass-Steagall’s ratification, however, administrations convinced of the merits of uncontrolled capital flow began to undermine such efforts. The repeal of the Glass-Steagall Act by the Gramm-Leach-Bliley Act in 1999 constituted the final removal of the divide between commercial and investment banking.

Now nothing prevented multiple claims from being made against debtors or the implicit extension of deposit insurance.

In order to remain competitive with the U.S. financial market, the European economies felt compelled to create matching opportunities for investors and similarly succumbed to deregulatory pressures.

National deregulation and an integrated market led to a global financial network that Andrew Haldane from the Bank of England has described as a “monoculture.”


At the same time that regulators were stumbling, the collapse of the U.S.-based hedge fund Long-Term Capital Management following the 1997–98 financial crisis signaled that banks deemed “too big to fail” could expect to be bailed out by national governments.

Implicit government guarantees had a substantial impact on banks’ funding costs. One estimate puts the yearly reduction in funding costs due to implicit guarantees at between US$70 billion and US$120 billion between 2002 and 2011. Implicit guarantees are effectively a transfer of wealth from taxpayers to the financial system.

In the buildup to the crisis, the global financial network could be likened to “the dynamics of ecological food webs” or “networks within which infectious diseases spread.”  Within these networks an increasing number of nodes and links, along with the corresponding opportunities to trade and share risks, created the illusion of enhanced financial stability.

In a model of fire sales and market breakdowns, banks face an inherently uncertain environment when assessing counterparty risk. In a network of interbank lending the default risk of a bank depends on the default risk of all the banks’ counter parties. This, in turn, depends on the default risk of the counterparties of counterparties, and so on. It follows that complexity can make healthy banks reluctant to buy, which can lead to the evaporation of liquidity and the breakdown of markets.

Regulation itself has become increasingly complex.  Whereas Basel I, the predecessor of the current Basel III agreement, had a total length of 30 pages in 1988, by the time Basel III is fully implemented in the United States it will take up to 30,000 pages.

The connectivity that had enabled rapid growth suddenly turned to amplifying and spreading systemic risks.

Haldane argues that connectivity is a knife-edge property. Up to a certain point, financial networks and interbank linkages serve as a form of mutual insurance of the financial system and thus contribute to systemic stability. Beyond this point, the same interconnections might serve as shock amplifiers and thus increase systemic fragility.

If a number of banks hold identical or similar assets, this correlation between their portfolios can give rise to a fire sale that is typically associated with significant losses for a large number of banks.

The main idea behind information spillovers is that the insolvency of a bank can increase the re financing costs of the surviving banks—especially in times of crises, when financial markets exhibit herding behavior.

Although a growing chorus of economists cautioned against unchecked deregulation, the mainstream of the profession saw the lowering of transaction costs as economically sensible. These economists provided cover for those in government and business who were un willing to curtail the flow of cheap credit that was driving consumers’ confidence and sense of good fortune. It is never easy to turn off the music or take away the punch bowl while a party is in full swing. Politicians who profited from the bubble in credit and expectations, along with bankers who were intoxicated by bonuses, not surprisingly resisted attempts to enforce tighter standards. Profit overtook reason and common sense. It was not simply the case that institutional procedures were too sluggish to respond to policy directives, or even that politicians and regulators simply ignored expert warnings.


Globalization has facilitated the widespread creation of extensive supply chains, defined as systems of organizations, people, technology, activities, information, and resources involved in moving a product or service from supplier to customer.

China used the power of its economic dominance in the production of this key commodity during a maritime conflict with Japan and blocked the exports of rare earth elements. This episode shows how supply chain dependencies can be exploited to achieve strategic geopolitical goals.

“Globalization requires greatly increased co-ordination of transport by road, rail, sea, air and now also by an entirely new route to market: the internet. This makes logistics vastly more complex. The job of ensuring that all these things work together is known as supply-chain management.”

Between 1951 and 2004, the average annual growth rate of world trade was 5.7 percent.

Declines in the cost of shipping and air transport now make it both possible and profitable for supply chains to operate across a wider range of countries. Companies today function transnationally, outsourcing everything from manufacturing to engineering as raw and processed materials flow from one continent to another.

There was an extraordinary eight-fold increase in China’s exports between 1999 and 2008.

The standardization of container size and freight technology made international transport easier by substantially reducing transaction costs, the virtual world experienced a parallel standardization with the invention of the Internet Protocol Suite, which significantly simplified communication between disparate networks and across borders. World container traffic was almost seven times as high in 2008 as in 1988; in the intervening period, the Internet fundamentally transformed our commercial habits. These two trends were not unrelated.

Toyota relied on efficient transportation platforms and data exchange networks to deliver parts when they were needed but not before. This “just-in-time” manufacturing helped to cut muda and was essential to the “Toyota Way.” Toyota also pioneered the practice of supply chain fragmentation, outsourcing the manufacture of various components to subsidiaries around the world. It was the first company to recognize that by leaving the production of individual parts to specialized suppliers it could optimize efficiency and operate more cost-effectively. This quest for efficiency moved Toyota to open multiple manufacturing facilities in over a dozen countries worldwide. The firm overcame geographic, linguistic, and cultural barriers to search out the most cost-efficient locations, balancing production costs, speed to market, and access to labor.

The prevailing logic of supply chain management today is that the production of goods, where possible, should be outsourced to the most cost-efficient provider.

The strategy of fragmenting supply chains into outsourced locations has proved so profitable that it is now a management standard in many manufacturing industries. The example of flooding in Thailand illustrates what can happen when centers for outsourcing experience problems or, as the Economist puts it, “when the chain breaks.”  The reason that so many different industries were so severely affected by the floods was that cost-minimizing locations such as Thailand tend to be seen to address a range of efficiency concerns. Low taxes, low wages, liberal regulation, and other incentives make specific locations attractive across industries. Although one generally thinks of globalization as a process involving a multiplicity of locations, and thus a geographical diversification of risk, in practice it has also resulted in a concentration of risk and instability. By allowing these nexuses to arise, the world is literally putting all its eggs in one basket and leaving itself vulnerable to highly disruptive hazards.


It can be highly beneficial for an individual student or firm to learn from techniques and procedures that have proven to be successful in the past (the use of best practices). The standardization of management education, however, impairs the ability of graduates to draw from their diverse backgrounds and to react to unexpected circumstances. Uniform teaching of textbook techniques ensures efficiency during standard periods and thus responds well to standard tests. These techniques, however, are unprepared to respond to unexpected circumstances or to react to rare events. With the proliferation of management education, there is standardization and shared models of how to deal with risk. This means that when an event occurs that is not predicted by textbook analysis (and we know from our discussion of global complexity that this is increasingly likely), all managers will be similarly unprepared and will respond in a similar fashion. Systemic risk is, by its nature, surprising. In the face of unusual challenges, there is no manual or textbook response. Ingenuity and the pooling of different perspectives are required. Responding to systemic risk requires managers who can think originally and draw on a heterogeneous set of perspectives to come up with novel solutions to often uniquely testing circumstances.

Researchers at the WTO, for instance, have shown that there is a “resonance effect” between supply chains and monetary circuits. 38 They provide evidence of cross-sectorial systemic risk and identify international supply chains as potential conduits for the spread of financial shocks.

National Strategy for Global Supply Chain Security issued by the White House in January 2012 marks an important step toward containing supply chain risks.

it also raises awareness of the threat of an “adverse impact” on “global economic growth and productivity” that would result from natural disasters such as earthquakes, tsunamis, and volcanic eruptions.


As in the financial sector, it appears that highly interconnected firms lack the resources to appraise all of their risk factors. This is in part because such risks extend to their trading partners, subcontractors, suppliers, and others,

Here complexity not only interferes with the ability of companies to manage risks; it also, as in finance, affects the capacity of regulators to monitor instability.

The effects of outsourcing and subcontracting in global supply chains are in many ways comparable to the effects of securitization and secondary market trading in the financial sector. All of these innovations can diversify risk and may be profitable for individual firms, yet they also fail to account for their negative externalities and the creation of systemic risk. The result in both cases is that profit-driven firms inject unsustainable fragility into the global economy. Supply networks and financial networks are not independent of each other. Whenever a commodity is sold from a supplier to a retailer, the supplier faces the risk that the retailer will file for insolvency after obtaining the good but before making the appropriate payment.

Supply chain risks include everything from natural hazards, terrorism, pandemics, and data security to demand variability and supply fluctuations. Fierce competition and tight margins can further magnify the impact of a supply chain failure on a business…. Economic pressures exacerbate supply chain–related risks particularly in relation to supplier viability given tightening credit markets, downward pressure on costs, and shrinking consumer markets.

Because infrastructure underlies all other sectors, shortcomings in infrastructure spread to other domains with particular virulence—an electrical glitch can lead to a financial collapse, an airport closure can disrupt a global supply chain, and an Internet crash can destroy communications arrays, with infrastructure collapses quickly cascading across sector boundaries. Second, the growing complexity of infrastructure systems and the significance of a small number of increasingly connected nodes mean that particular pinch points in the system are sources of instability.

A few oil refining and transshipment centers account for most U.S. fuel. Power, communication, financial, and other systems are increasingly geographically concentrated, with little real option to relocate. The pace of population and economic growth and the rapid rise in connectivity and technological change mean that in much of the world the supply of infrastructure has lagged further and further behind demand. Many of the networks on which existing transport, water, and sanitation systems rely in the advanced economies are more than 50 years old and in some cases more than a century old and are operating well beyond their design capacity. With the economic crisis reducing the capital allocated to investment in new building and maintenance, a growing number of societies are suffering from increased aging of infrastructure.

Complexity and efficiency.

Today transport networks are operating at close to capacity, and choke-points such as airports (for instance, Chicago’s O’Hare) or junctures (for example, the Suez Canal) process significant shares of regional and even global traffic with wafer-thin margins of flexibility. Through economies of scale, key ports can process far more traffic than smaller competitors and can claim ever-larger regional shares. Similarly, cargo lines using larger and larger ships and planes to transport goods efficiently in bulk have managed to push smaller players out of the market. An over-reliance on critical nodes and lines means that natural disasters and human error are more likely to be amplified and become systemic failures. The second dimension of systemic risk in infrastructure is that, as well as creating a risk of cascading failures, globalization has increased the vulnerability of these critical nodes. As many infrastructure systems become outdated and are under-monitored, they become more vulnerable. High-volume traffic means that there is little time for maintenance. Meanwhile, the international nature of these nodes makes national regulation incomplete and less effective. These two risks can be illustrated simply: complexity means that a failure at one node (for example, an airport) is likely to have systemic consequences that could easily affect multiple sectors of the economy, multiple countries, and millions of only indirectly connected global citizens. Vulnerability means that this one node is more likely to

Environmental disruptions lead to extreme weather conditions and diseases that originate from the ecosystem and put vital systems (such as those for food and energy supplies, telecommunications, and manufacturing production) at risk. The two aspects of environmental risk are linked; as globalization creates risks to the environment, the resulting ecological disruptions cause risks from the biosphere.

Rising water levels resulting from melting ice caps put large numbers of people at risk. More than half of the world’s population lives within 60 kilometers of shorelines, and the rising tides are likely to bring flooding, the contamination of groundwater and crops, and the destruction of homes and livelihoods.


Posted in Crash Coming Soon, Financial | Tagged , , , | 1 Comment

Science magazine on Peak Sand 2017 and 2018

[ Sand is essential to make concrete, glass, silicon for computer chips, and many other products (longer list in Peak Sand), so no wonder top journal “Science” has had two articles on this topic.

Sand mining also ruins ecosystems, lessens biodiversity, impairs water and food security, makes storm surges and tsunamis more destructive, ruins drinking water with salty water, and salinization of cultivated land reduces and even prevents land from being farmed.

In India, illegally mining sand has become very lucrative and the “Sand Mafia” in India has become one of the most powerful and violent organized crime groups. They’ve killed hundreds of people so far in “sand wars”.  As a consequence of sand mining, death stalks people in other ways; standing-water pools created by extraction have increased the prevalence of malaria and other diseases.

These two articles have been shortened.

Alice Friedemann   www.energyskeptic.com  author of “When Trucks Stop Running: Energy and the Future of Transportation”, 2015, Springer and “Crunch! Whole Grain Artisan Chips and Crackers”. Podcasts: Derrick Jensen, Practical Prepping, KunstlerCast 253, KunstlerCast278, Peak Prosperity , XX2 report ]

Larson, C. 2018. Asia’s hunger for sand takes toll on ecology. Science 359: 964-965.

Across Asia, rampant extraction of sand for construction is eroding coastlines and scouring waterways.

Already, scientists have linked poorly regulated and often illegal sand removal to declines in seagrasses in Indonesia and in species such as the Ganges River dolphin and terrapins in India and Malaysia. In eastern China’s Poyang Lake, dredging boats are sucking up tens of millions of tons of sand a year, altering the hydrology of the country’s largest freshwater lake, a way station for migratory birds.

Used to make concrete and glass, sand is an essential ingredient of nearly every modern highway, airport, dam, windowpane, and solar panel. Although desert sand is plentiful, its wind-tumbled particles are too smooth—and therefore not cohesive enough—for construction material. Instead, builders prize sand from quarries, coastlines, and riverbeds.

Between 1994 and 2012, global cement production—a proxy for concrete use—tripled, from 1.37 billion to 3.7 billion tons, driven largely by Asian construction, according to a 2014 report from the United Nations Environment Programme (UNEP). Land reclamation projects, too, have a rapacious hunger for sand. Singapore, for example, has expanded its land area by 22% using sand primarily from Malaysia, Cambodia, and Indonesia as fill. All told, UNEP warned, sand mining—on an industrial scale and by individual operators—“greatly exceeds natural renewal rates” and “is increasing exponentially.”

Scientists are now tracing the collateral damage. A paper under review at Science of the Total Environment  explains how sand mining has driven declines of seagrass meadows off of Indonesia. Sediment plumes stirred up by the dredging block sunlight, impeding photosynthesis, his team has found. The meadows nourish several species, including the dugong, which is in decline.

Another sand mining victim is the southern river terrapin, a critically endangered turtle in Southeast Asia.  “Terrapin habitat cannot be easily replaced,” Chen says, because female turtles return each year to lay eggs at the same beaches.

Also under siege, in Bangladesh and India, is the northern river terrapin. “Sand mining is one of the biggest problems and reasons why they are so endangered today,” says Peter Praschag, a biologist at the Conservation Breeding and Research Center for Turtles in Graz, Austria. “When the sand banks are gone, the [terrapin] is gone.” Other creatures directly affected by river sand mining, scientists say, are the gharial—a rare crocodile found in northern India—and the Ganges River dolphin.

Poyang Lake, a key wintering ground on the East Asian-Australasian Flyway, hosts dozens of migratory species, including almost all of the 4000 or so surviving Siberian cranes. But sand dredging campaigns in the middle Yangtze Basin have expanded rapidly since the early 2000s, when such activities were banned on sections of the lower Yangtze. “Sand mining has significantly lowered the water level, especially in winter,” says Lai Xijun, an environmental hydrologist at the Nanjing Institute of Geography and Limnology in China. Falling lake levels can curtail the birds’ access to aquatic vegetation. And when lake bottom mud dries and hardens, the birds may not be able to pluck out nutritious tubers.

In grasslands near Poyang, the kind and amount of food the cranes consume “may no longer be enough to fuel egg laying” at the levels the birds managed in the past, says James Burnham, a conservation biologist at the University of Wisconsin in Madison. His group has documented a worrisome decline in the ratio of juvenile cranes to adults at Poyang between 2010 and 2012.

Torres, A., et al. September 8, 2017. A looming tragedy of the sand commons. Science.

Increasing sand extraction, trade, and consumption pose global sustainability challenges.

As a morning mist rolls in from the Arabian Sea, young men lead a couple of dozen ox-drawn carts onto a beach south of Mumbai, India’s commercial capital. Using shovels and buckets, they pile their rickety wooden transports high with sand, which they will sell to cement makers. Altering the shoreline is illegal in India, but enforcement of coastal protection zones is lax.

Between 1900 and 2010, the global volume of natural resources used in buildings and transport infrastructure increased 23-fold. Sand and gravel are the largest portion of these primary material inputs (79% or 28.6 gigatons per year in 2010) and are the most extracted group of materials worldwide, exceeding fossil fuels and biomass. In most regions, sand is a common-pool resource, i.e., a resource that is open to all because access can be limited only at high cost. Because of the difficulty in regulating their consumption, common-pool resources are prone to tragedies of the commons as people may selfishly extract them without considering long-term consequences, eventually leading to overexploitation or degradation. Even when sand mining is regulated, it is often subject to rampant illegal extraction and trade. As a result, sand scarcity is an emerging issue with major sociopolitical, economic, and environmental implications.

Rapid urban expansion is the main driver of increasing sand appropriation, because sand is a key ingredient of concrete, asphalt, glass, and electronics. Urban development is thus putting more and more strain on limited sand deposits, causing conflicts around the world. Further strains on sand deposits arise from escalating transformations in the land-sea interface as a result of burgeoning coastal populations, land scarcity, and rising threats from climate change and coastal erosion. Even hydraulic fracturing is among the plethora of activities that demand the use of increasing amounts of sand. In the following, we identify linkages between sand extraction and other global sustainability challenges.

Environmental Impacts

Sand extraction from rivers, beaches, and seafloors affects ecosystem integrity through erosion, physical disturbance of benthic habitats, and suspended sediments. Thus, extensive mining is likely to place enormous burdens on habitats, migratory pathways, ecological communities, and food webs.

For instance, sand mining degrades corals, seaweeds, and seagrass meadows through direct removal during dredging operations, sedimentation, and reduction in light availability that compromises photosynthesis. As a result, it is a driver of biodiversity loss that threatens species on the verge of extinction—such as the Ganges river dolphin—as well as newly discovered species, such as the São Paulo marsh antwren, found in isolated marshes of southeast Brazil that have been heavily degraded by sand mining. Furthermore, sand transport vessels may carry one of the most aggressive freshwater invaders, the Asian clam, although the role of sand transport in the spread of invasive species remains underexplored.

Cascading Effects

Such environmental impacts have cascading effects on the provisioning of ecosystem services and human well-being. For example, sand mining is a frequent cause of shoreline and river erosion and destabilization, which undermine human resilience to natural hazards such as storm surges and tsunami events, especially as sea level continues to rise. In Sri Lanka, extensive sand mining exacerbated the impacts of the 2004 Indian Ocean tsunami; ironically, sand demand for coastal restoration increased in the aftermath of the tsunami.

Extensive sand extraction also impairs water and food security. Extraction-induced erosion and degradation of riverine and coastal systems may disrupt the productivity of both wild (e.g., fisheries) and cultivated (e.g., mariculture and croplands) food sources. In the Mekong Delta, sand mining is responsible for enhanced salt-wedge intrusion during the dry season, which damages domestic water supply and increases salinization of cultivated land in Southeast Asia’s most important food-producing region. In Sri Lanka, saltwater intrusion due to extensive illegal sand mining has affected drinking water supply and led to severe declines in productivity of crops (e.g., coconut, rubber, and tea).

Health impacts associated with sand mining remain poorly characterized, but there is evidence that the conditions created by extracting sand can facilitate the spread of infectious diseases. New standing-water pools created by extraction activities in rivers and stream beds provide potential breeding sites for malaria-transmitting mosquitoes. Hence, sand mining has been associated with the spread of malaria. For example, Soleimani-Ahmadi et al. have shown that in Iran, the most common larval habitats for anopheline larvae of two malaria vectors (Anopheles dthali and Anopheles stephensi) are sandmining pools. Sand mining has also been associated with increased incidence of an emerging bacterial disease, the Buruli ulcer, in West Africa.

The high profits generated by sand trade often lead to social and political conflicts, including violence, rampant illegal extraction and trade, and political tensions between nations. For example, in India, the “Sand Mafia” is considered one of the most powerful and violent organized crime groups, and hundreds of people have been killed in “sand wars”. To gain land through land-reclamation projects, Singapore relies on sand imports from neighboring countries; the latter lose sand and suffer the consequences of mining, frequently leading to political tensions, accusations of illegal sand extraction, and sand export bans.

All these challenges have important implications for environmental justice. The degradation brought about or reinforced through sand extraction places heavy burdens on local populations, especially on farmers, fishers, and those—typically women—fetching water for households. People from these populations may become environmental refugees, as has already happened in Sri Lanka and the Mekong Delta. Increased vulnerability of eroded areas to flooding and landslides may directly displace populations, as shown by the recent relocation of over 1200 households in Vietnam.

Posted in Peak Sand, Tsunami | Tagged , , , , | 4 Comments

Jorg Friedrichs: The future is not what it used to be. climate change and energy scarcity

Preface. This book ranges across many topics and I’ve only included a few bits and pieces.  Friedrichs discusses what to do, recovery, denial, migration, historically how Japan, North Korea, and Cuba reacted to sudden energy decline and based on their politics and economics, how other nations may react.

Alice Friedemann   www.energyskeptic.com  author of “When Trucks Stop Running: Energy and the Future of Transportation”, 2015, Springer and “Crunch! Whole Grain Artisan Chips and Crackers”. Podcasts: Practical Prepping, KunstlerCast 253, KunstlerCast278, Peak Prosperity , XX2 report

***

Jorg Friedrichs. 2013. The Future Is Not What It Used to Be. Climate Change and Energy Scarcity. The MIT Press.

Established energy experts have for a long time retained the veneer of disinterested technocratic competence, with the peak oil community constituting a vocal counterculture.

Mainstream climate scientists, by contrast, have openly embraced a transformational political role and sounded the alarm regarding global warming, with climate skeptics deploring the politicization of science as illegitimate. In energy science the alarmists remain the “cranks,” whereas in climate science they have occupied the mainstream position.

Today, our backbone energy resource is oil. A century ago, it was coal. Even further back, it used to be labor.


I hypothesize a decline of global oil production by 2–5% per year for a couple of decades, after a few years on a bumpy plateau. In line with most of the peak oil literature, I further hypothesize that no adequate alternate resource and technology will be available to replace oil as the energy backbone of industrial society.

An event comparable to peak oil has never happened at the global level.

The fundamental question is why is so little being done about climate change and energy scarcity?

Tackling such problems is hindered because people tend to greatly undervalue future events and distant strangers. The more remote somebody or something is from us, the less we care.  John Maynard Keynes famously cautioned that the long run is “a misleading guide to current affairs. In the long run we are all dead”. Long-term considerations are futile because our life happens now, not some distant future. Therefore we shouldn’t worry about the future and instead focus on the events of the day, which accurately describes the routine behavior of citizens, economic stakeholders, and even politicians who are notoriously concerned about (re)election.

Then there is the problem that the pursuit of particular interests often thwarts collectively desirable outcomes.  Even if we all agree that something needs to be done, most of us may not be ready to do it.

Finally there is denial: people frequently treat real problems as if they were non-issues. Denial has a rational core because it minimizes pain, but it often leads to tragic outcomes. Denial is not irrational. When in denial, people follow what they think to be in their best interest by minimizing real or perceived harm, thereby maximizing well-being. Acknowledging a problem may lead to considerable psychological and social cost: negative emotions such as fear, shame, and helplessness; cognitive dissonance; loss of identity, or loss of friends; embarrassment; and social conflict about the attribution of blame and responsibility. Many people are predisposed to minimize such psychosocial cost with denial rather than facing up to their problems. This may be short-sighted, but it isn’t irrational.  Denial is based on a self-interested rationale of pain avoidance and harm minimization.  Also, deep down, people know that climate change and energy scarcity are existential predicaments that can’t be solved, so denial is a good way to treat these problems as non-issues.

It is unrealistic to assume that human ingenuity is an unlimited resource. A more realistic view is that, at the end of the day, even ingenuity is subject to the law of diminishing returns, with the lowest hanging fruit picked first. If this is so, then technical innovation is bound to become more and more challenging because of diminishing returns to investment in research and development  (Strumsky, Lobo, and Tainter 2010; cf. Tainter 1988; Homer-Dixon 2006).  Today, technical ingenuity requires escalating amounts of money and time.

Climate Change

As with rising temperature, there is a hopeful but naive view holding that a global increase in precipitation should improve secure access to water. Unfortunately, once again this is not the case. While it is true that climate change will increase the total amount of fresh water available to human societies and natural ecosystems, on the local and regional level precipitation patterns will become significantly more unequal and erratic. Rainfall is expected to increase in areas that are already humid, such as moist tropics and high latitudes like Siberia and northern Canada. In relatively dry mid-latitudes such as the Mediterranean, as well as semi-arid low latitudes such as southern Africa, by contrast, precipitation levels are expected to decrease. In humid mid-latitudes, such as the northern part of Europe, the climate is expected to become drier in summer and wetter in winter, leading to a higher risk of undesirable summer droughts and winter floods. On balance, the number of people living in areas suffering from water stresses is likely to increase.

Few people on this planet will be exempt from more frequent and more intense droughts, floods, heat waves, and perhaps even cold spells.

There are considerable uncertainties related to the large ice sheets of Greenland and Antarctica. In principle it would take thousands of years for these to melt, but the pace of sea level rise will dramatically increase should they “slide” into the ocean.

Contrary to the rosy scenarios depicted by some, even the Far North will suffer from more weather extremes, rising sea levels, and the risk of radical discontinuities. Polar agriculture is extremely susceptible to soil erosion. Although the effects may be positive in some locations on some occasions—for example, in Siberia in a year without either flood or drought—they will be negative in most places most of the time.

Peak Oil

These people claim that, regardless of climate change, the world is about to face disruptive energy scarcities on the supply side, due to the imminent peak of virtually any non-renewable energy resource from oil to gas, and from coal to uranium.

They propound four reasons why crude oil production cannot stay for long on this plateau, and why the world supply of liquid fuels will soon enter a rapid decline. First, there is a runaway decline in output from existing oil fields. Second, unconventional oil and alternate liquid fuels are already struggling to compensate for the decline. Third, energy return on energy investment (EROI) is declining. Fourth, there is not enough oil “yet to be found” and “yet to be developed.

What to Do

Voluntary simplification is usually not an option, as the current level of complexity is needed to cope with existing problems. Therefore, involuntary collapse is often the only way for the fragments to enter a new equilibrium at a significantly lower level of social and political complexity.

Alas, community solutions cannot work without considerable solidarity and social cohesion. This is precisely what is lacking in rich industrial countries, where social capital has been undermined by the effects of economic affluence and mass consumerism (Putnam 2000). Under such circumstances, the deliberate investment in community solutions can only be a fringe phenomenon. A genuine communal revival is not likely to happen unless and until it is forced by systemic collapse (Greer 2008; Kuecker and Hall 2011). With due respect to environmentally conscious individuals, it may take a dreadful period of “dark ages” to force the fragments of industrial society to find a new sustainable equilibrium (Chew 2007, 2008). Moreover, with due respect to well-meaning communitarians and local activists, modern civic achievements such as multiculturalism and gender equality may be lost when industrial civilization is replaced by land-based neo-traditionalist lifestyles.

Recovery

If we assume a large-scale collapse, then a recovery will certainly be difficult. For example, it would be hard to resume advanced mining operations after a serious deterioration of the industrial base. It would also be difficult to reactivate networked infrastructure, including advanced information technology, once their industrial underpinnings are gone.


In the long run, however, there is also significant good news for people living in poor countries: they should be able to preserve more of their way of life than people living in rich industrial societies. If we imagine a systemic demise of world industrial civilization, people in poor countries may often be in a better position to recover from mayhem than individuals living in rich countries. The reason is that the solidarity and social cohesion of many communities in poor countries is tighter, which makes them more resilient compared to individuals from wealthy consumer societies.

After the American Civil War, Dixieland was deprived of slaves as the backbone resource of the “Southern” way of life. Without prior knowledge, one would probably expect this to be a clear-cut case of a smooth transition. After all, Southerners only had to look to the northern part of the United States for investment and innovative technologies. Nevertheless, the modernization of Dixieland took a century if not more. Insofar as similar upgrades do not seem to be available in the event of peak oil, there is no reason to be particularly optimistic about a smooth transition to a post-oil (or even post-carbon) society.

Migration

When facing serious problems, ancient civilizations were sometimes able to become more sophisticated. Another strategy available to them was to increase their resource base by occupying and exploiting new land at their periphery. When everything else failed, one result was a great migration. People from marginal communities would exploit the relative weakness of the apex civilization, while people from the apex civilization would leave their areas of origin in search of better habitats. Similar kinds of migration are likely to remain a typical response to climatic stresses (Piguet, Pécoud, and De Guchteneire 2011). But whereas the survivors from the collapse of ancient civilizations, such as the Mayans in the ninth century, could effectively disperse into the wilderness, habitat tracking is not going to be an adaptive systemic response in a world crowded by seven to nine billion people (Weiss and Bradley 2001, 610).


Modeling

Ever since the 1970s scholars have explored world models to understand the global dynamics of resource depletion and scarcity (Meadows 1972; Council on Environmental Quality and U.S. Department of State 1980, Meadows 2004).

This is valid but for two reasons can’t work for our present purposes. One is that formal models tell us little about the social and political consequences of disruptive energy scarcity. Most focus on physical flows and/or economic processes, but the passage from there to the socio political sphere is difficult.

Another problem is that the assumptions underlying the models are starkly contested. Some models are based on general equilibrium theory (IMF 2011; Waisman 2012), while others rest on ecological economics (Ayres 2009). Some take a linear view of technological progress (IEA 2010b, 2012b), while critics emphasize the non-linearities and tipping points (Korowicz 2010). Some models concentrate on material flows (Meadows 2004), while others take the financial economy into account (Turner 2011). The relatively simple yet powerful model developed by Jaromir Benes and colleagues (2012) is probably as good as it gets, but still leaves many crucial questions open as the authors readily acknowledge. The result is that virtually any vision of the future is supported by some formal model. To avoid such indeterminacy, my analysis rests on a historically and empirically more grounded strategy by examining specific cases when socioeconomic and political systems have actually experienced disruptive energy scarcity.

Lessons from the past.  Predatory Militarism: Japan, 1918–1945


In September 1945, defeated Japan was so fuel-starved that it was difficult to find an ambulance with sufficient fuel to transport Premier Tojo to a hospital after his attempted suicide. Pine roots had been dug out from mountainsides all over the country in a desperate attempt to find a resinous substitute to fossil fuel. Much of the Japanese air force and navy had been sacrificed in kamikaze raids, at least in part because there was not sufficient petrol to refuel planes and ships to return from their sorties and keep fighting (Yergin 1991).

Ultimately, Japanese fuel starvation was the result of a self-fulfilling prophecy. Originally, it had been the fear of military and economic strangulation by an oil embargo that led Japan to radicalize its strategy of imperial expansion and to fatefully engage in full-blown predatory militarism. This in turn led precisely to the fuel starvation that Japanese planners were dreading so much.

Ever since the late 19th century, a modernizing Japan had been committed to military conquest in order to compete against overextended European empires. The strategy was to emulate countries like Britain and France in their effort to achieve prosperity, power, and glory by the acquisition of overseas territories. In the absence of adequate power projection capabilities, Japan’s strategy was concentrated on East Asia where it won a war against China, conquering Korea and Taiwan (1895), and another war against Russia consolidating its territorial claim on Korea and expanding its influence into Manchuria (1905). Japan’s participation in World War I further expanded its overseas territories to encompass former German possessions.

The main lesson the Japanese military took home from World War I was that a country cut off from access to raw materials was bound to lose in a military contest due to a trade embargo. In their view, Germany had lost the war because it did not muster the necessary industrial base or access to foreign markets to achieve wartime autarky. To be prepared for a similar war, resource-poor Japan would have to control access to strategic resources. Only a self-sufficient economic bloc in East Asia would sufficiently prop up Japanese industrial capacity to secure the desired status of a great power. From this perspective, the US-sponsored Open Door policy of free trade in the Pacific was not in Japan’s interest.

While Japan could stockpile considerable amounts of petroleum and other strategic resources, such stockpiles would not be sufficient in the event of a protracted war to be fought without foreign oil imports. Since the United States was the dominant producer of petroleum at the time, Japan was heavily dependent on American deliveries. Japan was importing 90% of its petroleum consumption, of which 75–80% was shipped in from California. For the critically important gasoline, the dependence was even higher.

With that in mind, it is easy to understand (certainly not to condone) what happened when Tokyo felt threatened by the specter of a US trade embargo: the limited Japanese onslaught in East Asia degenerated into what was to become the relentless Pacific War. The only alternative to importing oil from the United States was looting it from Borneo and Sumatra in the East Indies.

Totalitarian Retrenchment: North Korea, 1990s

During the 1990s the totalitarian regime of North Korea, formally known as the Democratic People’s Republic of Korea, retrenched in order to preserve elite privileges.

In 1990, estimated per capita energy use was twice as large in North Korea as in China and more than half that of Japan. Life expectancy was high, and over 60% of the population was urban. Their industry, which was based on coal and steel, was as wasteful as in any other Soviet country. In line with the national ideology of self-reliance (juche), up until the 1980s the regime had heavily invested in coal mines and hydropower to satisfy the country’s enormous energy needs. Furthermore, Pyongyang had developed a toxic “modern” industrial agriculture to feed the highly urbanized North Korean population. Farming was based on irrigation, mechanization, electrification, and the prodigal use of chemicals.

The North Korean economy was geared toward domestic consumption and did not produce any competitive export staple, except for some advanced weapon systems. The country was thus running a permanent trade deficit, and its economy was not in a position to generate the revenues necessary to substitute for the subsidized energy inputs that were being delivered by external protectors.

The situation came to a head in 1991 when post-soviet Russia stopped subsidized exports of oil and other vital goods to North Korea.  Two years later, Russian exports to North Korea were down by 90%. This had dramatic effects. While the North Korean regime reserved most remaining fuel for the military, the rest of the industry nearly collapsed and agricultural production languished around subsistence level.

The North Korean Great Famine is a paradigm example of how the shortage of a backbone energy resource such as oil can have momentous systemic ripple effects. To begin with, agricultural machinery depended on oil. Without fuel, tractors and other machines were not running. The next problem was transportation. Fuel was needed to transport fertilizer and other inputs to farms, and agricultural products to urban consumers. Fuel was also needed to ship coal from mines to fertilizer plants, where coal was converted into soil nutrients. Fuel was further needed to get coal to power stations for electricity generation. As a consequence, electricity was yet another problem.

Without sufficient electricity, irrigation pumping and electrical railways became intermittent. The intermittency of electrical railways further affected transportation. Without reliable trains, it became even more difficult to bring coal to fertilizer plants or power stations, to transport fertilizer to farms, and to get agricultural products to urban consumers. Thus, interlocking energy shortages, combined with shortages of industrial inputs and a general decline in infrastructure, produced a dramatic decline in production, and thus an almost hopeless situation.

While the entire economy was damaged, the consequences were most dramatic in agriculture and resulted in plummeting food production, considerable loss of arable land, and a rapid depletion of soil fertility. Restoring soil fertility would have required large amounts of lime, which could not be transported without fuel. The regime sent more urban workers and school children to the fields, but this did not compensate for the losses. In a desperate attempt to replace agricultural machinery, most animals for meat consumption were culled and draft oxen slowly became more numerous. But, unlike tractors, working animals compete with humans for food. The energy crisis also compelled many poor people to rely on biomass for cooking and heating. Unlike fossil fuel, however, the extraction of biomass reduces soil fertility, which in turn aggravated the agricultural crisis. As a result of these and other interlocking vicious circles, the production of rice and maize fell by almost 50% between 1991 and 1998. The public food distribution system crumbled. Since distributed food rations were the most important form of payment to workers, this led to a further decline of industrial activity.

Since North Korea’s industrial agriculture cannot be restored without a viable energy regime, even today there is still a protracted food crisis with an ever-present risk of further starvation. Because the problem is structural, international food deliveries cannot solve it.

Cuba

When taking into account the fact that heavily subsidized oil deliveries from China to North Korea lasted until 1993, the Cuban supply shock was even more abrupt and dramatic. Subsidized energy supplies from the Soviet Bloc declined between 1989 and 1993 at a whopping 71%. The crisis entirely devastated the Cuban economy. Machines lay idle in the absence of fuel and spare parts. Public and private transportation were in shambles, with people walking and cycling long distances or riding on modified vans called “camel buses.” Workers had difficulty getting to their jobs. Factories and households all over the island were struck by rampant and unpredictable electrical power outages. As in North Korea, the most painful effects were felt in the food sector. From a daily chore under real communism, the procurement of food became a real source of anxiety to consumers. The nutritional intake of the average Cuban, especially protein and fat, fell considerably below the level of basic human needs. Consumers resorted to chopped-up grapefruit peel as a surrogate for beef, and some people started breeding chickens in their flats or raising livestock on their balconies.

The immediate reaction of the Cuban regime was predictable: mobilize the masses for food production, and revitalize the state sector. Townsfolk were sent to the countryside for farm labor, but after more than 40 years of real communism there was little revolutionary fervor left in the population. Also, the state sector was too sclerotic to be converted from sugar and coffee to potatoes and beans. Despite world market prices for sugar below production costs, state farms continued to produce sugarcane.

The next response of the Cuban regime was cautious liberalization and reform. To begin with, the regime moved from toleration to the controlled legalization of certain black-market and informal-sector activities. To attract hard currency, the country was cautiously opened to Western tourists. The US dollar was legalized as a parallel currency. Control over numerous state farms was partly devolved to the employees and management. All of this contributed to a burgeoning informal and semi-informal sector, which quickly took on its own dynamic and significantly contributed to the provisioning of the Cuban population.

This strategy was not only more flexible and pragmatic but also considerably more humane than the approach taken by Havana’s communist counterpart in Pyongyang. Overall, the regime in Havana enlisted the Cuban population in an aggressive import substitution program.

The policy was a tall order for a country that continued to suffer from the historical trade embargo imposed by its most obvious economic partner, the United States. As a consequence, tractors had to be substituted with oxen, and fertilizer with manure, in order to revitalize agricultural production and feed the population. At any rate, the real miracle was performed by the Cuban people. Against all odds, ordinary people managed to get by due to the remarkable cohesion of Cuban society at the level of local communities and neighborhoods.

Although Cuba is highly urbanized, the typical barrio is an urban village. Cuba’s multigenerational family households are tightly embedded in neighborhood life. The typical household is shared by an extended family including aunts, uncles, and cousins. One-person households are very rare. Most families have lived in the same home for generations. The occupational structure tends to be mixed, with some members of a household working in the official sector, others in the informal economy, and yet others dedicated to reproduction and care. People cultivate close relationships with friends and relatives inside and outside their barrio.

One should not idealize this. In the early 1990s, families were stuck in their homes because the regime had frozen the property structure after the revolution. Thus, people were cramped into narrow spaces because they had no other choice. The regime had invested in community cohesion not so much to create social glue, but rather to sustain political control. Moreover, communitarian neighborhood life is not just cozy. It is also rife with gossip and strife.

Be that as it may, what ultimately matters is that most Cubans could rely on their families, friends, and neighbors. In a survey, 86% of people from vulnerable neighborhoods in Havana declared that they could count on support from relatives, 97% from friends, and 89% from neighbors. This local solidarity, or social capital, helped ordinary Cubans to make ends meet during the Special Period. As one inhabitant of a vulnerable neighborhood put it, the crisis brought people closer together because it forced them to rely on one another.

In the countryside, there were deliberate efforts to link people with the land. Labor organization on state farms was shifted from collectivist “brigades” to the territorial organization of workforce by ranches (granjas) and farms (fincas), which were further subdivided into dairies (vaquerías) and plots (lotes). State farms and agricultural cooperatives were expected to provide their own food, both for canteens and for private consumption. Some factories had workers cultivate land to cater to their food needs. Elsewhere, workers were encouraged to have their own small plots where they could produce food for their families. Thus, localities in the Cuban countryside became increasingly self-sufficient. Traditional knowledge was another decisive factor in feeding the population. Although most land had been collectivized after the revolution of 1959, about 4% of Cuban farmers had kept their land. Another 11% was organized in private cooperatives.

The survival of traditional family farms and private cooperatives alongside industrial agriculture turned out to be an important asset. Independent farms were more resilient to the crisis than state farms because they operated with less fuel and agrochemical inputs. Cuba’s surviving family farmers kept alive important traditional knowledge that could now be recovered.

Other formerly independent farmers had moved to towns and cities, where they provided valuable know-how for urban agriculture. Urban agriculture was a local self-help movement, facilitated by the availability of traditional knowledge in combination with technologies of organic gardening and the Cuban-specific rustic ingenuity. Idle stretches of land between concrete blocks or in urban peripheries were turned into makeshift organic gardens. Vacant or abandoned plots in close vicinity to people’s homes were transformed into plantation sites. People used whatever urban wastelands they could occupy to grow vegetables and other foodstuffs.

The movement was purposefully augmented by the regime, but the real action was at the grassroots level. By the mid-1990s, there were hundreds of registered horticultural clubs in Havana alone. An urban cultivator from Havana explained: “When the Special Period started, horticultural clubs were organized by farmers themselves. . . . Special emphasis was made to involve the whole family in these activities. . . . We wanted also to develop more collaboration and mutual help among ourselves; we exchanged seeds, varieties, and experiences. We achieved a sense and spirit of mutual help, solidarity, and we learned about agricultural production”.

Again, one should not idealize this. Environmentalists have exalted urban farming during the Special Period as a social experiment, or even as an alternative model of organic agriculture In reality, Cuba’s detour into low-input agriculture was obviously driven not so much by ecological consciousness as by dire necessity. From the second half of the 1990s, when the economic situation improved and agrochemical inputs became more available again, many reforms were aborted, and Cuba started drifting back to industrial farming. This was helped by subsidized oil deliveries from Venezuela. At the same time, foreign investment enabled Cuba to cover about half of its oil and gas consumption from domestic sources. Nevertheless, it is highly encouraging to note that, during the early and mid-1990s, Cubans managed for a few years to mitigate an extremely disruptive energy scarcity by their remarkable community ethos. The comparison with North Korea shows that this was not a minor achievement.

Peak Oil Trajectories


This obviously does not imply that responses to a terminal decline of world oil production would follow exactly the same lines as the national reactions to oil supply disruptions described in my case studies. Japan in the 1930s, as well as North Korea and Cuba in the 1990s, were unique places. It clearly makes a difference that today all oil-importing countries are tightly integrated in global market structures. Another difference is that, while even a gradual decline of world oil supply would be extremely disruptive for oil importing countries, the onset of mounting energy scarcity after peak oil would be somewhat less abrupt than it was in the cases of North Korea and Cuba.

Countries prone to military solutions may follow a Japanese-style strategy of predatory militarism. Countries with a recent authoritarian tradition may follow a North Korean path of totalitarian retrenchment. Countries with a strong community ethos may be able to embark on Cuban-style socioeconomic adaptation.

It is of course possible to imagine additional reactive patterns, such as the mobilization of national sentiment by populist regimes. Even so, the trajectories identified can help us to derive plausible hypotheses on how different parts of the world would be likely to react to disruptive energy scarcity after peak oil.

Given its unrivaled military capabilities, the United States is the most obvious candidate for a Japanese-style strategy of predatory militarism. Simply put, the United States may be tempted to use its unique power-projection capacity to secure privileged access to oil. It has happened sometimes in the past, and may happen more often in the future, that US decision makers find military coercion more effective than trade. Increased domestic production of unconventional oil in the United States and Canada may obviate the drive for predatory militarism, but this is premised on the continuation of the current boom of shale oil and tar sands.


The People’s Republic of China (PRC) may be tempted to use its military muscle to secure access to oil and gas in Central Asia and, possibly, in the South China Sea. Elsewhere, the PRC would be unlikely to use a predatory strategy because, for the foreseeable future, its maritime forces and air power are no match for the United States.

Countries like India and Israel have even more limited military capabilities, but may nevertheless be tempted to engage in geopolitical operations in their regional neighborhood to secure access to vital energy resources.

A North Korean-style solution of totalitarian retrenchment that screws the population to preserve elite privileges is most likely to occur in countries with a strong authoritarian tradition. In consolidated democracies, totalitarian retrenchment is much harder to imagine. Nevertheless, the history of 20th-century Europe shows that even liberal democracies can and do sometimes degenerate into tyranny. It is difficult to predict to what point even in consolidated liberal democracies the political culture could deteriorate in a protracted and serious crisis. Political elites in less consolidated democracies might experience fewer constraints and scruples right from the start. For example, elites in the second-wave democracies of Latin America may have lesser qualms than their counterparts in Western Europe about screwing their own populace to preserve their privileges.

Compared to predatory militarism and totalitarian retrenchment, Cuban-style socioeconomic adaptation is normatively more desirable. At the local level, people in many developing countries may be able to mitigate the effects of disruptive energy scarcity by reverting to community-based values and a subsistence lifestyle. Such a regression would be comparatively easy for people in societies where individualism, industrialism, and mass consumerism have not yet struck deep roots.

By contrast, socioeconomic adaptation would be far more difficult for people in Western societies where individualism, industrialism, and mass consumerism have held sway for such a long time that a smooth regression is hard to imagine.

And yet, survival in many presently industrial Western societies may ultimately depend on the mobilization of support from local communities and a subsistence-based lifestyle (Hopkins 2008; Murphy 2008; Orlov 2008; Holmgren 2009; Rubin 2009; De Young and Princen 2012).

In abstract terms, this leaves us with three causal propositions, or hypotheses.

Hypothesis 1 The greater a country’s military potential and the stronger the perception that force is more effective than the free market to protect access to vital resources, the more likely there will be a strategy of predatory militarism.

Hypothesis 2 The shorter the time and the less a country or society has practiced humanism, pluralism, and liberal democracy, the more likely its elites will be willing and able to impose a policy of totalitarian retrenchment.

Hypothesis 3 The shorter the time and the less a country or society has been exposed to individualism, industrialism, and mass consumerism, the more likely a regression to community-based values and a subsistence lifestyle.

In the transition, large private Western oil companies such as Exxon and Shell would lose further ground to the state-controlled companies of oil-exporting countries such as Saudi Aramco or Nigeria’s NNPC. As a consequence, oil-importing countries would increasingly rely on state-controlled companies such as China’s CNPC. Both in the realm of power politics and the “marketplace of ideas,” the ability of Western countries to impose liberal democracy through instruments such as development assistance and economic conditionality would further dwindle. This can be formulated as yet another causal proposition, or hypothesis.

Hypothesis 4 In the event of peak oil, there will be winners and losers. It seems reasonable to expect a redistribution of power and wealth from oil importers to oil exporters, and from private to state-controlled companies.

The Energy Transition?

The energy transition beyond oil or beyond carbon is likely to be even more challenging and protracted than past energy shifts. Rather than studying past energy upgrades, we must look at a situation where the challenge was to radically alter an entrenched socioeconomic way of life. This suggests another case study: the US South or Dixieland, after the American Civil War (1861–1865). What can be gleaned from this case is that the formation of the “new consciousness” necessary for radical social change is a slow and painful process. The socioeconomic backbone resource of the Old South was neither coal nor oil, but human slaves. Precisely because the slave economy worked, white Southerners were willing to defend it in a bloody civil war. After the end of the American Civil War, the forceful abolition of slavery plunged the Old South into a deep crisis.

Despite the introduction of representation and suffrage for former slaves, reconstruction was mostly thwarted by the recalcitrance of traditionalist Southern elites. Heavy subsidization of railroads by Republican state governments in the South did not lead to the hoped-for modernization, but rather to corruption, making a few investors rich and otherwise contributing to soaring public deficits. After the withdrawal of the last federal troops from the South, race inequality was reestablished under the banner of white supremacy.

Despite their conservative values, they were not entirely prevented by these from cautiously embracing industrial capitalism. Initially, this amounted to an uneasy compromise between cherished industrialization and dreaded modernization. On the one hand, Southern elites became obsessed with the idea that an industrializing “New South” would rise like a phoenix from the ashes of the “Old South.” On the other hand, they remained loyal to time-honored values of agrarianism and patriarchal society.

While railroads were finally built on a massive scale, often with capital from the North, industrialization in the South was initially dominated by low-wage and labor-intensive manufacturing. Most industries were dedicated to the processing of agricultural goods (e.g., in cotton mills) or natural resources (e.g., in blast furnaces). The real industrial takeoff came much later, after several generations of socioeconomic backwardness, and was spurred by the New Deal of the 1930s (electrification) and the war economy of World War II. In the mid-twentieth century, Dixieland finally developed as a growth region and came to be seen as part of the American “Sunbelt”. The Civil Rights Act of 1964 famously put an end to official race segregation in the South, although some race issues remain until the present day.

While this amounts to a decently happy ending, it took a century for the South to recover and catch up. This is remarkable because to understand how a technological and socioeconomic upgrade might look, Southerners only had to look to the North of their own country. There, industrial capitalism with its superior technologies and know-how was unfolding before their very eyes. With the right incentives in place, attracting investment and technology transfers from the North would not have been too difficult.

Dixie is a cautionary tale for those who believe that, after peak oil, there will be a smooth technological upgrade. If—even in the US South despite uniquely favorable circumstances—adaptation took a full century, then a technological upgrade will be even harder under the more challenging circumstances of disruptive energy scarcity after peak oil. This time around, the world would be struggling with an industrial downgrade, rather than an upgrade, as in the case of the US South. Developing new energy technologies is never fast and easy, and even less so in times of crisis. After peak oil, we should therefore expect extremely slow and painful processes of social and technological adjustment that may easily last for a century or more (Haberl et al. 2011).

Hypothesis 5 In the event of peak oil, we should not expect either immediate collapse or a smooth transition. People do not give up their lifestyle easily. We should expect painful adaptation processes that may last for a century or more.

Social and political effects of climate-change-induced energy scarcity

Military campaigns are highly carbon intensive and require advanced industrial capabilities, which would be rapidly dwindling among the signatories to the compact. As a consequence, it would become increasingly difficult for the signatories to stop the predatory behavior of the outsiders.

Elites may secure privileged access to the remaining allocations at the expense of the rest of the population, to the point of establishing antidemocratic political regimes (totalitarian retrenchment).

Please note that a scenario is not a prediction. A scenario is based on assumptions. As mentioned above, I follow the peak oil literature in assuming a decline of world oil production by 2–5 percent per year, after a few years on a bumpy plateau. Moreover, I assume that no adequate alternate resource and technology will be available to replace oil as the energy backbone of industrial society.

In North America, the United States combines strong dependency on foreign oil deliveries with an unrivaled capacity to project power. The current surge of shale oil may postpone this for a decade or two, but ultimately a military strategy will be tempting. To be sure, America’s liberal democracy and free-trade ideology militates against the open recourse to military coercion. The United States is going to support liberal democracy and the free market for oil as long as it is convenient. Even when the oil market comes under pressure because of tightening international supply, the United States is likely to continue to defend it for a while.

But when soaring oil prices start crippling the American economy, US leaders may find that military coercion is more effective and can be justified in terms of protecting free trade. The United States is then likely to put the blame on foreigners and pursue a geopolitical strategy of energy security to protect the free market and/or the American way of life (Klare 2004, 2008). Why keep negotiating with recalcitrant leaders such as Hugo Chavez if there is a military option? This is not to say that the military option is easy, as the Iraq War has shown. Moreover, liberal democracy in the homeland can be corroded by illiberal practices abroad. Nevertheless, military coercion is likely to gain ascendancy relative to free-market rhetoric as oil supplies dwindle. The resource-rich neighbors of the United States, Canada and Mexico, are likely to be tied more closely to the US core. In Latin America, medium-sized oil-exporting countries such as Venezuela and Ecuador may try to profiteer from soaring oil prices. If they engage in a strategy of brinkmanship and deny the United States oil on favorable terms, then their political regimes may be toppled. While this would further increase anti-American resentment in the region, political elites are likely to acquiesce, ultimately, to US hardball tactics. In fact, historical evidence suggests that Latin American elites often opportunistically collude with the United States. Eventually, resource-rich Brazil may be able to escape intervention due to its larger size and geographical distance from the United States. If Brazil manages to offer sufficient benefits to neighboring countries, a regional state complex around Brazil may eventually be possible. Otherwise, energy-poor Latin American countries would enter a serious crisis.

Western Europe would enter a particularly difficult quandary. In theory, advanced industrial countries such as Germany and France could quickly rearm. In practice, however, predatory militarism is not a credible option for them. Since Europeans have good historical reasons to dread militarism, the social consensus necessary for this strategy would not be forthcoming at the decisive initial stages of geopolitical positioning. For the same historical reasons, in most of Western Europe the path of totalitarian retrenchment does not seem to be available either. Concomitantly, Western European countries would be forced to strike opportunistic bargains with Russia and oil-exporting countries across the Mediterranean. Due to their asymmetrical nature, such deals would be inherently fragile and subject to constant renegotiation. Investment in renewable energy and innovative technologies could somewhat smooth the transition, but ultimately Europeans would hardly be able to avoid a transition to a more community-based lifestyle. Despite the present affluence of Western European societies (and, in part, precisely because of it), this would be extremely painful and last for generations.

Ordinary Western Europeans would be forced to rely on local communities for their welfare, if not their survival. For most of the indigenous population, a regression to community-based values and a subsistence lifestyle would be challenging because the habits of industrial society are deeply rooted. The problems would be compounded by the fact that immigrant groups might segregate from Europe’s multiethnic societies, potentially reinforcing religious fault lines. On the one hand, this might enhance the solidarity among members of specific social groups. On the other hand, it would almost certainly conjure up severe social conflict.

The situation in Japan would be largely comparable, although Japan is far less multiethnic and Japanese people may be more willing to accept disruptions to their taken-for-granted lifestyles. This was confirmed in 2011 when the Japanese responded in a calm and disciplined way to a tsunami followed by serious mayhem and a nuclear meltdown at the facilities in Fukushima. As in the Western European case, however, the unavoidable transition to community-based values and a subsistence lifestyle would be painful and last for generations.


The situation would be somewhat different in countries and regions that have industrialized later and/or have a more recent authoritarian tradition that can be recovered. Therefore, totalitarian retrenchment and socioeconomic adaptation are more likely and easier to imagine in the new democracies and semi-authoritarian countries of Eastern Europe and Southeast Asia than in Western Europe, Japan, Australia, Canada, or the United States.

In least developed countries (LDCs), common people with limited exposure to industrial lifestyles would be forced to rely on the cohesion of social groups for their survival. Given the high population pressure in most LDCs, however, large population segments would fall victim to famine, disease, and conflict. Particularly but not exclusively in sub-Saharan Africa, state failure and conflict over scarce resources would become endemic. Moreover, the inevitable end of the oil-based green revolution in agriculture and the demise of international aid would wreak environmental havoc and human insecurity.

The ecological situation would be aggravated by vital biomass being removed from the soil as a combustible. In most places, the unavoidable consequence would be famine, disease, and mass exodus.

The elites of oil-exporting African kleptocracies such as Nigeria, Angola, and Equatorial Guinea would certainly keep selling their oil to the highest bidder, especially when the bid is backed by sufficient military clout, and when there are no onerous obligations with regard to democratization and human rights. If the United States gives up its dysfunctional democratization agenda, it will have better access to African resources than Europe, China, or Japan. However, it is an open question how much ordinary people in African petro-states would benefit from the increased oil revenues (people in African countries that do not have rich fossil fuel reserves would almost certainly suffer more).

In Asia, Russia has enough resources to provide for its own energy needs. In geopolitical terms, it would become a more important regional player due to its abundant export capacities. China, by contrast, heavily relies on imported oil. To preserve its industrial capacity, the country might be tempted to secure access to vital resources from Central Asia by military means. Totalitarian retrenchment may also be lurking. India has more limited military clout and a less authoritarian state tradition, but may nevertheless be tempted to engage in limited geopolitical operations in its regional neighborhood. Small and resource-poor outposts of industrial civilization, such as Singapore, would struggle to survive. The oil-exporting countries of Central Asia and the Middle East would benefit more than in the past from their abundant resource endowment. Due to the effects of skyrocketing oil prices on the world market, their economies would continue to grow in relative and absolute terms. Their domestic oil consumption would be stable or even increase at a time when it would be declining in the rest of the world.  The Middle East would almost certainly replace Western Europe as the most attractive destination for Muslim migrants.

The Struggle over Knowledge

There is a puzzle. Climate change and energy scarcity are both fundamental challenges to the viability of industrial civilization. How is it possible that, in the case of climate change, the alarmists have come to represent mainstream science, whereas in the energy case they have never made much headway? To understand this puzzle, I start off by developing an analytical framework that enables us to explore the struggle over knowledge about energy scarcity and climate change. I outline three kinds of science: normal, abnormal, and post-normal. I further show that, depending on whether normal or post-normal science reigns supreme, there are different patterns of contestation.

Despite a convincing case that the risk of energy scarcity is a post-normal problem (Tainter, Allen, and Hoekstra 2006), normal science continues to reign supreme in the field of energy studies. Mainstream economics is the science of choice when it comes to making forecasts, despite the fact that more technical disciplines such as geology and engineering are more directly concerned with fuel extraction and, by implication, future energy supply. Official expertise is concentrated in a couple of authoritative national and international institutions: the International Energy Agency (IEA) and its US counterpart, the Energy Information Administration (US-EIA).

Though not very successfully, normal energy expertise is challenged by a critical counterculture of abnormal energy science that is mostly made up of concerned citizens and a small number of retired geologists sounding the alarm at runaway fuel depletion. This abnormal energy science has its own institutional infrastructure, albeit relatively dispersed. At its center, there are loose epistemic networks like the Association for the Study of Peak Oil and Gas (ASPO) and its various national offshoots, as well as a number of Internet platforms such as The Oil Drum and Energy Bulletin (which moved to resilience.org in January 2013). Normal Energy Expertise Energy expertise is concentrated in a small number of organizations gathering and processing data (IEA, US-EIA, BP, & Shell).  By far the most authoritative entity is the International Energy Agency (IEA), which publishes the annual World Energy Outlook, as well as a biennial report called Energy Technology Perspectives.

The United States Department of Energy’s Energy Information Administration (US-EIA) is somewhat less authoritative because it represents a particular government. In recent years, US-EIA has been more optimistic about future energy supply than the IEA. Despite this bias, or perhaps precisely because of it, some observers prefer to quote US-EIA rather than the IEA.

Business firms have limited epistemic authority due to their vested interests. Nevertheless, industry-oriented circles sometimes rely on their publications. Interestingly, a feature common to all energy supply reviews is that data are not directly gathered but collected from sources such as the United States Geological Survey, the OPEC Secretariat, the Oil and Gas Journal, or the World Oil magazine.


The original purpose of the IEA when it was created in 1974 was to manage a crisis response in the event of a major oil supply disruption, defined as a shortfall of oil supply of 7% or more.  But since then this hasn’t happened.  Precisely because the IEA has been inactive as a fire fighter, its staff have had to be employed in some other useful way. For that purpose, the statutes of the IEA mention a few other goals in addition to the emergency response mechanism. The most important are monitoring the oil market and reducing the dependency on imported oil. Thus, the IEA was originally mandated to evolve in two complementary ways: first, to keep track of international markets and thus provide an early warning mechanism; and second, to work on ways to reduce the unsustainable oil dependency of industrial countries. While the second task might have suggested a shift to post-normal science, things did not turn out that way. The agency has eagerly embraced the first task of monitoring international markets, which was entirely in line with normal science. However, it never really confronted the task of questioning the oil dependency of industrial society.

Since the IEA’s core mission was the strategic governance of energy scarcity as a long-term risk, the agency should have become an expert watchdog monitoring the availability of oil and facilitating a large-scale transformation away from oil. But this didn’t happen fir a number of reasons.

First, the IEA was never really meant to question the presumption that oil is abundant. By placing its faith in markets, the agency followed the policy preferences of its member states.

Second, the decline of oil prices from the mid-1980s made the task of preparing industrial society for the eventuality of disruptive energy scarcities appear less urgent and allowed the IEA to focus on standard operating procedures like gathering data, developing forecasting tools, and publishing at the end of every calendar year the iconic World Energy Outlook.


Third, the IEA is attached to the OECD, whose culture has always been a firm belief in the ability of markets to safeguard economic development.

Fourth (and closely related), for a long time the IEA has been dominated by mainstream economists. As in the OECD, most staff members are economists and/or public servants, usually with a background in economics. There have always been a few lawyers, but engineers, geologists, and other energy experts have been a small minority until recently. The longstanding ascendancy of mainstream economists has been consequential. For most economists it is simply axiomatic that, in an effectively functioning market, supply will always meet demand. Accordingly, until 2008 the standard practice of the IEA has been to extrapolate trends in energy demand, and simply to assume that future demand will be met via the market mechanism.

In the 1998 World Energy Outlook, and then again in the 2008 WEO, the IEA looked more carefully into the physical availability of energy resources. In both cases it appears that in subsequent years there was backlash from member state principals and particularly the United States. Presumably as a result of such backlash, the IEA has become more optimistic again. The latest edition of the WEO (2012a) is strikingly upbeat compared to previous iterations, despite the fact that only few fundamentals have changed.

Abnormal Energy Science

The study of energy scarcity in general and peak oil in particular is a paradigm case of the abnormal science of radical dissidents. It is civic and intellectual alarmism gone wild in the face of a serious post-normal problem, and in the absence of a willingness on the part of normal science to reconsider its tenets, extend the peer community, and thus become post-normal.


Abnormal energy science is conventionally traced back to the founding father of peak oil theory, Marion King Hubbert. Like many other oil men, this leading geoscientist was a self-made man and a maverick. Unlike most of his colleagues working for the oil industry, however, he worried about physical limits to growth.

Ever since then, the most prominent proponents of peak oil theory typically have a background in geology, engineering, or some other physical science. However, their dissident standpoint forces them to turn their back on normal science and seek an audience among outsiders, notably concerned citizens.

During the 1980s the debate was largely dormant due to low oil prices, but it was reignited in the early 1990s through a book written by geologist Colin Campbell as he neared his retirement (Campbell 1991). A few years later, Campbell (1997) published another book about oil depletion that greatly benefitted from data provided by the company Petroconsultants. The following year, he partnered with retired petroleum engineer Jean Laherrère to publish an article in Scientific American (Campbell and Laherrère 1998), which is often cited as the beginning of the contemporary peak oil debate.  The notion of peak oil was further popularized in a book by retired oil geologist Kenneth Deffeyes (2001).

Forty years after Hubbert’s original analysis (1956), and despite the fact that the oil shocks of the 1970s were rapidly fading from memory with prices heading toward record lows, authors such as Campbell and Laherrère were trying, from their retirement, to awaken the world to what they saw as the defining challenge of the twenty-first century. Needless to say they were mostly ignored and sometimes opposed by their mainstream colleagues, with particularly fierce criticism and even ridicule coming from economists and industry figures unwilling to accept the idea of oil depletion (Adelman 1995, 2004; Odell 2004; Maugeri 2006, 2012; Clarke 2007).


Although public interest in oil depletion was initially limited to the “lunatic fringe,” physics professor Kjell Aleklett at the University of Uppsala in Sweden organized a conference in 2002 and used it to shepherd Campbell and the other members of the fractious peak oil community into ASPO, the Association for the Study of Peak Oil (Campbell 2011; Bentley 2011). Despite the lack of funding, this independent and loose collection of individuals, mostly retired geologists and academics from a broad range of fields, has since played an important role as an institutional platform, convening annual congresses on peak oil and coordinating various national chapters.

This became possible because, from about 2003, increasing oil prices and the surge of Web 2.0 brought an explosion of peak oil citizen science. The takeoff was further catalyzed by Richard Heinberg’s influential and popular book The Party’s Over (Heinberg 2003), as well as the peak of North Sea oil and gas and the outbreak of the Iraq War, which was often described as a war for oil.

The isolationist radicalism of the peak oil counterculture was particularly evident in the blogosphere, where sites such as Energy Bulletin (from 2003), peakoil.com (from 2004), and The Oil Drum (from 2005) took off rapidly and gained additional speed in 2005, when Hurricane Katrina shocked the United States, taking offline a significant portion of oil production and refining capacity.

As the founder of Energy Bulletin recalls: The issue of energy depletion had very little representation on the web . . . in 2003 when I began work on Energy Bulletin. The most prominent site about peak oil was Jay Hanson’s DieOff.com with its animations of grotesquely obese Americans overlaid with dead bodies and famine. . . . It was collapse porn. . . . Engaging with the issue felt like stepping into an alternative reality, and quite a lonely one! . . . I chose the rather generic name Energy Bulletin, and neutral color scheme to suggest a certain amount of “neutrality,” and perhaps to obscure the fact that myself and my colleagues were working on it in our spare time from our bedrooms and secretly from our workplaces, and had no formal qualifications in the areas of either journalism or energy.


At the more scholarly blog The Oil Drum, the association of the peak oil community with abnormal science is equally apparent. The site was founded by Kyle Saunders, professor in political science at Colorado State University, and David Summers, professor of mining engineering at the University of Missouri-Rolla. Both initially wrote under pseudonyms. Stories of academics losing tenure-track positions because of a blog were legendary in the blogosphere, which is why “Prof. Goose,” aka Kyle Saunders, would not risk revealing his name until getting tenure (McKenna 2007, 224).

All peak oilers share at least three views in common: that oil is a finite resource, that it is essential to industrial civilization, and that its production peak is fairly imminent.

Another remarkable common feature is that most on- and offline forums discussing peak oil are strongly male dominated. A 2009 readership survey carried out at The Oil Drum found that more than 90% of respondents were male. At the 2011 ASPO conference in Brussels, 82% were male (of 217 people). It is worth noting that the community activists in the Transition town movement is more equally women and men.

There are three main peak oil camps:

The first emphasizes the limits to growth and sees oil depletion as just one limitation alongside environmental sinks reaching their capacities, ecosystems being exploited, and the depletion of other finite resources. Rather than a problem in and of itself, peak oil is a symptom of a wider malady facing growth-based complex societies.  In this view, culture is sleepwalking toward the end of growth and peak oilers are rooting for cultural change.

The second sees peak oil as a liquid fuels problem, especially in the U.S. where it was promoted by the Hirsch Report commissioned by the Department of Energy.  Hirsch describes peak oil as an unprecedented risk management problem. As peaking is approached, liquid fuel prices and price volatility will increase dramatically and the economic social and political costs unprecedented. Mitigation must be attempted at least 10 to 20 years in advance of peaking. This viewpoint presents peak oil as a tremendous challenge, but if timely action is taken the problem need not be fundamental.


The third group is best described as “doomers” with many happily labeling themselves that way. In their view peak oil represents a desperate problem without any hope of significant mitigation, and it will inevitably lead to a partial of not total collapse of civilization as we know it.

Why bother to try to change the minds of those in denial?

Here is my personal response: the best thing a moral individual can do is to try to live “in the truth.” Life is tragic and often there are no solutions. Not every disease can be cured. Insofar as climate change and energy scarcity are part of the human predicament, even the most accurate diagnosis is unlikely to suggest a cure. Yet my mission as a scholar is to get to the bottom of things regardless of whether or not there is a solution. My task as a scholar is not to save the planet. It is plain old fashioned intellectual honesty.

My attitude will sound weary to those believing that problems like climate change and energy scarcity can and must be dealt with either through politics or local activism. It will sound outrageous to those setting their hope in a cornucopian can-do attitude and believing that aspirational statements and positive thinking can revolutionize what is politically feasible.


Posted in Collapse of Civilizations | Tagged , , , , | 2 Comments

60 minutes promotes biomass scam

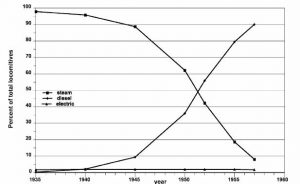
Preface. Hey 60 minutes, do some fact checking first.

Alice Friedemann   www.energyskeptic.com  author of “When Trucks Stop Running: Energy and the Future of Transportation”, 2015, Springer and “Crunch! Whole Grain Artisan Chips and Crackers”. Podcasts: Practical Prepping, KunstlerCast 253, KunstlerCast278, Peak Prosperity , XX2 report

***

On January 6, 2019, 60 Minutes had a segment on an amazing biofuels breakthrough invention by Marshall Medoff, an “81-year old eccentric with no science degree” (watch the video or read the transcript here).

His stunning innovation has won over many famous board members, such as Steven Chu, the former Secretary of Energy, as well as Shell Oil executive Sir John Jennings, George Shultz, former secretary of state and former defense secretary, William Perry.

Medoff’s company, Xyleco, has also garnered hundreds of millions of dollars from investors impressed with his inventive use of accelerators. Sixty minutes describes this as his “novel idea of using these large blue machines called electron accelerators to break apart nature’s chokehold on the valuable sugars inside plant life – or biomass”.

But wait!  There are thousands of research papers going back as far as Imamura (1972) about using electron accelerators to break down lignocellulosic biomass. This is done to create more surface area for the next step, in Xyleco’s case, enzymes to break down the cellulose further.  Other ways biomass can be shattered are milling, chipping, shredding, grinding, and pyrolysis.

But all of these are highly energy intensive methods.  In fact, one paper thought that electronic beams were probably economically infeasible (Saini 2015).

This plant is also likely to fail because all other commercial level cellulosic ethanol plants have gone out of business. Only one plant still exists, POET’s $275 million Emmetsburg, Iowa facility, with a capacity of 25 million gallons per year.  I can’t find out how much was actually produced there, but even if all 25 million gallons were made, that is a far cry from the 8.5 billion gallon cellulosic ethanol mandate of 2007, which will be reduced to 418 million gallons in 2019 because cellulosic ethanol is clearly not commercial yet (Rapier 2018).

Dr. Steven Chu told 60 minutes “that biofuels could make a 30% dent in the petroleum market, according to a report by the Department of Energy”.  Well, I’ve read that report and it is hogwash.  It treats crop residues and other biomass as “waste”, when in fact, if this so-called “waste” isn’t returned to the soil to prevent erosion, add nutrition, create ways for water and air to reach plant roots, and provide a natural immune system, then next year’s crop production will decline.

Another huge problem with “waste” biomass is that it needs to be within 40 miles of a biofuels plant, or the amount of diesel energy to harvest, compact into a bale, and transport the biomass to the refinery is more energy than you’ll ever get out of the ethanol after it’s created.

One reason cellulosic ethanol isn’t commercial is that to break the cellulose down further after physically blasting it apart, enzymes are needed to break it down even further. But enzymes take too much money and energy to make now. Yet that’s the next step at Xyleco where the electron accelerator it will be “combined with a proprietary enzyme mix”.  And another hurdle is that by blasting apart biomass, by products are created that enzymes can’t cope with very well.

Robert Rapier (2019) wrote that “they were pretty nonchalant about the kinds of fuels that were being produced, as if it’s equally easy to make ethanol, gasoline, or jet fuel. The former is pretty easy to make. The other two — no way can he do this cost effectively via this route. Finally, biodegradable plastics have been around for a long time. Again, Lesley is leaving the implication that he has invented something new.”

Xyleco also proposes to turn biomass into materials, chemicals, and the sugar “xylose which could reduce obesity and diabetes, since it is consumable, and low in calories, and doesn’t decay your teeth”.   Well, again, xylose has been around a long time, this is not a new discovery.

Xyleco isn’t yet in business, so it remains to be seen if the founder’s name ought to be Madoff rather than Medeff.

REFERENCES

Imamura, R., et al. 1972. Depolymerization of cellulose by electron beam irradiation. Bulletin of the Institute for Chemical research, Kyoto university 50: 51-63.

Rapier, R. 2018. Cellulosic ethanol falling far short of the hype. Forbes.

Rapier, R. 2019. Private communication.

Saini, A., et al. 2015. Prospects for irradiation in cellulosic ethanol production. Biotechnology research international.


Posted in Biomass, Far Out | Tagged , , | 1 Comment