Preface. In 2018 I thought it was time to reorganize this post, as it grew more and more bloated and disorganized with new information. Eventually it turned into my 2021 book Life After Fossil Fuels: A Reality Check on Alternative Energy, with even more information, but this post is free, and has some good sections that didn’t make it into my book.
I first published this online in 2007 as Peak Soil, Shorter versions appear in the following books: Jacqueline Langwith, ed. 2008. “Opposing Viewpoints: Renewable Energy, vol. 2.” Greenhaven Press; Sheila Newman, ed. 2008. “The Final Energy Crisis”. Pluto Press.
Alice Friedemann www.energyskeptic.com Women in ecology author of 2021 Life After Fossil Fuels: A Reality Check on Alternative Energy best price here; 2015 When Trucks Stop Running: Energy and the Future of Transportation”, Barriers to Making Algal Biofuels, & “Crunch! Whole Grain Artisan Chips and Crackers”. Podcasts: Crazy Town, Collapse Chronicles, Derrick Jensen, Practical Prepping, KunstlerCast 253, KunstlerCast278, Peak Prosperity
***
“The nation that destroys its soil destroys itself”, President Franklin D. Roosevelt
There’s growing public attention from the people about biomass potential for energy. There’s been a public discussion about many aspects and what the problems might be. But there’s one aspect of all of this that is conspicuous by its absence – a national discussion about the soil science – the effect growing row crops like corn and soy have on land and water. There are also important issues about whether there is enough biomass to scale up to replace oil, the net energy gain and the carbon balance. But the root of the matter is whether growing biomass for fuel can be made sustainable.
The lack of any kind of input on this by soil scientists about how we’re mining our soils is a voice that needs to be heard, because if you destroy the soil, you can’t grow biomass.
Part 1. Scale: There’s not enough biomass to fuel transportation
The amount of fossil fuels burned in 1997 is 400 times all the plant matter that grows in the world in a year, even including the microscopic plants in the ocean (Dukes 2003).
Since fossil fuels are finite, it certainly makes sense to turn to biomass to provide fuel to replace oil. After all, besides water, air, and dirt, plants are the most abundant and renewable resource that could possible scale up to replace fossil fuels.
But is there enough biomass? Don’t forget that oil, natural gas, and coal are used for many other purposes:
- Fossils are the source of over 500,000 products (fertilizer, plastics, petrochemical industry)
- Fossils provide baseload power for electricity generation and balance intermittent wind and solar power
- Fossils provide the high-temperature heat needed to make cement, steel, ceramics, and glass
- The heat for homes and businesses
In addition, a great deal of biomass is already spoken for – it is used for food, grazing, and fertilizer as so-called “crop waste” is increasingly tilled-in by farmers.
The Department of Energy lists ways biomass is already being used that will compete with its use as a fuel and for electricity generation (Ruth 2013 Table 3.3):
- Residential (including wood pellets for heat)
- Commercial (uses agriculture byproducts/crops, sludge waste, and other biomass solids, liquids and gases; black liquor and wood/wood waste solids including wood pellets for heat and liquids; and corn)
- Industrial, including:
- Agriculture, forestry, and mining (consumes agricultural byproducts/crops)
- Chemicals and allied products (consumes other biomass liquids, sludge waste, and wood/wood waste solids)
- Apparel (consumes wood and derived fuels)
- Petroleum refining (consumes wood and derived fuels)
- Rubber and miscellaneous plastic products (consumes wood and derived fuels)
- Transportation equipment (consumes wood and derived fuels)
- Stone, clay, glass, and concrete products (consumes wood and derived fuels)
- Furniture and fixtures (consumes wood and derived fuels)
Few studies look at how biomass would optimally be shared among all these competing uses. California found that due to limited irrigation water, at best biomass could provide 18% of transportation fuel, but recommended that a quarter of the biomass be allocated to utilities to generate electricity (Youngs and Somerville 2013).
Since trucks and rail are the basis of civilization as we know it, all, most of this biomass ought to be converted to #2 diesel to keep trucks and locomotives running. Instead, 40% of the corn crop is wasted on ethanol for non-essential cars. Diesel engines can’t burn ethanol or diesohol. Currently biodiesel is just 1 percent of total diesel production by volume, with soybeans making up 57 percent of that feedstock.
Oil is a biofuel, but nonrenewable since it took Mother Nature millions of years to brew with 196,000 pounds of plants per gallon, which is equivalent to cramming 40 acres of wheat into your gas tank every 20 miles (Dukes).
And therein lies the rub. It takes enormous amounts of biomass to make liquid fuels. Biomass doesn’t scale up enough to replace even a small fraction of what we use. Only 1% of total U.S. energy is provided by 40% of the corn crop (NAS 2014).
Europe’s International Energy Agency has a target of 150 EJ/year from biomass. To do that would require 15 billion metric tons of plant biomass taking up 200 billion cubic meters (bcm). But only 2 billion metric tons of rice, wheat, soybeans, corn, and other grains and oil seeds with a volume of 2.75 bcm were produced in 2010, and only 6.2 bcm of coal and 5.7 bcm of oil were moved in 2008, orders of magnitude less than 200 bcm (Richard).
If you yanked every plant in America out of the ground, roots and all, and burned them to create energy, far more energy than converting plants to biofuels, you’d get 94 exajoules (EJ), less than the 105 EJ of fossil fuels Americans use per year (Patzek 2005), and we could all pretend we lived on Mars.
David Pimentel doubts that cellulosic biomass will ever be able to provide enough liquid fuel because “Green plants collect and convert less than 0.1% of the incident sunlight into plant matter [Pimentel and Patzek 2008, Pimentel et al 2006, Pimentel et al 2012]. In the United States all green plants collectively produce biomass equivalent to about 53 exajoules of energy per year from sunlight, only about half of our total fossil energy use. Hence even if we were able to use all agricultural, forest , grassland and aquatic plants, with no production of food or fiber, at an impossible 100% efficiency this would be barely enough energy to displace oil (Hall 2011).
To make B5 diesel fuel (5% biodiesel) would require 64% of the soybean crop and 71,875 square miles of land (Borgman 2007), so 20 times as many soybeans are needed to make B100 taking almost half of the land in the contiguous 48 states. The best, most productive land east of the Mississippi that can grow soybeans with rainfall.
Giampietro (2009) calculates that we’d need 558 billion liters of ethanol, which would require 1500 million tonnes of corn, which is six times the entire production of corn in the U.S. in 2003. This would generate 500 million tonnes of Dried Distillers Grain (DDG) byproduct, 10 times more than the entire consumption of high protein commercial feeds — 51 million tonnes in 2003. Pro-ethanol scientists add DDG as a positive net energy gain, when in fact it will take a huge amount of energy to dispose of most of this environmental pollution, only a small percent of which can be eaten by lifestock, and only carried so far or the diesel fuel used to transport it is larger than the energy contained in the DDG..
Over the past 2,000 years we’ve reduced the living biomass on the planet by 45% — from about 1,000 billion tons (35 zeta joules (ZJ) = joules × 1021) to 550 billion tons (19.2 ZJ), with 11% of that consumed just since 1900, and we’re continuing to burn it up at a rate of 1.5 billion tons per year (Smil, Houghton). And this at a time when biomass isn’t our major energy source, as it was in all previous civilizations.
I ought to stop right here; obviously turning biomass into fuel is an unworkable idea, but many readers will imagine that even a little biofuel will help, even if we can’t produce enough to live at the God-like level we do now. Just one of many silver bullets.
But even a little won’t help, because making biofuels is a loss of net energy, using more fossil fuel than the energy contained in the biofuel, as I explain in Part 3. Even those who have found a positive Energy Return on Invested (EROI) have come up with an average EROI of 1.2, and it takes an EROI of at least 7 (Weissbach et al. (2013), 11 (Murphy 2011), or 14 (Lambert et al. 2014) to maintain civilization as we know it.
But people argue endlessly about EROI because of the boundaries (do you include the energy to make the tractor that planted the corn or not?), so I don’t spend as much time on this as I could.
What really upsets me beyond scaling up and EROI is the enormous ecological damage, which I cover in Parts 2 and 4.
Part 2. The Dirt on Dirt.
Ethanol is an agribusiness get-rich-quick scheme that will bankrupt our topsoil.
It’s already happening: Landowners around the world are now engaged in such an orgy of soil destruction that, according to the UN’s Food and Agriculture Organization, the world on average has just 60 more years of growing crops (Monbiot 2015).
Nineteenth century western farmers converted their corn into whiskey to make a profit (Rorabaugh 1979). The energy to haul moonshine is a tiny fraction of the energy to haul corn to distant cities after all, more of a positive EROI if you will.
Archer Daniels Midland (ADM), a large grain processor, came up with a similar scheme in the 20th century; ethanol. But ethanol was a product in search of a market, so ADM spent three decades relentlessly lobbying for ethanol to be used in gasoline. Today ADM makes record profits from ethanol sales and government subsidies (Barrionuevo 2006).
The Department of Energy hopes to have biomass supply 5% of the nation’s power, 20% of transportation fuels, and 25% of chemicals by 2030. These combined goals are 30% of the current petroleum consumption (DOE Biomass Plan, DOE Feedstock Roadmap).
Fuels made from biomass are a lot like the nuclear powered airplanes the Air Force tried to build from 1946 to 1961, for billions of dollars. They never got off the ground. The idea was interesting – atomic jets could fly for months without refueling. But the lead shielding to protect the crew and several months of food and water was too heavy for the plane to take off. The weight problem, the ease of shooting this behemoth down, and the consequences of a crash landing were so obvious, it’s amazing the project was ever funded, let alone kept going for 15 years.
Biomass fuels have equally obvious and predictable reasons for failure. Odum says that time explains why renewable energy provides such low energy yields compared to non-renewable fossil fuels. The more work left to nature, the higher the energy yield, but the longer the time required. Although coal and oil took millions of years to form into dense, concentrated solar power, all we had to do was extract and transport them (Odum 1996)
With every step required to transform a fuel into energy, there is less and less energy yield. For example, to make ethanol from corn grain, which is how all ethanol is made now, corn is first grown to develop hybrid seeds, which next season are planted, harvested, delivered, stored, and preprocessed to remove dirt. Dry-mill ethanol is milled, liquefied, heated, saccharified, fermented, evaporated, centrifuged, distilled, scrubbed, dried, stored, and transported to customers (McAloon 2000).
Fertile soil will be destroyed if crops and other “wastes” are removed to make cellulosic ethanol.
“We stand, in most places on earth, only six inches from desolation, for that is the thickness of the topsoil layer upon which the entire life of the planet depends” (Sampson 1981).
Farming always ruins soils eventually; civilizations fail after about 1500 years because of this
Productivity drops off sharply when topsoil reaches 6 inches or less. Historically, it takes most civilizations 1500 years to exhaust their soils. Then they collapse (Montgomery 2007).
Loss of topsoil has been a major factor in the fall of civilizations (Sundquist 2005 Chapter 3, Lowdermilk 1953, Perlin 1991, Ponting 1993). You end up with a country like Iraq, formerly Mesopotamia, where 75% of the arable farm land is now a salty desert.
Industrial farming methods are likely to crash our civilization in 150 years or less. Not only do these methods remove trees for miles, allowing topsoil to blow and wash away, they are very heavy and can permanently compact the soil. This is one of the reasons they can’t be powered by batteries, which would have to weigh nearly as much as the tractor to move it an inch.
Peak Phosphate will also cause civilization to collapse
Industrial farming is also limited by phosphate, which scientists estimate will last from 40 to 400 more years. Most of the phosphate left is in Morocco, 75%, hardly the most stable region in the world. There are other considerations than geological depletion that can affect how long phosphate lasts (Walan 2014).
Phosphate is mined from phosphate rock. Because the world’s grasslands are losing phosphorus through various processes, it’s estimated that phosphate application on grassland will have to quadruple between 2005 and 2050, to increase production by the 80% expected to be necessary over that time period.
In total, it’s thought that phosphorus production will have to more than double by 2050 compared to 2005, just to keep up with demand. It’s not clear how much further phosphate rock production can grow. Some estimates are that phosphate rock production will peak by 2027, even as depletion of our soils will merely get worse.
Why can’t we produce more biomass?
The real challenge with bioenergy, according to Timothy Searchinger, a research scholar at Princeton University, is that photosynthesis is extremely inefficient. “If you’re really lucky you get half a percent of the solar energy transformed into plant biomass.”
But we don’t even get half of a percent. Calculating efficiency in terms of how much energy is available from the biofuel versus how much energy was in the sunlight hitting the plants used to produce the biofuel, the efficiency of ethanol made from corn is only about 0.03 percent.
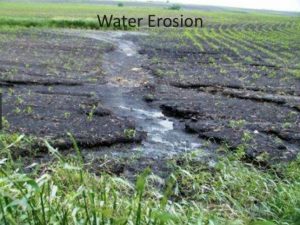
More about soil erosion
Long before there was “Peak Oil”, there was “Peak Soil”. Iowa has some of the best topsoil in the world. In the past century, half of it’s been lost, from an average of 18 to 10 inches deep (Pate 2004, Klee 1991), or even more according to Needelman (2013) — in the 20th century, farming has caused soil to go from 14 to 18 inches down to 6 to 8 inches.
20 to 40 pounds of soil are eroded for every gallon of ethanol produced (Institute of Medicine 2014).
Productivity drops off sharply when topsoil reaches 6 inches or less, the average crop root zone depth (Sundquist 2005).
Crop productivity continually declines as topsoil is lost and residues are removed. (Al-Kaisi May 2001, Ball 2005, Blanco-Canqui 2006, BOA 1986, Calviño 2003, Franzleubbers 2006, Grandy 2006, Johnson 2004, Johnson 2005, Miranowski 1984, Power 1998, Sadras 2001, Troeh 2005, Wilhelm 2004).
On over half of America’s best crop land, the erosion rate is 27 times the natural rate, 11,000 pounds per acre (NCRS 2006). The natural, geological erosion rate is about 400 pounds of soil per acre per year (Troeh 2005). Some is due to farmers not being paid enough to conserve their land, but most is due to investors who farm for profit. Erosion control cuts into profits.
Globally, Professor John Crawford of the University of Sydney estimates that soil is being lost 10 to 40 times faster than it’s being geologically replenished, leaving around 60 years of topsoil left to be mined for food. Already 40% of agricultural soil is classed as degraded or seriously degraded — 70% of the topsoil gone (WEC).
Farming methods have increased soil erosion to rates much greater than soil is formed — it can take up to 1,000 years to form 1 centimeter (0.4 inch) of soil (Wall and Six 2015). Wall and Six go on to say that “Human activities have transformed soils,lands, and regions with long-lasting effects that include desertification, decreased organic matter in soils, altered biodiversity, and changed biogeochemical and hydrological cycles. As a result, the land available for food production is shrinking, irreversibly in some cases. Converting cropland to biofuel systems and urban centers is having the same effect.”
Iowa State scientists tracking soil erosion after storms believe that the true erosion rate is many times higher than estimates from the Department of Agriculture’s National Resource Conservation Department (EWG)
Erosion is happening 10 to 20 times faster than the rate topsoil can be formed by natural processes (Pimentel 2006). That might make the average person concerned. But not the USDA — they’ve defined erosion as the average soil loss that could occur without causing a decline in long term productivity.
Troeh (2005) believes that the tolerable soil loss (T) value is set too high, because it’s based only on the upper layers — how long it takes subsoil to be converted into topsoil. T ought to be based on deeper layers – the time for subsoil to develop from parent material or parent material from rock. If he’s right, erosion is even worse than NCRS figures.
We’ve come a long way since the 1930’s in reducing erosion, but that only makes it more insidious. Erosion is very hard to measure — very little soil might erode for years, and then tons per acre blown or washed away in an extreme storm just after harvest, before a cover crop has had a chance to protect the soil. We need better ways of measuring and monitoring erosion, since estimates wildly differ (Trimble 2000).
Well, all right, I’ve hammered you over the head with erosion enough already, let’s move on to my favorite part of soil: the living creatures within it.
Soil Science 101 – There Is No “Waste” Biomass
Erosion removes the most fertile parts of the soil (USDA-ARS) by removing the trillions of creatures who once lived there.
When you feed the soil with organic matter, you’re not feeding plants; you’re feeding the biota in the soil. Underground creatures and fungi break down fallen leaves and twigs into microscopic bits that plants can eat, and create tunnels air and water can infiltrate. In nature, there are no elves feeding (fertilizing) the wild lands. When plants die, they’re recycled into basic elements and become a part of new plants. It’s a closed cycle. There is no bio-waste.
Soil creatures and fungi act as an immune system for plants against diseases, weeds, and insects – when this living community is harmed by agricultural chemicals and fertilizers, even more chemicals are needed in an increasing vicious cycle (Wolfe 2001).

There’s so much life in the soil, there can be 10 “biomass horses” underground for every horse grazing on an acre of pasture (Hemenway 2000). The June 2004 issue of Science calls soils “The Final Frontier”. Just a tiny pinch of earth could have 10,000 different species (Wardle 2004) — millions of creatures, most of them unknown. If you dove into the soil and swam around, you’d be surrounded by thousands of miles of thin strands of mycorrhizal fungi that help plant roots absorb more nutrients and water (Pennisi 2004). As you swam along, plant roots would tower above you like trees as you wove through underground skyscrapers.
Plants and creatures underground need to drink, eat, and breathe just like we do. An ideal soil is half rock, and a quarter each water and air. When tractors plant and harvest, they crush the life out of the soil, as underground apartments collapse 9/11 style. The tracks left by tractors in the soil are the erosion route for half of the soil that washes or blows away (Wilhelm 2004).
Corn and soy are especially harmful because they need a lot of water, fertilizer, agrichemicals, resulting in eutrophication. They are also among the crops most vulnerable to soil erosion.
- Row crops like corn and soy cause 50 times more soil erosion than sod crops (Sullivan 2004) or more (Al-Kaisi 2000), because the soil between rows can wash or blow away. If corn is planted with last years corn stalks left on the ground (no-till), erosion is less of a problem, but only about 20% of corn is grown no-till. Soy is usually grown no-till, but has insignificant residues to harvest for fuel.
- Corn uses more water than most crops. It takes about 118 gallons of water to produce 1 pound of corn, and 21 pounds of corn to make a gallon of ethanol. So you’d need about 2.5 trillion gallons of water to make a billion gallons of ethanol, more than all the water southern California receives from the Sacramento-San Joaquin Delta (Sacramento Bee 2007).
- In the life cycle of making corn ethanol, 99% of the water used grows the corn, only 1% is used in the industrial process. From seed to fuel, this requires 1,500 gallons of water per gallon of ethanol. In the industrial phase, cellulosic ethanol requires twice as much water. California and other states that grow crops with irrigation rather than rain water would require displacing food crops with energy crops, and there already isn’t enough water for food, people, and fisheries (Fingerman 2008).
- Corn uses more agrichemicals, and fertilizer than most crops (Padgitt 2000, Pimentel 2003). Due to high corn prices, continuous corn (corn crop after corn crop) is increasing, rather than rotation of nitrogen fixing (fertilizer) and erosion control sod crops with corn.
- Corn plants are amazingly good at absorbing nitrogen from the soil and storing it in the grain itself. Thus, it takes a lot of fertilizer to replace that nitrogen, but if it rains after the application of fertilizer, down the Mississippi it goes. A large part of the problem with runoff of nitrogen (and soil) is because corn is known as a “leaky crop” because nutrients inevitably leak out because the land is bare half of each year (Institute of Medicine 2014).
- The government has studied the effect of growing continuous corn, and found it increases eutrophication by 189%, global warming by 71%, and acidification by 6% (Powers 2005). Production of ethanol results in 8 grams of nutrients for every gallon of ethanol that ends up in the Gulf of Mexico (Institute of Medicine 2014).
- Farmers want to plant corn on highly-erodible, water protecting, or wildlife sustaining Conservation Reserve Program land. Farmers are paid not to grow crops on this land. But with high corn prices, farmers are now asking the Agricultural Department to release them from these contracts so they can plant corn on these low-producing, environmentally sensitive lands (Tomson 2007).
- Crop residues are essential for soil protection, nutrition, water retention, and soil carbon. Making cellulosic ethanol from corn residues — the parts of the plant we don’t eat (stalk, roots, and leaves) – removes water, carbon, and nutrients (Nelson, 2002, McAloon 2000, Sheehan, 2003).
In summary, Tegtmeier (2004) writes that these practices lead to lower crop production and ultimately deserts. Growing plants for fuel will accelerate the already unacceptable levels of topsoil erosion, soil carbon and nutrient depletion, soil compaction, water retention, water depletion, water pollution, air pollution, eutrophication, destruction of fisheries, siltation of dams and waterways, salination, loss of biodiversity, and damage to human health.
Why are soil scientists absent from the biofuels debate?
I asked 35 soil scientists why topsoil wasn’t part of the biofuels debate. These are just a few of the responses from the ten who replied to my off-the-record poll (no one wanted me to quote them, mostly due to fear of losing their jobs):
- ”I have no idea why soil scientists aren’t questioning corn and cellulosic ethanol plans. Quite frankly I’m not sure that our society has had any sort of reasonable debate about this with all the facts laid out. When you see that even if all of the corn was converted to ethanol and that would not provide more than 20% of our current liquid fuel use, it certainly makes me wonder, even before considering the conversion efficiency, soil loss, water contamination, food price problems, etc.”
- Biomass production is not sustainable. Only business men and women in the refinery business believe it is.
- “Should we be using our best crop land to grow gasohol and contribute further to global warming? What will our children grow their food on?”
- “As agricultural scientists, we are programmed to make farmer’s profitable, and therefore profits are at the top of the list, and not soil, family, or environmental sustainability”.
- “Government policy since WWII has been to encourage overproduction to keep food prices down (people with full bellies don’t revolt or object too much). It’s hard to make a living farming commodities when the selling price is always at or below the break even point. Farmers have had to get bigger and bigger to make ends meet since the margins keep getting thinner and thinner. We have sacrificed our family farms in the name of cheap food. When farmers stand to make few bucks (as with biofuels) agricultural scientists tend to look the other way”.
- You are quite correct in your concern that soil science should be factored into decisions about biofuel production. Unfortunately, we soil scientists have missed the boat on the importance of soil management to the sustainability of biomass production, and the long-term impact for soil productivity.
This is not a new debate. Here’s what scientists had to say in the past
Removing “crop residues…would rob organic matter that is vital to the maintenance of soil fertility and tilth, leading to disastrous soil erosion levels. Not considered is the importance of plant residues as a primary source of energy for soil microbial activity. The most prudent course, clearly, is to continue to recycle most crop residues back into the soil, where they are vital in keeping organic matter levels high enough to make the soil more open to air and water, more resistant to soil erosion, and more productive” (Sampson 1981).
“…Massive alcohol production from our farms is an immoral use of our soils since it rapidly promotes their wasting away. We must save these soils for an oil-less future” (Jackson 1980).
Gasohol was made so poorly in the 80’s that the name was changed to ethanol.
What the USDA knew about continuous corn in 1911:
“When the rich, black, prairie corn lands of the Central West were first broken up, it was believed that these were … inexhaustible lands … So crop after crop of corn was planted on the same fields. There came a time, however, after 15 or 20 years, when the crop did not respond to cultivation; the yields fell off and the lands that once produced 60-70 bushels per acre annually dropped to 25 to 30 bushels.
… With the passing years, the soil became more compact, droughts were more injurious, and the soil baked harder and was more difficult to handle. Continuous corn culture has no place in progressive farming…it is a shortsighted policy and is suicidal on lands that have been long under cultivation” (Smith 1911).
We’ve known for a long that biofuels can’t replace fossil fuels, because past civilizations with just millions, not billions of people fell when they cut their forests down to make warships, metals, bricks, ceramics, and other products, they fell (Perlin 2005).
Civilizations in the past could not expand their carrying capacity with just their own agricultural production. Growth depended on conquering other nations and enslaving their people, taking their surplus food, forests, gold, and other wealth. With these new resources, the army could be expanded and more nations conquered. When an empire could expand no more, it collapsed. This comes about partly because the government ignores the rural communities they depend on, and they resent not being part of the resource redistribution of conquered nations and the over-taxation and confiscation of food by the central authorities, leaving them perpetually on the verge of starvation. So when the barbarians invaded the Roman Empire, many rural areas welcomed them, and joined them in battles, yet another reason (Tainter 1988).
Sam Brody (1945) wrote: “It is said that we should use alcohol and vegetable oils after the petroleum energy has been exhausted. This reminds one of Marie Antoinette’s advice to the Paris poor to eat cake when they had no bread”.
What Admiral Hyman G. Rickover knew in 1957 (Energy Resources & Our Future):
Farm wastes may be more urgently needed to fertilize the soil than to fuel machines. Wood fuel and farm wastes are dubious as substitutes because of growing food requirements to be anticipated. Land is more likely to be used for food production than for tree crops.
Deforestation not only lessens the energy base but has a further disastrous effect: lacking plant cover, soil washes away, and with soil erosion the nutritional base is reduced as well.
Another cause of declining civilization comes with pressure of population on available land. A point is reached where the land can no longer support both the people and their domestic animals.
There is absolute consensus among energy analysts that fossil fuels made modern civilization possible
According to Giampietro (2008): “In the community of energy analysts, there is absolute consensus that the major discontinuity in all major trends of human development — population, energy consumption per capita, technological progress associated with the Industrial Revolution was generated by the extremely high quality of fossil energy as a primary energy source, compared with biomass. The tremendousadvantage of fossil energy over alternative energy sources is easy to explain: when considering the energetic costs of the production of producing oil it’s almost nothing, the oil is already there” (unlike biofuels, which need to be produced). Fossil fuels are a primary energy source, from which secondary energy gasoline and other products are produced. Biofuels are not a primary source of energy, they need to be produced. Therefore, the only energy carrier that could replace fossil fuels is a primary energy source of similar performance in terms of useful work per unit of primary energy consumed. Anything less than that will cause a significant downturn.
Natural Gas in Agriculture
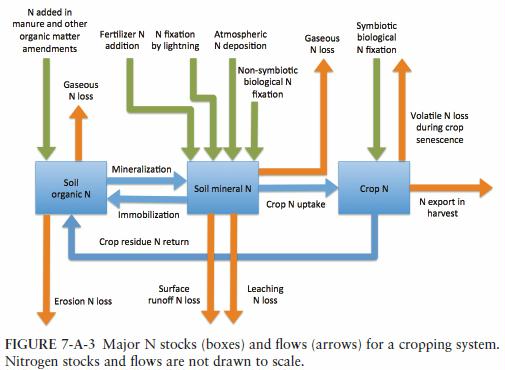
“Fertilizer energy” is 28% of the energy used in agriculture (Heller, 2000). Fertilizer uses natural gas both as a feedstock and the source of energy to create the high temperatures and pressures necessary to coax inert nitrogen out of the air (nitrogen is often the limiting factor in crop production).
Fertilizers only replace nutrition. They don’t provide the ecosystem services that organic matter does. Organic matter is known as “waste” in the biofuels industry.
Organic matter slows erosion and fixes carbon in the soil. Dead plants and the soil biota that feed on them create channels that let air and water get to plant roots, which breathe and drink just like we do. The soil retains water, helping plants get through droughts.
Organic matter provides food for the soil biota, which provide an immune system for plants. The mycorrhizal fungi in the soil provide plants extra nutrients and water in exchange for sugars.
Fertilizer not only provides no ecosystem services, it harms the ecosystem. Fertilizer disables or kills some of the creatures in the soil web, which increases the need for agrichemicals in an increasingly vicious cycle.
Fertilizers increase global warming, acid rain, and eutrophication.
You can grow tomatoes on rocks if you dump enough fertilizer on them. But doing so depletes the soil, we mine it when we do this.
Fertilizer represents 28% of the energy used in agriculture. So let me get this straight. Fertilizers are made from and with natural gas which we’re dumping on crops to grow them for biofuel. We’re going to take the biomass waste away, which means we’ll have to add even more fertilizer. How, exactly, does that lessen our dependence on fossil fuels?
OK, one good thing, sort of. Fertilizer is part of the green revolution that made it possible for the world’s population to grow from 1 billion to 7.1 billion people (Smil 2000, Fisher 2001). Up to 6 billion are alive who otherwise wouldn’t be. But natural gas is a finite resource on a finite planet, and is not easily imported, and despite all the hype about fracking in the United States, natural gas production is likely to peak 2015 to 2018 (Powers 2013). Discontinuities clearly lie ahead.
Our national security is at risk as we deplete our aquifers and become dependent on unstable foreign states to provide us with increasingly expensive fertilizer. Between 1995 and 2005 we increased our fertilizer imports by more than 148% for Anhydrous Ammonia, 93% for Urea (solid), and 349 % of other nitrogen fertilizers (USDA ERS). Removing crop residues will require large amounts of imported fertilizer from potential cartels, potentially so expensive farmers won’t sell crops and residues for biofuels.
Improve national security and topsoil by returning residues to the land as fertilizer. We are vulnerable to high-priced fertilizer imports or “food for oil”, which would greatly increase the cost of food for Americans. Return crop residues to the soil to provide organic fertilizer, don’t increase the need for natural gas fertilizers by removing crop residues to make cellulosic biofuels.
Part 3. The Poop on Ethanol:
Energy Returned on Energy Invested (EROEI)
To understand the concept of EROEI, imagine a magician doing a variation on the rabbit-out-of-a-hat trick. He strides onstage with a rabbit, puts it into a top hat, and then spends the next five minutes pulling 100 more rabbits out. That is a pretty good return on investment!
Oil was like that in the beginning: one barrel of oil energy was required to get 100 more out, an Energy Returned on Energy Invested of 100:1.
When the biofuel magician tries to do the same trick decades later, he puts the rabbit into the hat, and pulls out only one pooping rabbit. The excrement is known as byproduct or coproduct in the ethanol industry.
Studies that show a positive energy gain for ethanol would have a negative return if the byproduct were left out (Farrell 2006). Here’s where byproduct comes from: if you made ethanol from corn in your back yard, you’d dump a bushel of corn, two gallons of water, and yeast into your contraption. Out would come 18 pounds of ethanol, 18 pounds of CO2, and 18 pounds of byproduct – the leftover corn solids.
Patzek and Pimentel believe you shouldn’t include the energy contained in the byproduct, because you need to return it to the soil to improve nutrition and soil structure (Patzek June 2006). Giampetro believes the byproduct should be treated as a “serious waste disposal problem and … an energy cost”, because if we supplied 10% of our energy from biomass, we’d generate 37 times more livestock feed than is used (Giampetro 1997), “making it a serious environmental problem, a pollutant on the sink side, to which energy analysts need to associate an energetic and economic cost rather than a positive return.
Giampetro (2009) also says that if corn co-products are going to be included, and the huge land demand and ecological destruction ignored, then the far more energetically valuable co-products of gasoline production and their very small land footprint need to be thrown into the balance, instead of just their CO2 emissions. Scientists with a secret agenda of boosting the EROI of biofuels skew their results by “ignoring the co-products of gasoline production from oil, reducing the overall output/input ratio of gasoline).”
It’s even worse than he realized – Giampetro didn’t know most of this “livestock feed” can’t be fed to livestock because it’s too energy and monetarily expensive to deliver – especially heavy wet distillers byproduct, which is short-lived, succumbing to mold and fungi after 4 to 10 days. Also, byproduct is a subset of what animals eat. Cattle are fed byproduct in 20% of their diet at most. Iowa’s a big hog state, but commercial swine operations feed pigs a maximum of 5 to 10% byproduct (Trenkle 2006; Shurson 2003).
And if the EROEI of biofuels are indeed positive, as some scientists claim, especially those funded by the National Corn Growers Association, why isn’t ethanol used to fuel the tractors that plant and harvest, the trucks that carry biomass to the biorefinery, and final delivery of biofuels to the customer?
Because corn and soy crops have higher erosion rates than most crops, their eroded sediment fills up reservoirs, shortening their life-span and the time dams can store water and generate electricity. Yet the energy of the hydropower lost to siltation, to build a new dam sooner than its lifespan, the energy to remediate flood damage, the energy to dredge dams, agricultural drainage ditches, harbors, and navigation channels, aren’t considered in EROEI calculations. Or the energy needed to clean up the agrichemicals that get into soil and water.
Farm runoff of nitrogen fertilizers has contributed to the pollution and hypoxia (low oxygen) of rivers and lakes across the country and the 8,000 square mile dead zone in the Gulf of Mexico. Yet the cost of the lost shrimp and fisheries and increased cost of water treatment are not subtracted from the EROEI of ethanol.
Worst of all, the EROEI of ethanol is 1.2:1 or 1.2 units of energy out for every unit of energy in, a gain of “.2” at best, many scientists have found ethanol to have a negative EROI – more fossil fuel energy used than the energy contained in the biofuel.
By the way, the “1” in “1.2” represents the liquid ethanol. What is the “.2” then? It’s the byproduct, like the rabbit feces after a rabbit dines (though that has more energy than corn byproduct. Rabbits are copraphagous – they eat their feces to get any energy they left in it after digestion).
So you have no ethanol at all for your car, because the liquid “1” needs to be used to make more ethanol. That leaves you with just the “.2” — a bucket of byproduct to feed your horse. You do have a horse, don’t you? If horses are like cattle, then you can only use your byproduct for one-fifth of their diet, so you’ll need four supplemental buckets of hay from your back yard to feed him that you should avoid using fossil fuels to grow or harvest since that will certainly be more energy than contained in the DDG.
Byproduct can be burned, but it takes a significant amount of energy to dry it out, and requires additional handling and equipment — even more energy. More money can be made selling it wet to the cattle industry, which is hurting from the high price of corn. But delivering it takes energy, and that isn’t subtracted from the EROI either. Yet the transportation fraction of the energy required to grow and deliver energy crops to a biorefinery is 7 to 26% for lignocellulosic crops such as switchgrass, miscanthus, and other forage or crop residues (Richard).
Byproduct should be put back into the ground to improve soil nutrition, soil structure, and lessen erosion so future generations won’t starve to death, not sold for short-term profit and fed to cattle who aren’t biologically adapted to eating corn.
The boundaries of what is included in EROEI calculations are kept as narrow as possible to reach positive results.
Researchers who find a positive EROEI for ethanol have not accounted for all of the energy inputs. For example, Shapouri admits the “energy used in the production of … farm machinery and equipment…, and cement, steel, and stainless steel used in the construction of ethanol plants, are not included”. (Shapouri 2002). Or they assign overstated values of ethanol yield from corn (Patzek Dec 2006). Many, many, other inputs are left out.
Patzek and Pimentel have compelling evidence showing that about 30 percent more fossil energy is required to produce a gallon of ethanol than you get from it. Their papers are published in peer-reviewed journals where their data and methods are public, unlike many of the positive net energy results.
Infrastructure. Current EROEI figures don’t take into account the delivery infrastructure that needs to be built. There are 850 million combustion engines in the world today. Just to replace half the 245 million cars and light trucks in the United States with E85 vehicles will take 12-15 years, It would take over $544 million dollars of delivery ethanol infrastructure (Reynolds 2002 case B1) and $5 to $34 billion to revamp 170,000 gas stations nationwide (Heinson 2007).
The EROEI of oil when we built most of the infrastructure in this country was about 100:1, and it’s about 25:1 worldwide now. Even if you believe ethanol has a positive EROEI, you’d probably need at least an EROEI of at least 5 to maintain modern civilization (Hall 2003). A civilization based on ethanol’s “.2” rabbit poop would only work for coprophagous rabbits.
Of the four articles that showed a positive net energy for ethanol in Farrells 2006 Science article, three were not peer-reviewed. The only positive peer-reviewed article (Dias De Oliveira, 2005) states “The use of ethanol as a substitute for gasoline proved to be neither a sustainable nor an environmentally friendly option” and the “environmental impacts outweigh its benefits”. Dias De Oliveria concluded there’d be a tremendous loss of biodiversity, and if all vehicles ran on E85 and their numbers grew by 4% per year, by 2048, the entire country, except for cities, would be covered with corn.
Part 4. Do you want to eat, drive, or drink?
There’s an ethanol gold rush going on. More than half the best farmland in the United States is leased by investors. Two-thirds or more of the farmland in the corn and soy growing states of Iowa, Minnesota, Illinois, and Indiana is rented (65, 74, 84, and 86% respectively).
Notice that these mostly investor-owned corn and soybean growing states, are mainly red in the map below. Red represents the areas where farms have the highest erosion rates.
Owners seeking short-term profits have far less incentive than farmers who work their land to preserve soil and water. They don’t adopt as long-term conservation measures as farm owner-operators do (ERS 1999).
The dark green areas of this map represent where the highest crop subsidy payments go and where the highest nitrogen runoff rates are. Notice that again, these areas correspond with investor-owned farmland. Commodity payments were meant to be a safety net, but the money ends up being used to buy and apply excess fertilizer, which gets into rivers, lakes, and oceans (Redlin 2007).
Excessive atmospheric nitrogen pollution from industrial farming practices threatens plant diversity. About a quarter of 15,000 sites across the United States are likely to lose species as a result of nitrogen pollution (Simkin 2016).

http://www.iwla.org/publications/agriculture/Farm_Bill_2007_WEB.pdf
Water Pollution
Soil erosion is a serious source of water pollution, since it causes runoff of sediments, nutrients, salts, eutrophication, and chemicals that have had no chance to decompose into streams. This increases water treatment costs, increases health costs, kills fish with insecticides that work their way up the food chain (Troeh 2005).
Ethanol plants pollute water. They generate 13 liters of wastewater for every liter of ethanol produced, yet more energy and a lowering of the overall EROEI (Pimentel March 2005)
Water depletion
Biofuel factories use a huge amount of water – four gallons for every gallon of ethanol produced. Despite 30 inches of rain per year in Iowa, there may not be enough water for corn ethanol factories as well as people and industry. Drought years will make matters worse (Cruse 2006).
The facilities that produce ethanol require high-purity water, which is largely taken from confined aquifers, even in the rain-fed Midwest. Given the use of the water from the aquifers, there is clearly a certain amount of unsustainable pumping taking place, according to Jerald Schnoor. In Iowa, for example, there are a large number of ethanol production plants, and the Cambrian- Ordovician aquifer, known as the Jordan aquifer, has been pumped down by 150 or 200 feet, so eventually future generations will not be able to use that aquifer (Institute of Medicine 2014).
Fifty percent of Americans rely on groundwater (Glennon 2002), and in many states, this groundwater is being depleted by agriculture faster than it is being recharged. This is already threatening current food supplies (Giampetro 1997). In some western irrigated corn acreage, groundwater is being mined at a rate 25% faster than the natural recharge of its aquifer (Pimentel 2003).
According to Vaclav Smil, “Corn irrigation is already the single largest user of underground water in the basin, and expansion of the corn-growing area into drier western fringes, or further intensification of corn production, would create additional demand for the mining of the already receding Ogallala aquifer”
Biodiversity
To understand the earth’s overall capacity to produce bioenergy, it is useful to think in terms of its net primary productivity (NPP), which is “the amount of photosynthetic biomass available for exploitation by the biosphere.” The earth’s NPP is staggeringly large—about 56 gigatonnes of carbon dioxide per year. It turns out that humans already use about 30% of NPP for food, fabrics, construction, and other uses. Any increase in the use of biofuels will require an increase in the amount of the earth’s NPP being appropriated for human use. And of course 100% of this NPP is already being used—if not by humans, then by various animals, fungi, bacteria, and other forms of life—so any increase in the human use of the NPP will take away from other ecosystem processes [and drive other species to extinction] (Institute of Medicine 2014).
Every acre of forest and wetland converted to crop land decreases soil biota, insect, bird, reptile, and mammal biodiversity.
Honeybees. Springtime die-offs of honeybees from corn coated with insecticides was discovered in January 2012. Bees are critical for pollinating food crops — these deaths are a part of the mysterious colony collapse disorder (Tapparo).
Part 5. Biodiesel: Can we eat enough French Fries?
The idea we could run our economy on discarded fried food grease is very amusing. For starters, you’d need to feed 7 million heavy diesel trucks getting less than 8 mpg. Seems like we’re all going to need to eat a lot more French Fries, but if anyone can pull it off, it would be Americans. Spin it as a patriotic duty and you’d see people out the door before the TV ad finished, the most popular government edict ever.
Scale. Where’s the Soy? Biodiesel is not ready for prime time. In 2006, John Deere was working on fuel additives and technologies that would allow their equipment to burn more than 5% accredited biodiesel (made to ASTM D6751 specifications – vegetable oil does not qualify). In 2016 John Deere allows up to B20:
“All John Deere engines can use biodiesel blends. B5 blends are preferred, but concentrations up to 20 percent (B20) can be used providing the biodiesel used in the fuel blend meets the standards set by the American Society of Testing Materials (ASTM) D6751 or European Standard (EN) 14214.
John Deere engines with exhaust filters should not use biodiesel blends above B20. Concentrations above B20 may harm the engine’s emissions control system. Specific risks include, but are not limited to, more frequent regeneration, soot accumulation, and increased intervals for ash removal. For these engines, John Deere-approved fuel conditioners containing detergent/dispersant additives are required when using B20, and recommended when using lower biodiesel blends.”
52 billion gallons of diesel fuel are consumed a year in the United States, but only 75 million gallons of biodiesel were produced – two-tenths of one percent of what’s needed. To get the country to the point where gasoline was mixed with 5 percent biodiesel would require 64 percent of the soybean crop and 71,875 square miles of land (Borgman 2007), an area the size of the state of Washington. Soybeans cause even more erosion than corn.
But not to worry, a lot is being grown in Brazil, where the Amazon rainforest is being cut down to grow it.
Biodiesel shortens engine life. Currently, biodiesel concentrations higher than 5 percent can cause “water in the fuel due to storage problems, foreign material plugging filters…, fuel system seal and gasket failure, fuel gelling in cold weather, crankcase dilution, injection pump failure due to water ingestion, power loss, and, in some instances, can be detrimental to long engine life” (Borgman 2007). Biodiesel also has a short shelf life and it’s hard to store – it easily absorbs moisture (water is a bane to combustion engines), oxidizes, and gets contaminated with microbes. It increases engine NOx emissions (ozone) and has thermal degradation at high temperatures (John Deere 2006).
On the cusp of energy descent, we can’t even run the most vital aspect of our economy, agricultural machines, on “renewable” fuels. John Deere tractors can run on no more than 5% accredited biodiesel (Borgman 2007). Perhaps this is unintentionally wise – biofuels have yet to be proven viable, and mechanization may not be a great strategy in a world of declining energy.
Soybeans are the main source of biodiesel, but the food and soap/detergent industries also buy soybeans, driving the price up. There is limited land to grow soybeans and other oily crops on, which limit production, according to DOE and USDA. As a result, experts believe that the total production capacity of biodiesel is ultimately limited compared with other alternative fuels (USGAO).
Part 6. If we can’t drink and drive, then burn baby burn.
Energy Crop Combustion.
Wood is a crop, subject to the same issues as corn, and takes a lot longer to grow. Burning wood in your stove at home delivers far more energy than the logs would if converted to biofuels (Pimentel 2005). Wood was scarce in America when there were just 75 million people. Electricity from biomass combustion is not economic or sustainable.
The immediate crisis is the need for a liquid fuel to substitute for oil or we can’t plant and harvest crops or transport goods, which would cause civilization to collapse. The only liquid fuels possible are liquified coal, Natural Gas Liquids, or biofuels. Burning biomass doesn’t do that — it only generates electricity.
Combustion pollution is expensive to control. Some biomass has absorbed heavy metals and other pollutants from sources like coal power plants, industry, and treated wood. Combustion can release chlorinated dioxins, benzofurans, polycyclic aromatic hydrocarbons, cadmium, mercury, arsenic, lead, nickel, and zinc.
Combustion contributes to global warming by adding nitrogen oxides and the carbon stored in plants back into the atmosphere, as well as removes agriculturally essential nitrogen and phosphate (Reijnders 2006)
EROEI in doubt. Combustion plants need to produce, transport, prepare, dry, burn, and control toxic emissions. Collection is energy intensive, requiring some combination of bunchers, skidders, whole-tree choppers, or tub grinders, and then hauling it to the biomass plant. There, the feedstock is chopped into similar sizes and placed on a conveyor belt to be fed to the plant. If biomass is co-fired with coal, it needs to be reduced to ¼ inch or less, and the resulting fly ash may not be marketable to the concrete industry (Bain 2003). Any alkali or chlorine released in combustion gets deposited on the equipment, reducing overall plant efficiencies, as well as accelerating corrosion and erosion of plant components, requiring high replacement and maintenance energy.
Processing materials with different physical properties is energy intensive, requiring sorting, handling, drying, and chopping. It’s hard to optimize the pyrolysis, gasification, and combustion processes if different combustible fuels are used. Urban waste requires a lot of sorting, since it often has material that must be removed, such as rocks, concrete and metal. The material that can be burned must also be sorted, since it varies from yard trimmings with high moisture content to chemically treated wood.
Biomass combustion competes with other industries that want this material for construction, mulch, compost, paper, and other profitable ventures, often driving the price of wood higher than a wood-burning biomass plant can afford. Much of the forest wood that could be burned is inaccessible due to a lack of roads.
Efficiency is lowered if material with a high water content is burned, like fresh wood. Different physical and chemical characteristics in fuel can lead to control problems (Badger 2002). When wet fuel is burned, so much energy goes into vaporizing the water that very little energy emerges as heat, and drying takes time and energy.
Material is limited and expensive. California couldn’t use crop residues due to low bulk density. In 2000, the viability of California biomass enterprise was in serious doubt because the energy to produce biomass was so high due to the small facilities and high cost of collecting and transporting material to the plants (Bain 2003).
Scale. The largest biomass plants burn wood and rarely reach even 50 MW in size. Coal plants are often 1,500 MW. This is because of “the high cost of transporting low-energy-content biomass. A maximum 40-mile radius for the resource base is typical. And as a consequence of these sizes, biopower plants are typically less efficient than fossil fuel plants are; the cost of implementing high-efficiency technologies is not economically justified at small scales.” (NAS 2009)
Part 7. The problems with Cellulosic Ethanol could drive you to drink.
Many plants want animals to eat their seed and fruit to disperse them. Some seeds only germinate after going through an animal gut and coming out in ready-made fertilizer. Seeds and fruits are easy to digest compared to the rest of the plant, that’s why all of the commercial ethanol and biodiesel are made from the yummy parts of plants, the grain, rather than the stalks, leaves, and roots.
But plants don’t want to be entirely devoured. They’ve spent hundreds of millions of years perfecting structures that can’t easily be eaten. Be thankful plants figured this out, or everything would be mown down to bedrock.
If we ever did figure out how to break down cellulose in our back yard stills, it wouldn’t be long before the 6.5 billion people on the planet destroyed the grasslands and forests of the world to power generators and motorbikes (Huber 2006)
Don Augenstein and John Benemann, who’ve been researching biofuels for over 30 years, are skeptical as well. According to them, “…severe barriers remain to ethanol from lignocellulose. The barriers look as daunting as they did 30 years ago”.
Benemann says the EROEI can be easily determined to be about 5 times as much energy required to make cellulosic ethanol than the energy contained in the ethanol.
The success of cellulosic ethanol depends on finding or engineering organisms that can tolerate extremely high concentrations of ethanol. Augenstein argues that this creature would already exist if it were possible. Organisms have had a billion years of optimization through evolution to develop a tolerance to high ethanol levels (Benemann 2006). Someone making beer, wine, or moonshine would have already discovered this creature if it could exist.
The range of chemical and physical properties in biomass, even just corn stover (Ruth 2003, Sluiter 2000), is a challenge. It’s hard to make cellulosic ethanol plants optimally efficient, because processes can’t be tuned to such wide feedstock variation.
It’s May 2016, and there’s still no commercial-scale cellulosic ethanol, yet 16 billion gallons were supposed to be produced by 2022 (Rapier 2016).
Perhaps this is why British Petroleum has backed out of their $350 million dollar partnership with the University of California Energy Biosciences Institute. BP’s decision targets one area of research in particular—lignocellulosic (LC) biofuel technology and announced a company-wide policy to shift away from research in LC fuels. Skepticism about commercial biofuels persists. A new report from the World Resources Institute, an environmental think tank, said that “Even assuming large increases in efficiency, the quest for bioenergy at a meaningful scale is both unrealistic and unsustainable.” And that claims about the benefits of biofuels have been greatly exaggerated. Especially when it comes the impossibly enormous amount of plant-based materials needed to make biofuels, which would consume valuable agricultural land that would be put to better use growing crops to feed the planet’s surging population (Neumann 2015).
In 2015, Texas-based KiOR filed for bankruptcy. To help pay off the enormous debt of their failed Columbus, Mississippi biofuel plant which cost $230 million to construct, its equipment is being sold. Taxpayers are unlikely to be reimbursed the $79 million that the state OF Mississippe lent and the $1.1 million owed in property taxes. The plant failed in turning wood chips into a crude oil substitute because of problems that plagued its production process. The state of Mississippi is also trying to recover its debt through KiOR’s bankruptcy case in Delaware, and through a lawsuit that claims KiOR investor Vinod Khosla and others knew KiOR had limited chances for success but defrauded Mississippi into loaning $75 million to the company anyway (AP 2015).
Green Fuel Nordic is trying to convert wood to pyrolysis fuels, which has proven difficult so far because wood has tar, which is a gummy residue of long-chain molecules that are hard to refine. Another concern is oxygen, abundant in all biomass which causes problems when oxygen reacts with pyrolysis oil and forms organic acids that can corrode refinery equipment severely (Krieger 2014).
Where will the Billion Tons of Biomass for Cellulosic Fuels Come From?
Not from Algae, that’s for sure. There are dozens of reasons why algae will never be a source of biofuel.
The government believes there is a billion tons of biomass “waste” to make cellulosic biofuels, chemicals, and generate electricity with.
The United States lost 59,334,800 million acres of cropland between 1982 and 2010 (NCRS 2013). At that rate, all of the cropland will be gone in 170 years, and 900 years from now all remaining rural non-federal acres will be buried by development:
| Non-federal Land USA | Cropland Acres | Prime Cropland acres (a) | Developed Land | CRP 1992 Acres | Pasture Acres |
| 1982 | 420,227,000 | 227,682,600 | 70,000,000 | 34,091,100 | 131,533,300 |
| 2010 | 360,892,200 | 201,864,200 | 113,000,000 | 26,610,100 | 120,449,900 |
| acres lost | 59,334,800 | 25,818,400 | 43,000,000 | 7,481,000 | 11,083,400 |
| percent | -14% | -11% | 61% | -22% | -8.40% |
| Non-federal Land USA | Range Acres | Water Erosion tons/ acre (b) | Wind Erosion tons/ acre (c) | Total Rural non-federal acres |
| 1982 | 419,127,000 | 4.37 | 3.63 | 1,424,008,100 |
| 2010 | 409,092,700 | 3.08 | 2.34 | 1,377,424,600 |
| acres lost | 10,034,300 | 46,583,500 | ||
| percent | -2.40% | -3.3 |
(a) page 111
(b) page 129 Table 13. Estimated average annual sheet and rill erosion on non-Federal rural land, by State and year Tons per acre per year
(c) page 147 Table 14. Estimated average annual wind erosion on non-Federal rural land, by State and year Tons per acre per year
There isn’t enough biomass to replace 30% of our petroleum use. The potential biomass energy is miniscule compared to the fossil fuel energy we consume every year, about 105 exa joules (EJ) in the USA. If you burned every living plant and its roots, you’d have 94 EJ of energy and we could all pretend we lived on Mars. Most of this 94 EJ of biomass is already being used for food and feed crops, and wood for paper and homes. Sparse vegetation and the 30 EJ in root systems are economically unavailable – leaving only a small amount of biomass unspoken for (Patzek June 2006).
Over 25% of the “waste” biomass is expected to come from 280 million tons of corn stover. Stover is what’s left after the corn grain is harvested. Another 120 million tons will come from soy and cereal straw (DOE Feedstock Roadmap, DOE Biomass Plan).
There isn’t enough no-till corn stover to harvest. The success of biofuels depends on corn residues. About 80% of farmers disk corn stover into the land after harvest. That renders it useless — the crop residue is buried in mud and decomposing rapidly.
Only the 20 percent of farmers who farm no-till will have stover to sell. The DOE Billion Ton vision assumes all farmers are no-till, 75% of residues will be harvested, and fantasy corn and wheat yields 50% higher than now are reached (DOE Billion Ton Vision 2005). But none of this corn stover should be harvested because corn loses more soil than any other crop grown (Pimentel 2007).
Many tons will never be available because farmers won’t sell any, or much of their residue (certainly not 75%). “Many predictions imagine that farmers will be willing to sell cellulosic biomass for the order of $40 or $50 a ton. Today, they can get $200 a ton for hay.” Given the difference, it is unlikely that many farmers will switch over from hay to cellulosic biomass (Institute of Medicine 2014)
Many more tons will be lost due to drought, rain, or loss in storage.
Only half a percent of a plant can be harvested sustainably every year. Plants only fix a tiny part of solar energy into plant matter annually — about one-tenth to one-half of one percent new growth in temperate climates.
To prevent erosion, you could only harvest 51 million tons of corn and wheat residues, not 400 million tons (Nelson, 2002). Other factors, like soil structure, soil compression, water depletion, and environmental damage weren’t considered. Fifty one million tons of residue could make about 3.8 billion gallons of ethanol, less than 1% of our energy needs.
Using corn stover is a problem, because corn, soy, and other row crops cause 50 times more soil erosion than sod crops (Sullivan 2004) or more (Al-Kaisi 2000), and corn also uses more water, insecticides and fertilizers than most crops (Pimentel 2003)
The amount of soy and cereal straw (wheat, oats, etc) is insignificant. It would be best to use cereal grain straw, because grains use far less water and cause far less erosion than row crops like corn and soybeans. But that isn’t going to happen, because the green revolution fed billions more people by shortening grain height so that plant energy went into the edible seed, leaving little straw for biofuels. Often 90% of soybean and cereal straw is grown no-till, but the amount of cereal straw is insignificant and the soybean residues must remain on the field to prevent erosion
Energy Crops
Energy crops are grown specifically for their fuel value. Tall perennial grasses such as switchgrass and miscanthus are being proposed as potential energy crops. Although grasses cause less erosion and need less fertilizer, they still suffer from the problems that all plants have:
- Most non-food energy crops require as much water as corn, per unit weight (Pimentel 2007). And they need a lot of water to be processed into a biofuel. The Great Plains are the most likely place energy crops would be planted. Yet the Ogallala aquifer is depleting fast and won’t replenish until after the next ice age. Where’s the water to process tall grass prairies into biofuels going to come from?
- Plants have low density compared to fossil fuels. If you try to pelletize or compact them, that takes energy, and they’re still low density. Hay bales are like mattresses – you can only get so many on a truck, and you can’t force them into a pipeline, which would be far less expensive.
- The larger the biorefinery, the better the economies of scale. Biofuels need to be created at a large scale for any hope of a positive energy balance and enough purity to be used in combustion engines, which are extremely fine-tuned for diesel or gasoline, fuel injection, etc.
- Plants aren’t concentrated – they grow diffusely and require a great deal of energy to harvest and deliver to the refinery.
- Plants are hard to store. They rot and turn into mulch or can catch on fire. Storing them wet adds weight, leading to higher transportation costs and high water use.
- All plants succumb to pests and disease. Miscanthus is from China, but eventually pests will evolve to dine upon it, especially if grown in monocrops.
Poor, erodible land. There aren’t enough acres of land to grow significant amounts of energy crops. Potential energy crop land is usually poor quality or highly erodible land that shouldn’t be harvested. Farmers are often paid not to farm this unproductive land. Many acres in switchgrass are being used for wildlife and recreation.
Few suitable bio-factory sites. Biorefineries can’t be built just anywhere – very few sites could be found to build switchgrass plants in all of South Dakota (Wu 1998). Much of the state didn’t have enough water or adequate drainage to build an ethanol factory. The sites had to be on main roads, near railroad and natural gas lines, out of floodplains, on parcels of at least 40 acres to provide storage for the residues, have electric power, and enough biomass nearby to supply the plant year round.
No energy crop farmers or investors. Farmers won’t grow switchgrass until there’s a switchgrass plant. Machines to harvest and transport switchgrass efficiently don’t exist yet (Barrionuevo 2006). The capital to build switchgrass plants won’t materialize until there are switchgrass farmers. Since “ethanol production using switchgrass required 50% more fossil energy than the ethanol fuel produced” (Pimentel 2005), investors for these plants will be hard to find.
Energy crops are subject to Liebig’s law of the minimum too. Switchgrass may grow on marginal land, but it hasn’t escaped the need for minerals and water. Studies have shown the more rainfall, the more switchgrass you get, and if you remove switchgrass, you’re going to need to fertilize the land to replace the lost biomass, or you’ll get continually lower yields of switchgrass every time you harvest the crop (Vogel 2002).
Bioinvasive Potential. These fast-growing disease-resistant plants are potentially bioinvasive, another kudzu. Bioinvasion costs our country billions of dollars a year (Bright, 1998). Johnson grass was introduced as a forage grass and it’s now an invasive weed in many states. Another fast-growing grass, Miscanthus, from China, is now being proposed as a biofuel. It’s been described as “Johnson grass on steroids” (Raghu 2006). These foreign grasses do quite well because they don’t have any pests, yet.
Sugar cane: too little to import. Brazil uses oil for 90% of their energy, and 17 times less oil (Jordan 2006). Brazilian ethanol production in 2003 was 3.3 billion gallons, about the same as the USA in 2004, or 1% of our transportation energy. Brazil uses 85% of their cane ethanol, leaving only 15% for export.
Sugar Cane: can’t grow it here. Although we grow some sugar cane despite tremendous environmental damage (WWF) in Florida thanks to the sugar lobby, we’re too far north to grow a significant amount of sugar cane or other fast growing C4 plants.
Sugar cane has been touted as an “all you need is sunshine” plant. But according to the FAO, the nitrogen, phosphate, and potassium requirements of sugar cane are roughly similar to maize (FAO 2004).
Wood ethanol is an energy sink. Ethanol production using wood biomass required 57% more fossil energy than the ethanol fuel produced (Pimentel 2005).
Wood is a nonrenewable resource. Old-growth forests had very dense wood, with a high energy content, but wood from fast-growing plantations is so low-density and low calorie it’s not even good to burn in a fireplace. These plantations require energy to plant, fertilize, weed, thin, cut, and deliver. The trees are finally available for use after 20 to 90 years – too long for them to be considered a renewable fuel (Odum 1996). Nor do secondary forests always come back with the vigor of the preceding forest due to soil erosion, soil nutrition depletion, and mycorrhizae destruction (Luoma 1999).
There’s not enough wood to fuel a civilization of 300 million people. Over half of North America was deforested by 1900, at a time when there were only 75 million people (Williams 2003). Most of this was from home use. In the 18th century the average Northeastern family used 10 to 20 cords per year. At least one acre of woods is required to sustainably harvest one cord of wood (Whitney 1994).
Energy crop limits. Energy crops may not be sustainable due to water, fertilizer, and harvesting impacts on the soil (DOE Biomass Roadmap 2005). Like all other monoculture crops, ultimately yields of energy crops will be reduced due to “pest problems, diseases, and soil degradation” (Giampetro, 1997).
Energy crop monoculture. The “physical and chemical characteristics of feedstocks vary by source, by year, and by season, increasing processing costs” (DOE Feedstock Roadmap). That will encourage the development of genetically engineered biomass to minimize variation. Harvesting economies of scale will mean these crops will be grown in monoculture, just as food crops are. That’s the wrong direction – to farm with less energy there’ll need to be a return to rotation of diverse crops, and composted residues for soil nutrition, pest, and disease resistance.
A way around this would be to spend more on researching how cellulose digesting microbes tackle different herbaceous and woody biomass. The ideal energy crop would be a perennial, tall-grass prairie / herbivore ecosystem (Tilman 2006). Tilman recommends harvesting “all grassland in the U.S. for ethanol but neglects to report that 100 million cattle, 7 million sheep, and 4 million horses are currently grazing on this grass!” (Pimentel 2007).
Antibiotic Resistance. You are probably aware that a crisis looms ahead as more and more microbes become antibiotic resistant. A major way this is happening is from the healthy animals in factory farms, who consume 80% of all antibiotics to gain more weight and prevent disease. They are also getting antibiotics from ethanol production. A byproduct is produced called Dried Distillers Grain (DDG), which is often contaminated with Lactobacilli which thrive in the ethanol mash it comes from. So ethanol producers add antibiotics like penicillin and erythromycin to the fermentation tanks. When factory farm animals eat DDG, they are also eating illegal antibiotics (Olmstead 2012, Laskawy 2012, McKenna 2012).
Farmers aren’t Stupid: They won’t sell their residues
Farmers are some of the smartest people on earth or they’d soon go out of business. They have to know everything from soil science to commodity futures.
Crop production is reduced when residues are removed from the soil. Why would farmers want to sell their residues?
Erosion, water, compression, nutrition. Harvesting of stover on the scale needed to fuel a cellulosic industry won’t happen because farmers aren’t stupid, especially the ones who work their own land. Although there is a wide range of opinion about the amount of residue that can be harvested safely without causing erosion, loss of soil nutrition, and soil structure, many farmers will want to be on the safe side, and stick with the studies showing that 20% (Nelson, 2002) to 30% (McAloon et al., 2000; Sheehan, 2003) at most can be harvested, not the 75% agribusiness claims is possible. Farmers also care about water quality (Lal 1998, Mann et al, 2002). And farmers will decide that permanent soil compression is not worth any price (Wilhelm 2004). As prices of fertilizer inexorably rise due to natural gas depletion, it will be cheaper to return residues to the soil than to buy fertilizer.
Residues are a headache. The further the farmer is from the biorefinery or railroad, the slimmer the profit, and the less likely a farmer will want the extra headache and cost of hiring and scheduling many different harvesting, collection, baling, and transportation contractors for corn stover.
Residues are used by other industries. Farm managers working for distant owners are more likely to sell crop residues since they’re paid to generate profits, not preserve land. But even they will sell to the highest bidder, which might be the livestock or dairy industries, furfural factories, hydromulching companies, biocomposite manufacturers, pulp mills, or city dwellers faced with skyrocketing utility bills, since the high heating value of residue has twice the energy of the converted ethanol.
Investors aren’t stupid either. If farmers can’t supply enough crop residues to fuel the large biorefinery in their region, who will put up the capital to build one?
Can the biomass be harvested, baled, stored, and transported economically?
Plants are closer to cotton candy than rocks. The oil to harvest, bale, deliver, clean, and store these straw pillows is likely to use more energy than the cellulosic fuels created.
Harvesting. Sixteen ton tractors harvest corn and spit out stover. Many of these harvesters are contracted and will continue to collect corn in the limited harvest time, not stover. If tractors are still available, the land isn’t wet, snow doesn’t fall, and the stover is dry, three additional tractor runs will mow, rake, and bale the stover (Wilhelm 2004). This will triple the compaction damage to the soil (Troeh 2005), create more erosion-prone tire tracks, increase CO2 emissions, add to labor costs, and put unwanted foreign matter into the bale (soil, rocks, baling wire, etc).
So biomass roadmaps call for a new type of tractor or attachment to harvest both corn and stover in one pass. But then the tractor would need to be much larger and heavier, which could cause decades-long or even permanent soil compaction. Farmers worry that mixing corn and stover might harm the quality of the grain. And on the cusp of energy descent, is it a good idea to build an even larger and more complex machine?
If the stover is harvested, the soil is now vulnerable to erosion if it rains, because there’s no vegetation to protect the soil from the impact of falling raindrops. Rain also compacts the surface of the soil so that less water can enter, forcing more to run off, increasing erosion. Water landing on dense vegetation soaks into the soil, increasing plant growth and recharging underground aquifers. The more stover left on the land, the better.
Baling. The current technology to harvest residues is to put them into bales of hay. Hay is a dangerous commodity — it can spontaneously combust, and once on fire, can’t be extinguished, leading to fire loss and increased fire insurance costs. Somehow the bales have to be kept from combusting during the several months it takes to dry them from 50 to 15 percent moisture. A large, well drained, covered area is needed to vent fumes and dissipate heat. If the bales get wet they will compost (Atchison 2004).
Baling was developed for hay and has been adapted to corn stover with limited success. Biorefineries need at least half a million tons of biomass on hand to smooth supply bumps, much greater than any bale system has been designed for. Pelletization is not an option, it’s too expensive. Other options need to be found. (DOE Feedstock Roadmap)
To get around the problems of exploding hay bales, wet stover could be collected. The moisture content needs to be around 60 percent, which means a lot of water will be transported, adding significantly to the delivery cost.
25% of switchgrass and corn stover are lost during the harvesting and baling as well as a great deal of energy in each step (Ruth 2013).
| Step | Equipment | DM tons/ acre SW | Energy used Mbtu/ DM ton SW | DM tons/ acre CS | Energy used Mbtu/ DM ton CS |
| 1 | 180 HP tractor & 15-ft flail shredder w/Windrower | NA | NA | 3 | 50.1 |
| 2 | self-propelled Windrower with Disc Header | 5 | 30.9 | NA | NA |
| 3 | 275 HP tractor & large square baler | 4 | 61.2 | 2.4 | 61.2 |
| 4 | self-propelled Loader | 4 | 13.7 | 2.4 | 13.7 |
| 5 | self-propelled Stacker | 4 | 25.4 | 2.4 | 25.4 |
| 6 | Weather protection | 4 | 0 | 2.4 | 0 |
| 7 | self-propelled loader | 3.8 | 12.4 | 2.28 | 12.4 |
| Total 24% loss of switchgrass and corn stover | -1.2 | 143.6 | -0.72 | 162.8 |
Storage. Stover needs to be stored with a moisture content of 15% or less, but it’s typically 35-50%, and rain or snow during harvest will raise these levels even higher (DOE Feedstock Roadmap). If it’s harvested wet anyhow, there’ll be high or complete losses of biomass in storage (Atchison 2004).
After catastrophic fires, the pulp industry learned to only use wet feedstock. If residues are stored wet, as in ensilage, a great deal of R&D will be needed to see if there are disease, pest, emission, runoff, groundwater contamination, dust, mold, or odor control problems. The amount of water required is unknown. The transit time must be short, or aerobic microbial activity will damage it. At the storage site, the wet biomass must be immediately washed, shredded, and transported to a drainage pad under a roof for storage, instead of baled when drier and left at the farm. The wet residues are heavy, making transportation costlier than for dry residues, perhaps uneconomical. It can freeze in the winter making it hard to handle. If the moisture is too low, air gets in, making aerobic fermentation possible, resulting in molds and spoilage.
Delivery to the biorefinery and preprocessing
Although a 6,000 dry ton per day biorefinery would have 33% lower costs than a 2,000 ton factory, it’s impossible to build biorefineries to optimal scale, because the price of gas and diesel limits the distance trucks can haul biomass to the biofuel refinery from farms, since the bales are large in volume but low in density.
So the “economy of scale” achieved by a very large refinery has to be reduced to a 2,000 dry ton per day biorefinery. Even this smaller refinery would require 200 trucks per hour delivering biomass during harvest season (7 x 24), or 100 trucks per day if satellite sites for storage are used. This plant would need 90% of the no-till crop residues from the surrounding 7,000 square miles with half the farmers participating. Yet less than 20% of farmers practice no-till corn and not all of the farmland is planted in corn. When this biomass is delivered to the biorefinery, it will take up at least 100 acres of land stacked 25 feet high.
The average stover haul to the biorefinery would be 43 miles one way if these rosy assumptions all came true (Perlack 2002). If less than 30% of the stover is available, the average one-way trip becomes 100 miles and the biorefinery is economically impossible.
| Step | Equipment | Energy used Mbtu/ DM ton SW | Energy used Mbtu/ DM ton CS |
| 1 | 3-Axle daycab tractor with 53-ft flat bed trailer | 12.6 | 12.6 |
| 2 | Truck Scale (weighing) | 0 | 0 |
| 3 | Unloading | 12.4 | 12.4 |
| 4 | Loading (to grinder) | 5.1 | 5.7 |
| 5 | Grinder in-feed system (conveyer) | 6.1 | 6.1 |
| 6 | Horizontal Grinder | 125 | 125 |
| 7 | Wernerberg 1/4 Grinder | 90.9 | 45.4 |
| Dust collection system | 76.5 | 76.5 | |
| Surge Bin and conveying system | 6.2 | 6.1 | |
| Total | 322.1 | 277.2 |
Source: (Ruth 2013). Too many steps each using too much energy. You can see the EROI eroding.
Delivery to Customer (also see Biofuel distribution wastes valuable diesel fuel)
Ethanol can’t be delivered in the most efficient, least costly way: by pipeline, because of the presence of water in pipelines which ethanol would absorb, and ruin any combustion engine that tried to burn it, plus it’s corrosive and can damage seals, gaskets, and other equipment and induce stress-corrosion cracking in high-stress areas. If ethanol were used at concentrations over 20%, a new infrastructure for ethanol’s transport and distribution plus many refueling stations would need to be built (NAC 2009).
It takes an enormous amount of energy to deliver mid western ethanol to the East and West coast by train, barge, and truck. Although biobutanol could be put into pipelines, it does not provide the same octane enhancement of ethanol. If you tried to work around all the difficulties of various biofuels by giving each one its own transportation infrastructures, that would become a constraint in and of itself.
That’s why biorefineries must exist in an area of dense roads. Railroad delivery is ideal, but 40% of train cars are carrying coal on many routes, and other just-in-time products, or produce that might spoil if the train stopped and started often enough to pick up biomass (it’s expensive energy-wide to stop and start trains). The outer distance for truck delivery can’t be too far or the oil used makes it uneconomic.
There is also a shortage of truck drivers, the rail system can’t handle any new capacity, and trains are designed to operate between hubs, not intermodally (truck to train to truck). The existing transportation system has not changed much in 30 years, yet this congested, inadequate infrastructure somehow has to be used to transport huge amounts of ethanol, biomass, and byproducts (Haney 2006).
In Summary: Plants are Hard to Make into Fuels
- Not enough water for people, industry, and biofuel refineries now. By 2100, the U.S. Census projects potentially 1.1 billion people in the United States.
- Plants have low density. They’re like big mattresses when you bunch them up into bales. If you try to compact them further by turning them into pellets, it takes so much energy that you’re entering negative energy land.
- Truck transportation is expensive compared to pipelines. You can’t stuff plant mattresses into a pipe – you have to load them onto oil-burning trucks, nor can you load them up with as many as you’d like, because they take up a lot of space.
- Plants grow diffusely across the landscape — a biorefinery needs plants delivered from the surrounding 7,000 or more square miles for a 2,000 ton/day refinery.
- Every processing step takes energy. Plants must be planted, harvested, delivered, stored, milled, liquefied, heated, saccharified, fermented, evaporated, centrifuged, distilled, scrubbed, dried, stored, and transported to customers.
- Biorefineries need to be enormous for economies of scale –100 acres of hay stacked 25 feet high.
- You can’t do this at home – biofuels need to be pure or combustion engine life may be shortened, and used within 3 months before microbes chew them up. Some of the gasohol made in the 1980’s had so much water in it that gasohol got a bad name, that’s why it’s called ethanol in it’s new reincarnation.
- Plants are hard to store. They rot and turn into mulch or can catch on fire. If stored wet, that adds to transportation costs and water use at the storage site.
As a systems architect and engineer, I looked at projects from start to end, trying to identify the failure points. The Department of Energy Biomass Roadmaps and the Energy Biosciences Institute Proposal have taken a similar approach and identified the barriers to cellulosic fuels.
All of the steps from A to Z must succeed or a project fails. Just solving the cellulosic issues within the biorefinery won’t do any good if the other steps fail. There are major challenges in harvesting, storing, transporting biomass, and delivering cellulosic fuels to customers.
In business you’re limited by money, in science, you’re limited by the laws of physics and thermodynamics.
When it comes to biofuels, you’re also limited by ecosystems. To grow plants sustainably, the soil ecosystem and water supply need to be taken into account.
The government and business entities don’t appear to be looking at the entire process from start to end, or there’d be no government subsidies to the ethanol industry or investment in commercial-level ethanol plants. If prices are compared on the basis of energy content, ethanol has been consistently more expensive than gasoline because a gallon of ethanol has less energy than a gallon of petroleum-based gasoline. Thus, ethanol producers are making little money even though their biofuel is more expensive than gasoline in terms of energy supplied per gallon.
Other crazy schemes: Biomass Gas-to-Liquid (BGTL)
BGTL is a fuel produced from biomass by gasifying it into an intermediary product called syngas, and then converted into a diesel-like fuel. This fuel is not commercially produced, because many technological and economic challenges need to be overcome, such as identifying biomass feedstocks that are suitable for efficient conversion to a syngas and developing effective methods for preparing the biomass for conversion into a syngas. Furthermore, DOE researchers report that significant work remains to successfully gasify biomass feedstocks on a large enough scale to demonstrate commercial viability. DOE reported that the costs of producing biomass GTL will be very high (USGAO).
Cellulosic Biorefineries (see Appendix for more barriers)
Synthetic biologists are trying to make oil rather than ethanol for many reasons. There are billions of combustion engines that can only burn oil, which is free concentrated sunshine brewed by Mother Nature over hundreds of millions of years. Only uranium packs more punch per unit weight. The 98 tons of fossil plants per gallon is equal to 40 acres of wheat.
Oil is easily poured, stored, and transported, combusts without problems rather than exploding. Basically, if you were trying to create an ideal energy, you’d invent oil.
But with every step required to transform a substance into energy, there is less energy yield. If a microbe can be created which digests cellulose and excretes oil, the number of steps can be reduced.
But plants have evolved for millions of years to prevent themselves from being eaten. It will be hard to pull off. In termites, multiple microbe species are involved in breaking down lignocellulose, each consumes the wastes of others, which are toxic to the creature generating them. Keeping predators out of the vats, getting rid of contaminants, replicating enzymes and too many other issues to list make it unlikely cellulosic fuels can be made in the near future with a positive net energy.
There are over 60 barriers to be overcome in making cellulosic ethanol in Section III of the DOE “Roadmap for Agriculture Biomass Feedstock Supply in the United States” (DOE Feedstock Roadmap 2003). For example:
Jerald Schnoor, professor of civil and environmental engineering at the University of Iowa, said that “The enzymes [to create cellulosic ethanol cost] $1 per gallon, and we’re trying to produce the fuel for $1.50 per gallon, so we’re quite far away from a commercial cellulosic biofuel.” Furthermore, Schnoor noted, if the mandated production for cellulosic biofuels was to be met by 2015 and 2020 and 2022, the plants would have to be built now—and they are not. “So, it’s virtually assured that there’s no way we’re going to [produce] 16 billion gallons of cellulosic biofuels [especially considering that] we’re only producing 25,000 gallons currently” (Institute of Medicine 2014).
“Enzyme Biochemistry. Enzymes that exhibit high thermostability and substantial resistance to sugar end-product inhibition will be essential to fully realize enzyme-based sugar platform technology. The ability to develop such enzymes and consequently very low cost enzymatic hydrolysis technology requires increasing our understanding of the fundamental mechanisms underlying the biochemistry of enzymatic cellulose hydrolysis, including the impact of biomass structure on enzymatic cellulose decrystallization. Additional efforts aimed at understanding the role of cellulases and their interaction not only with cellulose but also the process environment is needed to affect further reductions in cellulase cost through improved production”.
No wonder many of the issues with cellulosic biofuels aren’t discussed – there’s no way to express the problems in a sound bite.
It may not be possible to reduce the complex cellulose digesting strategies of bacteria and fungi into microorganisms or enzymes that can convert cellulose into fuel in giant steel vats, especially given the huge physical and chemical variations in feedstock. The field of metagenomics is trying to create a chimera from snips of genetic material of cellulose-digesting bacteria and fungi. That would be the ultimate Swiss Army-knife microbe, able to convert cellulose to sugar and then sugar to ethanol or oil (i.e. butanol).
There’s also research to replicate termite gut cellulose breakdown. Termites depend on fascinating creatures called protists in their guts to digest wood. The protists in turn outsource the work to multiple kinds of bacteria living inside of them. This is done with energy (ATP) and architecture (membranes) in a system that evolved over millions of years. If the termite could fire the protists and work directly with the bacteria, that probably would have happened 50 million years ago. This process involves many kinds of bacteria, waste products, and other complexities that may not be reducible to an enzyme or a bacteria.
Jay Keasling, Director of Physical Biosciences at LBNL, proposes to do the above in a synthetic biology factory. You’d order up the biological bits you need to create a microbial machine the way electronics parts are obtained at Fry’s electronics stores. At U.C. Berkeley on April 21, 2007, he said this could also be used to get past the 15% concentration of ethanol that pickles micro-organisms, which results in a tremendous amount of energy being used to get the remaining 85% of water out. Or you could use this technology to create a creature that could convert miscanthus and switchgrass to create biofuels that can be put in pipelines and burned in diesel engines (Singer 2007).
Biologists roll their eyes when reductionist physicists pat them on the head and tell little ol’ biology not to worry, living organisms can be reduced to atoms and enzymes, just take a piece of algae here, a bit of fungi or bacteria there and voila – a new creature that produces vast volumes of biofuels quickly. But biology is a messy wonderment. Creatures exist within food webs and don’t reproduce well if surrounded by their own toxic wastes. The research is well worth doing, but public policy shouldn’t assume synthetic biology is a “slam dunk”.
But meanwhile we’re stuck with corn and ethanol, which in the end must be delivered to the customer. Since ethanol can’t be delivered cheaply through pipelines, but must be transported by truck, rail, or barge (Yacobucci 2003), this is very expensive for the coastal regions. Alaska and Hawaii have managed to get out of having to add ethanol to gasoline, but California’s Senator Feinstein has not been able to do the same.
The whole cellulosic ethanol enterprise falls apart if the energy returned is less than the energy invested or even one of the major stumbling blocks can’t be overcome. If there isn’t enough biomass, if the residues can’t be stored without exploding or composting, if the oil to transport low-density residues to biorefineries or deliver the final product is too great, if no cheap enzymes or microbes are found to break down lignocellulose in wildly varying feedstocks, if the energy to clean up toxic byproducts is too expensive, or if organisms capable of tolerating high ethanol concentrations aren’t found, if the barriers in Appendix A can’t be overcome, then cellulosic fuels are not going to happen.
Indistrial processes depend on reliable inputs, but there are so many variations of structural carbohydrates in stover that the price could increase by as much as 25% from the difficulties of having to deal with that wide a range of material (Thomas).
If the obstacles can be overcome, but we lose topsoil, deplete aquifers, poison the land, air, and water, what kind of Pyrrhic victory is that?
Scientists have been trying to solve these issues for over thirty years now.
Nevertheless, this is worthy of research money, but not public funds for commercial refineries until the issues above have been solved. This is the best hope we have for replacing the half million products made from and with fossil fuels, and for liquid transportation fuels when population falls to pre-coal levels.
Part 8. Biofuels increase Climate Change
Biofuels made from corn stover — stalks, leaves and cobs that remain after harvest — emit more carbon dioxide over their life cycle than federal standards allow and 7% more than gasoline emissions. The findings cast doubt on whether corn residue can be used to meet federal mandates to ramp up ethanol production and reduce greenhouse gas emissions (Liska 2014).
Biofuel from coal-burning biomass factories increases global warming (Farrell 2006). Driving a mile on ethanol from a coal-using biorefinery releases more CO2 than a mile on gasoline (Ward 2007). Coal in ethanol production is seen as a way to displace petroleum (Farrell 2006, Yacobucci 2006) and it’s already happening (Clayton 2006).
Intensive nitrogen fertilizer use generates high amounts of emissions of nitrous oxide, a much more powerful greenhouse gas than CO2, worsening greenhouse gas emissions (Howarth).
Surface Albedo. “How much the sun warms our climate depends on how much sunlight the land reflects (cooling us), versus how much it absorbs (heating us). A plausible 2% increase in the absorbed sunlight on a switch grass plantation could negate the climatic cooling benefit of the ethanol produced on it. We need to figure out now, not later, the full range of climatic consequences of growing cellulose crops” (Harte 2007).
Climate change is already increasing runoff and erosion (SWCS 2003). Biofuels are increasing runoff and erosion. A destructive positive feed-back loop.
Part 9. Where do we go from here?
Giampietro and Mayumi (2009) write a book about how on earth, given all of the above, did we ever throw so much money at an obviously futile endeavor as the biofuel industry? They call for a scientific framework that better evaluates an energy resource before spending so much money on a boondoggle. In 2014, Stanford University tried to do this by starting a net energy department, since net energy analysis should be a standard policy tool, since it takes energy to make energy, and net energy analysis can determine the sustainability of energy technologies (Shwartz 2014). Giampietro and Mayumi are also among the few scientists to discuss the enormous ecological damage: large-scale production of agro-biofuels requires an excessive amount of land,competing with food production, reduces biodiversity by destroying habitats, corn monoculture increases the vulnerability of crops to pests, as well as the use of only a few commercial seeds reducing corn’s genetic diversity, toxic amounts of fertilizers, salinization, depletion of aquifers. Yet people support biofuels because they think they’re sustainable!
Subsidies and Politics: Now, and for the Foreseeable Future, Ethanol Will Only be Made from Corn
Biofuels from biodiverse, tall grass prairie are far preferable to ethanol from corn and soy, but there are no commercial level cellulosic biorefineries – and we are a long way from being able to deliver cellulosic fuels to customers. Even if all of the barriers to cellulosic fuels could be achieved before oil shocks hit, they’d bankrupt our soils so quickly that there’d be no biomass to feed the maws of the biorefineries.
How come there are over 116 ethanol plants with 79 under construction and 200 more planned? Government subsidies and tax breaks.
Federal and state ethanol subsidies add up to 79 cents per liter (McCain 2003), with most of that going to agribusiness, not farmers. There is also a tax break of 5.3 cents per gallon for ethanol (Wall Street Journal 2002). An additional 51 cents per gallon goes mainly to the oil industry to get them to blend ethanol with gasoline.
In addition to the $8.4 billion per year subsidies for corn and ethanol production, the consumer pays an additional amount for any product with corn in it (Pollan 20005), beef, milk, and eggs, because corn diverted to ethanol raises the price of corn for the livestock industry.
California Senator Feinstein calls ethanol a transfer of wealth to the Midwest, where 99% of ethanol is made. She points out it can’t be shipped through gasoline pipelines, only by truck, boat, or rail, which is extremely expensive to transport from the Midwest to California. She notes that any shortfall in supply or manipulation could drive prices even higher (Feinstein 2003, Washington Post 2002).
Coming to a theater near you: Enron Part 2.
The subsidies may never end, because Iowa plays a leading role in who’s selected to be the next president. John McCain has backed off on his criticism of ethanol now that he’s running for president (Birger 2006).
“Once we have a corn-based technology up and running the political system will protect it,” said Lawrence J. Goldstein, a board member at the Energy Policy Research Foundation. “We cannot afford to have 15 billion gallons of corn-based ethanol in 2015, and that’s exactly where we are headed” (Barrionuevo 2007).
Let’s stop the ethanol subsidies and see if this elephant can fly on its own.
Conclusion
President Carter asked us to put our sweaters on, and had plans for a soft landing, but Americans chose Reagans’ “Morning in America” and having our military do whatever was necessary to maintain the “non-negotiable” American way of life. Now we’re in for a much harder landing.
Soil is the bedrock of civilization (Perlin 1991, Ponting 1993). Biofuels are not sustainable or renewable. Why would we destroy our topsoil, increase global warming, deplete and pollute groundwater, destroy fisheries, and use more energy than what’s gained to make ethanol? Why would we do this to our children and grandchildren?
Perhaps it’s a combination of pork barrel politics, an uninformed public, short-sighted greedy agribusiness corporations, jobs for the Midwest, politicians getting too large a percent of their campaign money from agribusiness (Lavelle 2007), elected leaders without science degrees, and desperation to provide liquid transportation fuels (Bucknell 1981, Hirsch 2005).
But this madness puts our national security at risk. Destruction of topsoil and collateral damage to water, fisheries, and food production will result in less food to eat or sell for petroleum and natural gas imports. Diversion of precious dwindling energy and money to impossible solutions is a threat to our nations’ future. In an oil-less future, prime farm land is a nation’s number one resource.
We are upset at mountain tops being blasted off to produce coal, and the damage done by mining for metal, yet mining footprints pale in comparison with the hundreds of millions of acres being mined to grow food. Regardless of the energy crisis, agriculture needs reforming.
Let’s use the limited energy we have left to fix what’s wrong with agriculture.
Fix the unsustainable and destructive aspects of industrial agriculture. At least some good would come out of the ethanol fiasco if more attention were paid to how we grow our food. The effects of soil erosion on crop production have been hidden by mechanization and intensive use of fossil fuel fertilizers and chemicals on crops bred to tolerate them. As energy declines, crop yields will decline as well.
States can play an important role. California is putting the brakes on coal with Global Warming bill AB32. This bill should also try to force needed agricultural reforms by buying only sustainable biofuels from biodiverse grassland crops to protect our soils and water, plus put more carbon into the ground.
Jobs. Since part of what’s driving the ethanol insanity is job creation, divert the subsidies and pork barrel money to erosion control and sustainable agriculture. Maybe Iowa will emerge from its makeover looking like Provence, France, and volunteers won’t be needed to hand out free coffee at rest areas along I-80.
Continue to fund cellulosic ethanol research, focusing on how to make 500,000 fossil-fuel-based products (i.e. medicine, chemicals, plastics, etc) and fuel for when population declines to pre-fossil fuel carrying capacity. The feedstock should be from a perennial, tall-grass prairie herbivore ecosystem, not food crops. But don’t waste taxpayer money to build demonstration or commercial plants until most of the research and sustainability barriers have been solved.
Take away the E85 loophole that allows Detroit automakers to ignore CAFE standards and get away with selling even more gas guzzling vehicles (Consumer Reports 2006). Raise the CAFE standards higher immediately. Pass laws to favor low-emission vehicle sales and require all new cars to have energy efficient tires.
There are better, easier ways to stretch out petroleum than adding ethanol to it. Just keeping tires inflated properly would save more energy than all the ethanol produced today. Reducing the maximum speed limit to 55, consumer driving tips, truck stop electrification, and many other measures can save far more fuel in a shorter time than biofuels ever will, far less destructively. Better yet, Americans can bike or walk, which will save energy used in the health care system.
Reform our non-sustainable agricultural system
- Give integrated pest management and organic agriculture research more funding
- The National Resources Conservation Service (NCRS) and other conservation agencies have done a superb job of lowering the erosion rate since the dustbowl of the 1930’s. Give these agencies a larger budget to further the effort.
- We need to make sure that the budget given to the Natural Resources Conservation Service in the 2007 Farm Bill isn’t diverted to corn and ethanol subsidies. The farm bill should have a much larger budget for conservation of land and water.
- To promote land stewardship, change taxes and zoning laws to favor small family farms. This will make possible the “social, economic, and environmental diversity necessary for agricultural and ecosystem stability” (Opie 2000).
- Make the land grant universities follow the directive of the Hatch Act of 1887 to improve the lives of family farmers. Stop funding agricultural mechanization and petrochemical research and start funding how to fight pests and disease with diverse crops, crop rotations, and so on (Hightower 1978).
- Don’t allow construction of homes and businesses on crop land.
- Integrate livestock into the crop rotation.
- Teach family farmers and suburban homeowners how to maximize food production in limited space with Rodale and Biointensive techniques.
- Since less than 1 percent of our elected leaders and their staff have scientific backgrounds, educate them in systems ecology, population ecology, soil, and climate science. So many of the important issues that face us need scientific understanding and judgment.
- Divert funding from new airports, roads, and other future senseless infrastructure towards research in solar, wind, and cellulosic products. We’re at the peak of scientific knowledge and our economic system hasn’t been knocked flat yet by energy shortages – if we don’t do the research now, it may never happen.
- And vote with your fork – buy local, organic food.
- Above all, we need to elect leaders who understand the gravity of the situation and have planned for what to do when oil shocks hit.
There are many institutions and people who have been working on these issues for decades. What we need is a grass roots movement to enact reforms while we still have plentiful energy.
It’s not unreasonable to expect farmers to conserve the soil, since the fate of civilization lies in their hands. But we need to pay farmers for far more than the cost of growing food so they can afford to conserve the land. In an oil-less future, healthy topsoil will be our most important resource.
If we do nothing, dustbowls will return. Erosion and other ecological damage is insidious, it doesn’t happen overnight. We should try to manage our soils to last at least two thousand years. There’s no excuse not to – we know how to do this.
A Science magazine article in 2013 (Scholes et al) stated:
“In the past, great civilizations have fallen because they failed to prevent the degradation of the soils on which they were founded (Diamond). The modern world could suffer the same fate at a global scale. The inherent productivity of many lands has been dramatically reduced as a result of soil erosion, accumulation of salinity, and nutrient depletion. In Africa, where much of the future growth in agriculture must take place, erosion has reduced yields by 8% at continental scale (Lal), and nutrient depletion is widespread (Sanchez). Although improved technology—including the unsustainably high use of fertilizers, irrigation, and plowing—provides a false sense of security, about 1% of global land area is degraded every year (FAO). As Fierer et al. show, the diversity of soil biota in the prairie soils of the American Midwest has changed substantially since cultivation (Fierer). We have forgotten the lesson of the Dust Bowl: Even in advanced economies, human well-being depends on looking after the soil (Egan). An intact, self-restoring soil ecosystem is essential, especially in times of climate stress.
Soil fertility—the capacity to sustain abundant plant production—was a mystery to the ancients. Traditional farmers speak of soils becoming tired, sick, or cold; the solution was typically to move on until they recovered. Enlightenment science brought the insight that plant growth combined carbon dioxide from the air with water and nutrients from the soil. By the mid-20th century, soils and plants could be routinely tested to diagnose deficiencies, and a global agrochemical industry set out to fix them (Smil 2004). Soil came to be viewed as little more than an inert supportive matrix, to be flooded with a soup of nutrients.
This narrow approach led to an unprecedented increase in food production, but also contributed to global warming and pollution of aquifers, rivers, lakes, and coastal ecosystems. Activities associated with agriculture are currently responsible for just under one-third of greenhouse gas emissions; more than half of these originate from the soil (Smith 2013). The eroded sediments and excess nutrients drain into rivers. Diminishing freshwater quality is a constraint on human development in many places, and freshwater biodiversity is the most threatened on the planet (Bennett et al 2001). Replacing the fertility-sustaining processes in the soil with a dependence on external inputs has made the soil ecosystem, and humans, vulnerable to interruptions in the supply of those inputs, for instance due to price shocks.
Microbiological and genetic analysis has shown that there is more genetic variability in a healthy soil than in all of the plants and animals it supports. The variety of ways in which soil constituents can be processed and transformed by a diverse soil microbial community provides an energy-efficient, nonleaky, self-regulating system that can adapt to changing environments (Giller 1997).
Including biology in the concept of soil fertility has been an important advance, but a further conceptual broadening is needed to manage soils in a sustainable way. The challenge is to build and sustain high soil fertility in a world with rising direct and environmental costs of fossil energy and declining external supplies of critical nutrients, such as phosphates (Déry 2007). Ensuring that the biological system is resilient under an uncertain future requires that soil biological diversity be restored as well. Rebuilding soil organic matter is both an indicator of success in this endeavor and a way to reduce the carbon load in the atmosphere (Schmidt 2011).
Responsible politicians need to tell Americans why their love affair with the car can’t continue. Leaders need to make the public understand that there are limits to growth, and an increasing population leads to the “Tragedy of the Commons”. Even if it means they won’t be re-elected. Arguing this amidst the church of development that prevails is like walking into a Bible-belt church and telling the congregation God doesn’t exist, but it must be done.
We are betting the farm on making cellulosic fuels work at a time when our energy and financial resources are diminishing. No matter how desperately we want to believe that human ingenuity will invent liquid or combustible fuels despite the laws of thermodynamics and how ecological systems actually work, the possibility of failure needs to be contemplated.
Living in the moment might be enlightenment for individuals, but for a nation, it’s disastrous. Is there a Plan B if biofuels don’t work? Coal is not an option. CO2 levels over 1,000 ppm could lead to the extinction of 95% of life on the planet (Lynas 2007, Ward 2006, Benton 2003).
Here we are, on the cusp of energy descent, with mechanized petrochemical farms. We import more farm products now than we sell abroad (Rohter 2004). Suburban sprawl destroys millions of acres of prime farm land as population grows every year. We’ve gone from 7 million family farms to 2 million much larger farms and destroyed a deeply satisfying rural way of life.
More people will need to go back to the land during energy descent, so let’s start now, and encourage small family farms.
There need to be plans for de-mechanization of the farm economy if liquid fuels aren’t found. There are less than four million horses, donkeys, and mules in America today. According to Bucknell, if the farm economy were de-mechanized, you’d need at least 31 million farm workers and 61 million horses (Bucknell 1981).
We need to start on “Plan B” now in case biofuels aren’t invented before oil shocks strike. We don’t want to experience the same discontinuities as Cuba (Oxfam 2001) and North Korea (Williams 2000) did.
The population of the United States has grown over 25 percent since Bucknell published Energy and the National Defense. To de-mechanize now, we’d need 39 million farm workers and 76 million horses. The horsepower represented by just farm tractors alone is equal to 400 million horses. It’s time to start increasing horse and oxen numbers, which will leave even less biomass for biorefineries.
If we wait, the consequences will be Stalinesque. You can’t just do this overnight, and with the ownership of land concentrated in so few hands, you’re automatically heading towards feudalism rather than the Jeffersonian ideal our nation was founded on.
We need to transition from petroleum power to muscle power gracefully if we want to preserve democracy. Paul Roberts wonders whether the coming change will be “peaceful and orderly or chaotic and violent because we waited too long to begin planning for it” (Roberts 2004).
We’re facing Peak Oil, Peak Natural Gas, Peak Coal, and climate change. As we go down the energy ladder and go up the thermometer, what is the likely carrying capacity of the United States? Is it 100 million (Pimentel 1991) or 250 million (Smil 2000)? Whatever carrying capacity is decided upon, pass legislation to drastically lower immigration and encourage one child families until America reaches this number. Or we can let resource wars, hunger, disease, extreme weather, rising oceans, and social chaos legislate the outcome.
Do you want to eat or drive? Even without growing food for biofuels, crop production per capita is going to go down as population keeps increasing, fossil fuel energy decreases, topsoil loss continues, and aquifers deplete, especially the Ogallala (Opie 2000). Where will the money come from to buy imported oil and natural gas if we don’t have food to export?
There is no such thing as “waste” biomass. As we go down the energy ladder, plants will increasingly be needed to stabilize climate, provide food, medicine, shelter, furniture, heat, light, cooking fuel, clothing, etc.
Biofuels are a threat to the long-term national security of our nation. Is Dr. Strangelove in charge, with a plan to solve defense worries by creating a country that’s such a salty polluted desert, no one would want to invade us? Why is Dr. Strangelove spending the last bits of energy in Uncle Sam’s pocket on moonshine? Perhaps he’s thinking that we’re all going to need it, and the way things are going, he’s probably right.
Appendix
Department of Energy Biofuel Roadmap Barriers
This is a partial summary of biofuel barriers from Department of Energy. Unless otherwise footnoted, the problems with biomass fuel production are from the Multi Year Program Plan DOE Biomass Plan or Roadmap for Agriculture Biomass Feedstock Supply in the United States. (DOE Biomass Plan, DOE Feedstock Roadmap).
Resource and Sustainability Barriers
1) Biomass feedstock will ultimately be limited by finite amounts of land and water
2) Biomass production may not be sustainable because of impacts on soil compaction, erosion, carbon, and nutrition.
3) Nor is it clear that perennial energy crops are sustainable, since not enough is known about their water and fertilizer needs, harvesting impacts on the soil, etc.
4) Farmers are concerned about the long-term effects on soil, crop productivity, and the return on investment when collecting residues.
5) The effects of biomass feedstock production on water flows and water quality are unknown
6) The risks of impact on biodiversity and public lands haven’t been assessed.
Economic Barriers (or Investors Aren’t Stupid)
1) Biomass can’t compete economically with fossil fuels in transportation, chemicals, or electrical generation.
2) There aren’t any credible data on price, location, quality and quantity of biomass.
3) Genetically-modified energy crops worry investors because they may create risks to native populations of related species and affect the value of the grain.
4) Biomass is inherently more expensive than fossil fuel refineries because
a) Biomass is of such low density that it can’t be transported over large distances economically. Yet analysis has shown that biorefineries need to be large to be economically attractive – it will be difficult to find enough biomass close to the refinery to be delivered economically.
b) Biomass feedstock amounts are unpredictable since unknown quantities will be lost to extreme weather, sold to non-biofuel businesses, rot or combust in storage, or by used by farmers to improve their soil.
c) Ethanol can’t be delivered in pipelines due to likely water contamination. Delivery by truck, barge, and rail is more expensive. Ethanol is a hazardous commodity which adds to its transportation cost and handling.
d) Biomass varies so widely in physical and chemical composition, size, shape, moisture levels, and density that it’s difficult and expensive to supply, store, and process.
e) The capital and operating costs are high to bale, stack, palletize, and transport residues
f) Biomass is more geographically dispersed, and in much more ecologically sensitive areas than fossil resources.
g) The synthesis gas produced has potentially higher levels of tars and particulates than fossil fuels.
h) Biomass plants can’t benefit from the same large-scale cost savings of oil refineries because biomass is too dispersed and of low density.
5) Consumers won’t buy ethanol because it costs more than gasoline and contains 34% less energy per gallon. Consumer reports wrote they got the lowest fuel mileage in recent years from ethanol due to its low energy content compared to gasoline, effectively making ethanol $3.99 per gallon. Worse yet, automakers are getting fuel-economy credits for every E85 burning vehicle they sell, which lowers the overall mileage of auto fleets, which increases the amount of oil used and lessens energy independence. (Consumer Reports)
Equipment and Storage Barriers
1) There are no harvesting machines to harvest the wide range of residue from different crops, or to selectively harvest components of corn stover.
2) Current biomass harvesting and collection methods can’t handle the many millions of tons of biomass that need to be collected.
3) How to store huge amounts of dry biomass hasn’t been figured out.
4) No one knows how to store and handle vast quantities of different kinds of wet biomass. You can lose it all since it’s prone to spoiling, rotting, and spontaneous combustion
Preprocessing Barriers
1) We don’t even know what the optimum properties of biomass to produce biofuels are, let alone have instruments to measure these unknown qualities.
2) Incoming biomass has impurities that have to be gotten out before grinding, compacting, and blending, or you may damage equipment and foul chemical and biological processes downstream.
3) Harvest season for crops can be so short that it will be difficult to find the time to harvest cellulosic biomass and pre-process and store a year of feedstock stably.
4) Cellulosic biomass needs to be pretreated so that it’s easier for enzymes to break down. Biomass has evolved for hundreds of millions of years to avoid chemical and biological degradation. How to overcome this reluctance isn’t well enough understood yet to design efficient and cost-effective pre-treatments.
5) Pretreatment reactors are made of expensive materials to resist acid and alkalis at high temperatures for long periods. Cheaper reactors or low acid/alkali biomass is needed.
6) To create value added products, ways to biologically, chemically, and mechanically split components off (fractionate) need to be figured out.
7) Corn mash needs to be thoroughly sterilized before microorganisms are added, or a bad batch may ensue. Bad batches pollute waterways if improperly disposed of. (Patzek Dec 2006).
Cellulosic Ethanol Showstoppers
1) The enzymes used in cellulosic biomass production are too expensive.
2) An enzyme that breaks down cellulose must be found that isn’t disabled by high heat or ethanol and other end-products, and other low cost enzymes for specific tasks in other processes are needed.
3) If these enzymes are found, then cheap methods to remove the impurities generated are needed. Impurities like acids, phenols, alkalis, and salts inhibit fermentation and can poison chemical catalysts.
4) Catalysts for hydrogenation, hydrgenolysis, dehydration, upgrading pyrolysis oils, and oxidation steps are essential to succeeding in producing chemicals, materials, and transportation fuels. These catalysts must be cheap, long-lasting, work well in fouled environments, and be 90% selective.
5) Ethanol production needs major improvements in finding robust organisms that utilize all sugars efficiently in impure environments.
6) Key to making the process economic are cheap, efficient fermentation organisms that can produce chemicals and materials. Wald writes that the bacteria scientists are trying to tame come from the guts of termites, and they’re much harder to domesticate than yeast was. Nor have we yet convinced “them to multiply inside the unfamiliar confines of a 2,000-gallon stainless-steel tank” or “control their activity in the industrial-scale quantities needed” (Wald 2007).
7) Efficient aerobic fermentation organisms to lower capital fermentation costs.
8) Fermentation organisms that can make 95% pure fermentation products.
9) Cheap ways of removing impurities generated in fermentation and other steps are essential since the costs now are far too high.
What could be done?
According to Catherine Kling, head of the Resource and Environmental Policy Division of the Center for Agricultural and Rural Development at Iowa State University, “A large part of the problem with runoff of nitrogen (and soil) is because corn is known as a “leaky crop” since nutrients inevitably leak out because the land is bare half of each year. “Farmers could plant cover crops so that the land is not bare for 6 months. They could change how they till. Or wetlands could be created carefully and strategically in a watershed so that they would capture the nutrients coming off the fields and process them before they move down to rivers and streams. “There are bioreactors. There are tile drains. There are a number of different things that can be done.” But none of these things is done, she noted. She suggested that nothing is done because it is costly and there is no reason for an individual producer to do it. The externality is not priced. There are few regulations or requirements, and hence there is the predictable situation where too many nutrients are coming off this land. Experts believe that a 40 to 50 percent reduction in nutrients will be needed to achieve reductions in the hypoxic zone, and this would require not just one or two changes being made, Kling said, but rather widespread adoption of multiple practices. “We’d need a major change in what that landscape looks like.” (Institute of Medicine 2014).
Don’t hold your breath. Farmers have known what to do for decades — textbooks on soil conservation go back for 80 years — but the Free market and Capitalism are all about maximizing profits NOW, and screw the children, grandchildren, and 100 billion people that will be born in the future.
Biofuels are a scam
Bryce, R. February 16, 2016. The failed promise of biofuels. Dallas News.
Fehrenbacher, K. December 15, 2015. A Biofuel dream gone bad. Legendary venture capitalist Vinod Khosla backed a startup called KiOR as part of his ambitious push for green energy. Now KiOR is bankrupt, he and company executives are being sued for fraud, and Khosla’s big biofuel bet is looking increasingly questionable.Fortune Magazine.
Stahl, Lesley, January 5, 2014. The Cleantech Crash. Despite billions invested by the U.S. government in so-called “Cleantech” energy, Washington and Silicon Valley have little to show for it. 60 minutes.
References (most important in bold)
Al-Kaisi, Mahdi. July 24, 2000. Soil Erosion: An agricultural production challenge. Integrated Crop Management. Iowa State University.
Al-Kaisi, Mahdi. 2001. Impact of Tillage and Crop Rotation Systems on Soil Carbon Sequestration. Iowa State University.
Al-Kaisi, Mahdi. May 2001. Soil Erosion, Crop Productivity and Cultural Practices. Iowa State Univ.
Andrews, S. Feb 22, 2006. Crop Residue Removal for Biomass Energy Production: Effects on Soils and Recommendations. USDA-Natural Resource Conservation Service.
AP. October 6, 2015. Parts sold from KiOR biofuel plant that owes Mississippi $79M. Associated Press.
Atchison, J. et al. 2004. Innovative methods for corn stover collecting, handling, storing and transporting. NREL.
Badger, P. 2002. Processing Cost Analysis for Biomass Feedstocks. DOE/ EERE.
Bain, R.; Amos, W. March 2003. Biopower Technical Assessment: State of the Industry and Technology. National Renewable Energy Laboratory NREL/TP-510-33123
Ball, B. C. et al. 2005. The role of crop rotations in determining soil structure and crop growth conditions. Canadian Journal of Soil Science 85(5):557-577.
Barrionuevo, A. 8 Oct 2006. A Bet on Ethanol, With a Convert at the Helm. New York Times.
Barrionuevo, A. 23 Jan 2007. The Energy Challenge. Springtime for Ethanol. New York Times.
Barta, P. et al. Dec 5, 2006. As Alternative Energy Heats Up, Environmental Concerns Grow. Crop of Renewable ‘Biofuels’ Could Have Drawbacks. Wall Street Journal.
Benemann, J; Augenstein, D. August 16, 2006. Whither Cellulosic Ethanol? The Oil Drum.
Benton, M. 2003. When Life Nearly Died. The greatest mass extinction of all time. Thames & Hudson.
Birger, J. Oct 31, 2006, McCain’s farm flip. The senator has been a critic of ethanol. That doesn’t play in Iowa. So the Straight Talk Express has taken a detour. Fortune.
Birrell, S. et al. 2006. Biomass Harvesting, Transportation and Logistics. Growing the Bioeconomy conference. Iowa State University.
Blanco-Canqui, H.; et al. 2006. Rapid Changes in Soil Carbon and structural properties due to stover removal from no-till corn plots. Soil Science. Volume 171(6) 468-482.
BOA (Board on Agriculture). 1986. Soil Conservation: An Assessment of the National Resources Inventory, Volume 2. National Academies Press.
Borgman, D. 4 Jan 2007. John Deere bio-fuels white paper. Agriculture, bio-fuels and striving for greater energy independence. John Deere Company.
Bright, C. 1998. Life Out of Bounds. Bioinvasion in a Borderless World. W.W.Norton.
Brody, S. 1945. Bioenergetics and Growth. Reinhold Publications, page 1023.
Bucknell III, H. 1981. Energy and the National Defense. University Press of Kentucky.
Calviño, V; et al. 2003. Corn Maize Yield as Affected by Water Availability, Soil Depth, and Crop Management. Agronomy Journal 95:275–281
Clayton, Mark. 23 Mar 2006. Carbon cloud over a green fuel. An Iowa corn refinery, open since December, uses 300 tons of coal a day to make ethanol. Christian Science Monitor.
Consumer Reports. Oct 2006. The ethanol myth: Consumer Reports’ E85 tests show that you’ll get cleaner emissions but poorer fuel economy … if you can find it.
Crawford, D. Feb 2006. Natural gas has eight years left. Republic News..
Cruse, R. et al. 2006. Water Quality and Water Quantity Are they significant issues in the bioeconomy? Growing the Bioeconomy conference. IowaStateUniversity.
Deluca, T. 23 June 2006. Letters. Science, Vol 312 p 1743-1744.
Déry, P., et al. 2007. Peak Phosphorus, Energy Bulletin (now resilience.org).
Diamond, J. 2004. Collapse: How Societies Choose to Fail or Succeed. Viking.
Dias De Oliveira, M. et al. July 2005. Ethanol as Fuel: Energy, Carbon Dioxide Balances, andEcological Footprint. BioScience 55, 593.
DOE Billion Ton Vision. April 2005. Biomass as feedstock for a Bioenergy and Bioproducts Industry: The technical feasibility of a billion-ton annual supply. USDA.
DOE 1980. Standby Gasoline Rationing Plan. U.S. Department of Energy Economic Regulatory Administration Office of Regulations and Emergency Planning
DOE Biomass Plan. 31 Aug 2005. Multi Year Program Plan 2007-2012. U.S. Department of Energy.
Office of the Biomass Program. Energy Efficiency and Renewable Energy.
DOE Feedstock Roadmap. Nov 2003. Roadmap for Agriculture Biomass Feedstock Supply in the United States. DOE Office of Energy Efficiency & Renewable Energy Biomass Program.
Dukes, J.S. 2003. Burning buried sunshine: human consumption of ancient solar energy. Climatic Change, 61(1-2): 31-44.
Egan, T. 2006. The Worst Hard Time: The Untold Story of Those Who Survived the Great American Dust Bowl (Mariner, New York).
ERS (Economic Research Service). 1999. Conservation on Rented Farmland: A Focus on U.S. Corn Production. Agricultural Outlook/Jan-Feb. USDA.
EWG. April 2011. Losing Ground. Environmental Working Group.
Fierer, N., et al. 2013. Reconstructing the Microbial Diversity and Function of Pre-Agricultural Tallgrass Prairie Soils in the United States. Science 342, 621.
FAO. 2004. Crop Water Information. Food and Agriculture Organization of the United Nations.
Farrell, et. al. Jan 27, 2006. Ethanol Can Contribute to Energy and Environmental Goals. Science Vol 311 506-508.
Feinstein, D. 2003. Senator Feinstein Offers Amendment to Give States Ability to Choose Whether they Participate in the Ethanol Program.
Fingerman, K; Kammen, D, et al. Integrating Water Sustainability into the Low Carbon Fuel Standard. University of California, Berkeley
Fisher, D. et al. Apr 2001. The Nitrogen Bomb. Discover magazine.
Franzleubbers, A. J.; et al. 2006. Agricultural Exhaust: A Reason to Invest in Soil. Journal of Soil and Water Conservation. Vol.61-3; 98-101
Gerard, Jack. 2006. Annual Meeting American Chemistry Council, Louisiana Chemical Industry Alliance
Giampietro, M. et al. 1997. Feasibility of large-scale biofuel production. BioScience 47(9): 587-600.
Giller, K. E., et al. 1997. Agricultural intensification, soil biodiversity and agroecosystem function. Appl. Soil Ecol. 6, 3.
Glennon, R. 2002. Water Follies. Groundwater Pumping and the Fate of America’s Fresh Waters. Island Press.
Grandy, A. S.; et al. 2006 Do Productivity and Environmental Trade-offs Justify Periodically Cultivating No-till Cropping Systems? Agronomy Journa.98:1377–1383.
Hall, C, et al. 20 Nov 2003. Hydrocarbons and the Evolution of Human Culture. Nature 426:318–22.
Hall, C.A.S., Dale, B.E., Pimentel, D. 2011. Seeking to Understand the Reasons for Different Energy Return on Investment (EROI) Estimates for Biofuels. Sustainability 3,:2413-2432.
Haney, D. 2006. Emerging Trends: Transportation Needs for Biofuels, Bioproducts, and the Bioeconomy. Biobased Industry Outlook Conference. Ames, Iowa.
Harte, John. Professor of Energy and Resources, UC Berkeley. Private communication.
Heller, M. et al. 2000. Life-Cycle Based Sustainability Indicators for Assessment of the U.S. Food System. University of Michigan.
Hemenway, T. 2000. Gaia’s Garden. Chelsea Green.
Hightower, J. 1978. Hard Tomatoes, Hard Times: A report of the Agribusiness Accountability Project on the Failure of America‘s LandGrantCollege Complex. Schenkman Books.
Hirsch, R. 2005. Peaking of World Oil Production: Impacts, Mitigation, & Risk Management. DOE NETL.
Houghton RA, et al. 2009. Importance of biomass in the global carbon cycle. J Geophys Res 114.
Howarth, R. et al. 2009. Biofuels. Environmental consequences and interactions with changing land use. Cornell University.
Huber, P. 10 Apr 2006. The Forest Killers. Forbes.
Institute of Medicine. The Nexus of Biofuels, Climate Change, and Human Health: Workshop Summary. Washington, DC: The National Academies Press, 2014.
Jackson, W et al. 1980. Impacts on the Land in the New Age of Limits. Land report #9:20.
Jacobson, Mark. May 9, 2006. Addressing Global Warming, Air Pollution Health Damage, and Long-Term Energy Needs Simultaneously. Dept of Civil & Environmental Engineering, Stanford University.
John Deere. 2006. Biodiesel fuel in John Deer Tractors. Services and Support.
Johnson, J; et al. 2004. Characterization of Soil Amended with the By-Product of Corn Stover Fermentation. Soil Sci. Soc. Am. J. 68:139–147.
Johnson. J.M.F, et al. 2005. Greenhouse gas contributions and mitigation potential of agriculture in the central USA. Soil and Tillage Research 83:73-94.
Johnson, J. D. et al. 2006. A matter of balance: Conservation & renewable energy. J. Soil Water Cons. 61:120A-125A.
Jones, T. Oct 2006. The Scoop On Dirt Why We Should all Worship the Ground We Walk On. Emagazine.com
Jordan, J. et al. 2 Jul 2006. The False Hope of Biofuels. For Energy and Environmental Reasons, Ethanol Will Never Replace Gasoline. Washington Post.
Karlen, D. 2006. Crop Rotation Effects on Soil Quality at Three Northern Corn/Soybean Belt Locations. Agronomy Journal 98: 484–495.
Kirschenmann, F. 6 Feb 2007. Potential for a New Generation of Biodiversity in Agroecosystems of the Future. Agron J 99:373-376
Klee, G. 1991. Conservation of Natural Resources. Prentice Hall.
Krieger, K. April 24, 2014. Biofuels heat up. Nature 508:448-449.
Lal, R. 1995. Erosion-crop Productivity relationships for soils of Africa. Soil Sci. Soc. Am. J. 59, 661.
Lal, R. 1998. Soil erosion impact on agronomic productivity and environmental quality. Critical Reviews in Plant Sciences, 17: 319-464.
Lal, R. 11 June 2004. Soil Carbon Sequestration Impacts on Global Climate Change and Food Security. Science Vol 304: 1623-1626
Lavelle, M. 4 Feb 2007. Is Ethanol the Answer? Politically it’s a winner. But experts aren’t sure ethanol can deliver on its promise. U.S. News & World Report.
Laskawy, T. May 2, 2012. Do the feds care about antibiotics in animal feed?. Grist.
Laskawy, T. October 29, 2012. Three reasons to have a cow over antibiotics in your meat. Grist.
Lee, J.L. et al. 1996. Sensitivity of the USCorn Belt to climate change and elevated CO2: II. Soil erosion and organic carbon. Agric. Systems 52: 503–521.
Lilley, Sasha. 1 Jun 2006. Green Fuel’s Dirty Secret. Corpwatch.com
Liska, Adam J. et al. 2014. Biofuels from crop residue can reduce soil carbon and increase CO2 emissions. Nature Climate Change
Lowdermilk, W. 1948. Conquest of the Land through Seven Thousand years. USDA-SCS.
Luoma J. 1999. The Hidden Forest. The biography of an ecosystem. Henry Holt.
Lynas, M. 2007. Six Degrees: Our Future on a Hotter Planet. HarperCollins.
Mann, L., et al. 2002. Potential environmental effects of corn (Zea mays L.) stover removal with emphasis on soil organic matter and erosion.Agriculture, Ecosystems and Environment, 89: 149-166.
McAloon, A et al. Oct 2000. Determining the cost of producing ethanol from cornstarch and lignocellulosic feedstocks. NREL.
McCain, John. November 2003. Statement of Senator McCain on the Energy Bill: Press Release.
McKenna, M. April 10, 2012. Antibiotics in Ethanol Grains: Glass half-empty or half-full? Wired.
Meadows, D. et al. 2004. The Limits to Growth: The 30 year update. Chelsea Green.
Miranowski, J. Feb 1984. Impacts of Productivity Loss on Crop Production and Management in a Dynamic Economic Model. American Journal of Agricultural Economics, Vol. 66/#1:61-71.
Monbiot, George. 6 Dec 2005. The most destructive crop on earth is no solution to the energy crisis. The Guardian.
Monbiot, G. March 25, 2015. We’re treating soil like dirt. It’s a fatal mistake, as our lives depend on it. War, pestilence, even climate change, are trifles by comparison. Destroy the soil and we all starve. The Guardian.
Montenegro, M. 4 Dec 2006. The Big Three. The numbers behind ethanol, cellulosic ethanol, and biodiesel in the U.S. Grist.
Montgomery, D. R.. 2007. Dirt: The Erosion of Civilizations. University of California Press.
NAS 2009. America’s Energy Future: Technology and Transformation. 2009. National Academy of Sciences, National Research Council, National Academy of Engineering.
Needelman, B. A., et al. 2013. What are soils? Nature.
Nelson, R.G. 2002. Resource assessment and removal analysis for corn stover and wheat straw in the Eastern and Midwestern United States – rainfall and wind-induced soil erosion methodology. Biomass and Bioenergy 22: 349-363.
Neumann, E. February 4, 2015. Not So Fast: At UC Berkeley, Biofuel Research Takes Hit as BP Oil Company Backs Away. University of California, Berkeley, CalAlumni association.
NRCS (National Resources Conservation Service). Apr 2004. National Resources Inventory 2002. USDA
NRCS. 2006. Conservation Resource Brief. Feb 2006. Soil Erosion. USDA, Natural Resources Conservation Service. Land use.
NRCS. September 2013. Summary report 2010 national resources inventory. Natural Resources Conservation Service.
Odum, Howard T. 1996. Environmental Accounting. EMERGY and Environmental Decision Making. John Wiley & Sons.
Olmstead, J. 5 Dec 2006. What About the Land? A look at the impacts of biofuels production, in theU.S. and the world. Grist.
Olmstead, J. May 1, 2012. Bugs in the system: how the FDA fails to regulate antibiotics in ethanol production. IATP.
Olson, K. et al. 1988. Effects of soil erosion on corn yields of seven Illinois soils. Journal of Production Agriculture. Vol 1, 13-19.
O’Neal, M. et al. 2005. Climate change impacts on soil erosion in MidwestUnited States with changes In crop management. Catena 61:165-184.
Opie, J. 2000. Ogallala: Water for a Dry Land. University of Nebraska Press.
Oxfam. 2001. Going against the Grain.
NAC 2009. America’s Energy Future: Technology and Transformation. 2009. National Academy of Sciences, National Research Council, National Academy of Engineering.
Padgitt, M. et al. Sep 2000. Production practices for major crops in U.S. Agriculture, 1990-97. Resource Economics Division, Economic Research Service, USDA.
Pate, Dennis. June 10, 2004. May Rains Cause Severe Erosion in Iowa. Natural Resources Conservation Service.
Patzek, T. 2005. “The United States of America Meets the Planet Earth“. National Press Club Conference, Washington, D.C.
Patzek, T. The Earth, Energy, and Agriculture. June 2006. Climate Change and the Future of the American West. Boulder, Colorado
Patzek, T. Nov 5, 2006. Why cellulosic ethanol will not save us. Venturebeat.com
Patzek, T. 26 Jun 2006. “The Real Biofuel Cycles,” Letter to Science, Science and “The Real Biofuel Cycles,” Online Supporting Material to Science 312).
Patzek, T. Dec 2006. A Statistical Analysis of the Theoretical Yield of Ethanol from Corn Starch. Natural Resources Research, Vol 15/4.
Pearce, F. 2013. The Land Grabbers: The New Fight over Who Owns the Earth. Beacon Press.
Pennisi, E. 2004. The Secret Life of Fungi. Science. Vol 304:1620-1623
Perlack, R., et al. 2002. Assessment of options for the collection, handling, and transport of corn stover. U.S. DOE, EERE.
Perlin, J. 1991. A Forest Journey: The Role of Wood in the Development of Civilization. HarvardUniversity Press
Pimentel, D. 1995. Environmental and Economic Costs of Soil Erosion and Conservation Benefits. Science. Vol 267. 1117-1123.
Pimentel, D., Kounang, N. 1998. Ecology of Soil Erosion in Ecosystems. Ecosystem 1: 416-426.
Pimentel, D. et al. 1991. Land, Energy, and Water. The Constraints Governing Ideal U.S. Population Size. Negative Population Growth
Pimentel D. 2003. Ethanol fuels: Energy balance, economics and environmental impacts are negative. Natural Resources Research. 12:127–134.
Pimentel, D. et al. March 2005. Ethanol Production Using Corn, Switchgrass, and Wood; Biodiesel Production Using Soybean and Sunflower. Natural Resources Research, Vol 14:1
Pimentel, David. Feb 2006. Soil Erosion: A Food and Environmental Threat. Journal Environment, Development and Sustainability. Volume 8, Number 1, 119-137
Pimentel, D. et al. Nov 2006. Editorial: Green Plants, Fossil Fuels, and Now Biofuels. American Institute of Biological Sciences.
Pimentel, D. 2007. private communication.
Pimentel, D. et al. 2012. Energy production from corn, cellulosic, and algae biomass. In Global Economic and Environmental Aspects of Biofuels; Pimentel, D., Ed.; Taylor & Francis:
Boca Raton, FL, USA.
Pollan, M. 2006. The Omnivore’s Dilemma. Penguin Press.
Ponting, C. 1993. A Green History of the World: The Environment and the Collapse of Great Civilizations. Penguin Books.
Power, J.et al. 1998. Residual effects of crop residues on grain production and selected soil properties. Soil Science Society of America Journal 62: 1393-1397.
Power, J. et al. 1988. Role of crop residue management in nitrogen cycling and use. Cropping Strategies for Efficient Use of Water and Nitrogen. ASA Special Publication 51.
Powers, B, and Berman, A. 2013. Cold, Hungry and in the Dark: Exploding the Natural Gas Supply Myth. New Society Publishers.
Powers, S. May 2005. Quantifying Cradle-to-Farm Gate Life-Cycle Impacts Associated with Fertilizer Used for Corn, Soybean, and Stover Production. NREL.
Raghu, S. et al. 22 Sep 2006. Adding Biofuels to the Invasive Species Fire? Science: 1742
Rapier, R. February 13, 2016. Cellulosic Ethanol Falls A Few Billion Gallons Short. Also see: Rapier, R. May 20, 2015. Where are the Unicorns? Energy trends insider.
Redlin, B. et al. 2007. The 2007 Farm Bill: Stewardship, Prosperity and Fairness. Izaak Walton League
Reynolds, R. Jan 15, 2002. Infrastructure requirements for an expanded fuel ethanol industry. Oak Ridge National Laboratory Ethanol Project.
Reijnders, L. 2006. Conditions for the sustainability of biomass based fuel use. Energy Policy 34:863–876
Richard, T. August 23, 2010. Challenges in scaling up biofuels infrastructure. Science.
Roberts, P. 2004. The End of Oil. Houghton Mifflin.
Rohter, L. Dec 12, 2004. South America Seeks to Fill the World’s Table. New York Times
Rorabaugh, W.J. 1979. The AlcoholicRepublic: An American Tradition. Oxford University Press. 74-89.
Ruth, M. et al. May 4, 2003. The Effect of Corn Stover Composition on Ethanol Process Economics. NREL.
Ruth, M.; et al. 2013. Projected Biomass Utilization for Fuels and Power in a Mature Market. National Renewable Energy Laboratory. 174 pages
Sacramento Bee. April 29, 2007. Editorial: Can’t drink ethanol. Sacramento Bee Forum E6.
Sadras, V. 2001. Quantification of Grain Yield Response to Soil Depth in Soybean, Maize, Sunflower, and Wheat. Agronomy Journal 93:577-583.
Sanchez, P.A. 2002. Soil Fertility and Hunger in Africa. Science 295, 2019
ScienceDaily. Mar 8, 2007. Petroleum Biofuels: An Advisable Strategy? Univ Autonoma de Barcelona.
Sampson, R. 1981. Farmland or Wasteland. A time to choose. Overcoming the threat to America’s farm and food future. Rodale Press.
Schertz, D. et al. 1989. Effect of past soil erosion on crop productivity in Indiana. Journal of Soil and Water Conservation. Vol 44, no 6. 604-608.
Schmidt, M. W. I. et al. 2011. Persistence of soil organic matter as an ecosystem property. Nature 478, 49.
Shapouri, H. et al. 2002. The Energy Balance of Corn Ethanol: an update. USDA Agricultural economic report 813
Sheehan, J. et al. 2003. Energy and Environmental Aspects of Using Corn Stover for Fuel Ethanol. Journal of Industrial Ecology, Vol 7 3-4: 117-146.
Shurson, J., et al. 2003. Value and use of ‘new generation’ distiller’s dried grains with solubles in swine diets. Dept of Animal Science, University of Minnesota, St. Paul, Minnesota. Alltech 19th International Feed Industry Symposioum Proceedings.
Shwartz, M. June 25, 2014. Net energy analysis should become a standard policy tool, Stanford scientists say. Stanford University.
Simkin, S. M. et al. March 2016. Conditional vulnerability of plant diversity to atmospheric nitrogen deposition across the United States. PNAS.
Singer, E. Apr 03, 2007. A Better Biofuel. MIT Technology Review.
Sluiter, A. et al. 2000. Compositional variability among corn stover samples. NREL.
Smil, V. 2004. Enriching the Earth: Fritz Haber, Carl Bosch, and the Transformation of World Food Production. MIT Press.
Smil V. 2013. Harvesting the Biosphere: What We Have Taken from Nature. MIT Press.
Smith, C. 1911. Rotations in the Corn Belt. Yearbook of the Dept of Agriculture.
Smith, P. 2013. How much land-based greenhouse gas mitigation can be achieved without compromising food security and environmental goals? Global Change Biol. 19, 2285.
Sullivan, Preston. May 2004. Sustainable Soil management. Soil Systems Guide. ATTRA.
Sundquist, B. 6 May 2005. Topsoil Loss — Causes, Effects, and Implications: A Global Perspective. The Earth’s Carrying Capacity. Chapter 3
SWCS (Soil and Water Conservation Society). 2003. Conservation implications of climate change: Soil erosion and runoff from cropland. Soil and Water Conservation Society, Ankeny, IA.
Tainter, J. A. 1988. The collapse of complex societies. Cambridge University press.
Tapparo, et. al. 31 Jan 2012. Assessment of the Environmental Exposure of Honeybees to Particulate Matter Containing Neonicotinoid Insecticides Coming from Corn Coated Seeds. Environmental Science & Technology.
Tegtmeier, E, et al. 2004. External Costs of Agricultural Production in the United States. International Journal of Agricultural Sustainability Vol 2/1
Thomas, S. 2003. Causes and effects of variation in corn stover composition. National Renewable Energy Laboratory.
Tilman, D. et al. 8 Dec 2006. Carbon-Negative Biofuels from Low-Input High-Diversity Grassland Biomass. Science. Vol 314 no 5805:1598 – 1600
Tomson, B. 8 Feb 2007. For Ethanol, U.S. May Boost Corn Acreage. Wall Street Journal.
Trenkle, A. 2006. Integration of Animal Agriculture with the Bioeconomy. Department of Animal Science, Iowa State University
Trimble, S. et al. 14 July 2000. U.S. Soil Erosion Rates–Myth and Reality. Science vol 289: 248-250
Troeh, F, et al. 2005. Soils and Soil Fertility, 6th edition. Blackwell Publishing.
Ulgiati, S. 2001. A comprehensive energy and economic assessment of biofuels: When “green” is not enough. Critical Reviews in Plant Sciences 20(1): 71-106.
U.S. Census Bureau. 2000. Annual Projections of the Total Resident Population. Population Division
USDA-ARS. Wind Erosion Research.
USDA ERS (Economic Research Service). Fertilizer Use. U.S. Fertilizer Imports/Exports
USGAO. 2007. Crude oil. Uncertainty about Future Oil Supply Makes It Important to Develop a Strategy for Addressing a Peak and Decline in Oil Production. United States Government Accountability Office.
Vogel, K; et al. 2002. Switchgrass Biomass Production in the MidwestUSA:Harvest and Nitrogen Management. Agronomy Journal 94:413–420.
Walan, P., Davidsson, S., Johansson, S., Höök, M. (2014) Phosphate rock production and depletion: Regional disaggregated modeling and global implications. Resources, Conservation and Recycling, 93: 178-187.
Wall, D.H. and J. Six. February 13, 2015. Give soils their due. Science 347:695.
Wall Street Journal Editorial. Apr 15, 2002. A Stealth Gas Tax. Wall Street Journal.
Wallace, Scott. Jan 2007. Last of the Amazon. National Geographic.
Ward, M. Jan 2007. Is Ethanol for the Long Haul? Scientific American.
Ward, P. 18 Sep 2006. Impact from the Deep. Strangling heat and gases emanating from the earth and sea, not asteroids, most likely caused several ancient mass extinctions. Could the same killer-greenhouse conditions build once again? Scientific American.
Wardle, D. 2004. Ecological linkages between aboveground and belowground biota. Science 304:1629-1633.
Washington Post Editorial. Apr 16, 2002. Ethanol’s Ambitions. Washington Post.
WEC World Economic Forum. December 14, 2012. What If the World’s Soil Runs Out? Time Magazine.
Whitney, G. 1994. From Coastal Wilderness to Fruited Plain. Cambridge University Press.
Wilhelm, W. et al. Jan-Feb 2004. Crop and Soil Productivity Response to Corn Residue Removal:A Literature Review. Agronomy Journal. Vol 96 No 1. 1-17
Williams, J. 2000. Fuel and Famine: Rural Energy Crisis in The Democratic People’s Republic of Korea. IGCC Policy paper, University of California.
Williams, M. 2003. Deforesting the Earth: from prehistory to global crisis. University of Chicago Press.
Wolfe, D. 2001. Tales from the Underground. A Natural History of Subterranean Life. Perseus Publishing.
Wu, L. 1998. Screening Study for Utilizing Feedstocks Grown on CRP Lands in a Biomass to Ethanol Production Facility. National Renewable Energy Laboratory.
WWF (World Wildlife Fund). July 2005. WWF Action for Sustainable Sugar.
Yates, A. et al. 2006. No-till cultivation improves stream ecosystem quality.
Journal of Soil and Water Conservation. Vol 61:1 14-19.
Yacobucci, B. 2006. Fuel Ethanol: Background and Public Policy Issues. CRS Report for Congress.
Youngs, H., and C.R. Somerville. 2013. California’s energy future: the potential for biofuels. California: California Council on Science and Technology.
Acknowledgements:
Many thanks to David Pimentel, Walter Youngquist, and Tad Patzek for their editing and critiques.
Ethanol Statistics United States EIA
Ethanol Production USA Renewable Fuels Association
Biodiesel statistics United States EIA:
| 1. | Biodiesel production capacity and production | XLS | |
| 2. | Biodiesel production, sales, and stocks | XLS | |
| 3. | Inputs to biodiesel production | XLS | |
| 4. | Biodiesel producers and production capacity, by state | XLS | |
| 5. | Biodiesel (B100) production by petroleum administration for defense district | XLS |
Biofuel production & global trade United Nations UNCTAD 2013