[ Picard concludes that “None of the candidate technologies for massive-scale renewable and sustainable generation of ‘‘green’’ electricity deliver it in a form suitable for high-efficiency storage. None of the prospectively-massive storage modes for transformed electricity is at present well enough developed to be designated a sovereign remedy for intermittency. His “current foci are the theory of heat exchangers upon which thermal storage depends and underground pumped hydro, the only electro-technology that currently seems scalable to the multi-terawatt-day levels needed”.
Alice Friedemann www.energyskeptic.com author of “When Trucks Stop Running: Energy and the Future of Transportation”, 2015, Springer and “Crunch! Whole Grain Artisan Chips and Crackers”]
Picard, W.F. August 28, 2015. Massive Electricity Storage for a Developed Economy of Ten Billion People. IEEE Access.
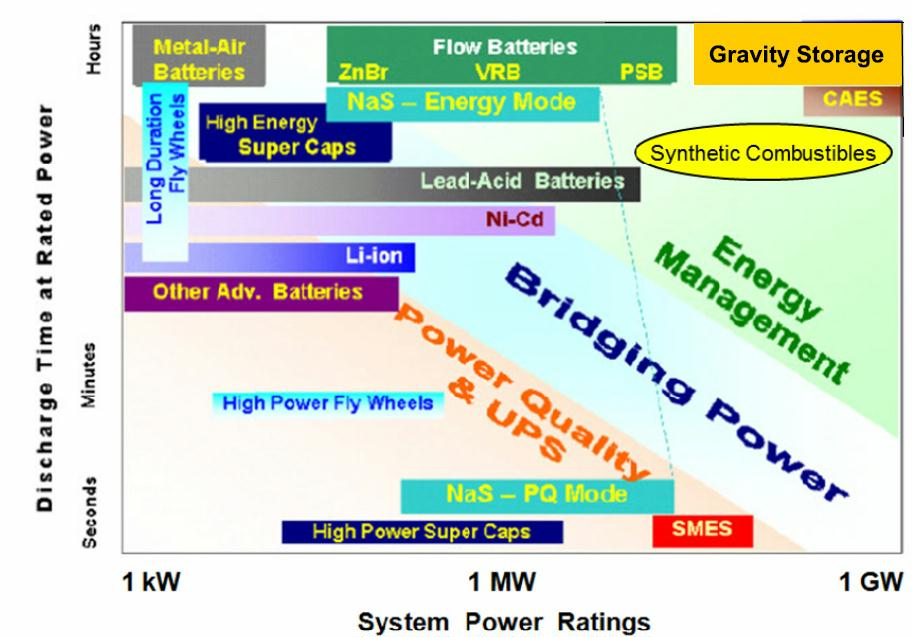
FIGURE 3. Ragone diagram of the discharge time at rated power (a factor in energy storage) vs. system power rating for a number of different electricity storage technologies; it is similar to many others that can be found on the Web. This one, ascribed to Nobelist Steven Chu and available at http://energy.wesrch.com/wiki-511-energy-storage-is-critical-to-grid-operations, has been augmented to include: (i) gravity storage; and (ii) stable synthetic chemicals (e.g., hydrogen gas, methane, or ammonia) that can be manipulated to produce mechanical energy. The maximum rates of charging and discharging of a storage module need not necessarily be the same.
Excerpts from this 16 page paper:
ABSTRACT Presently, America’s average electrical power consumption is~1.3 kW/p; in the world as a whole, it is~0.33 kW/p. If, for 2050, a world goal of 1 kW/p is adopted, this implies an average electric power draw of 1 GW for each population cohort of 1,000,000 residents; and the Earth will have ~10,000 such cohorts. Multi-hour outages are already common; demand peaks daily; and renewable generation is intermittent. Hence, as a hedge against rare supply failures, each cohort would profit from local backup storage of electricity/energy in the order of 1–2 GWd. For comparison, the biggest electrochemical storage scheme yet seriously proposed will contain~240 MWh, while most of the largest pumped hydro storage reservoirs are <50 GWh. In approximately 50 years, when fossil fuels have become scarce, we should already have constructed this bulk storage. This review argues that the principal contenders for the storage of electricity in bulk are: 1) electrochemical storage in flow batteries; 2) chemical storage in agents, such as ammonia, hydrogen, methanol, or light hydrocarbons; 3) compressed air energy storage; and 4) underground pumped hydro. Finally, it will argue that not one of these four contenders has yet been built, tested, and perfected, while virtually none of the needed storage capacity exists today.
INTRODUCTION
Mankind is on a trajectory towards exhaustion of our planet’s supply of economically recoverable fossil fuels [1].
When that inevitable exhaustion has been accomplished, whatever electrical energy is consumed by our civilization must be derived from renewables or (possibly) nuclear.
And that means we risk losing the convenient electricity-on-demand to which we have become accustomed — unless, of course, we have had the foresight to build massive electricity storage sufficient to buffer the variations of supply and demand, accumulating energy during times of abundance and disbursing it during times of scarcity [2]–[4].
The term ‘massive electricity storage’ is vague because ‘massive’ has no agreed upon definition. In the context of this paper, it will be defined as ‘at least one gigawatt-day [GWd]’. This follows from the projection that, in 2050, the planet we be home to approximately 10 billion persons, each seeking a lifestyle undergirded by approximately 1 kilowatt of reliable electricity. Therefore, a typical geographical enclave of a million persons should desire at least 1 GWd of backup electricity storage sited locally because (i) the modern world doesn’t operate without electricity and (ii) backup a few hundred kilometers away is not very helpful if the grid fragments.
Recent models of intermittent renewable generation seem uniformly to recognize a necessity for at least some form of electricity storage [2]–[4]. The type and quantity of such storage is open to debate. Massive electricity storage for ten billion people in the latter half of this century is a task so far outside the historical experience of humanity that even conservative estimates of how much of it will be desired, are daunting.
Nobody knows how many people will be on Earth in 2050; but the best estimate of the United Nations was 8.9 to 10.6 billion [22]; more recent studies have modestly increased these estimates [23]. Therefore, it will be assumed that, in 2050, the population of earth will be roughly 10 billion people.
Ten billion consumers could require an average generation of ~10 TW : this is roughly ten-fold the current nameplate capacity of America’s generators.
To meet such a demand will require a global electricity production of ~87,600 TWh a year. If these electrical joules are to be derived from fossil fuel combustion in typical steam plants, then – due to Carnot inefficiencies – more thermal primary energy will be needed:~160 billion barrels per year of petroleum ([25], or ~34 billion metric tonnes of coal per year [26], or ~2,7000,000,000,000 standard cubic meters per year of natural gas [26]; alternatively, this amounts to ~24,000,000,000 tonnes of oil equivalent.11
These figures are far in excess of the World’s current annual production in metric tons of oil equivalent [9] of oil (~4.2 billion), coal (~3.5 billion toe), or natural gas (~2.7 billion).
And this is to provide in 2050 just the electricity for a world that is based on today’s technology but has eliminated electricity poverty, a world in which the Haves and the Have-Nots cannot be readily identified on the basis of per capita electricity consumption: energy generation for transportation or process heating, which today proceeds largely without electrical intermediate steps, is not included [11]
As the fossil fuels bequeathed mankind are used up the demand for renewable energy and its associated storage solutions will markedly exceed that which arises from electricity use.
Ten billion consumers could require an average generation of~10 TW : this is roughly ten-fold the current nameplate capacity of America’s generators. To meet such a demand will require a global electricity production of ~87600 TWh y-1 or~320×1018 Je y-1. If these electrical joules are to be derived from fossil fuel combustion in typical steam plants, then – due to Carnot inefficiencies – more thermal primary energy will be needed:~1000×1018 Jth y-1, or ~160×109 barrels per year of petroleum ([25], s. 45K(d)(5)), or~34×109 metric tonnes per year of coal [26], or~27×1012 standard cubic meters per year of natural gas [26]; alternatively, this amounts to ~24×109 toe (tonne of oil equivalent).11 These figures are far in excess of the World’s current annual production [9] of oil (~4.2×10⁹ toe), coal (~3.5×10⁹ toe), or natural gas (~2.7×10⁹ toe). And this is to provide in 2050 just the electricity for a world that is based on today’s technology but has eliminated electricity poverty, a world in which the Haves and the Have-Nots can not be readily identified on the basis of per capita electricity consumption: energy generation for transportation or process heating, which today proceeds largely without electrical intermediate steps, is not 11 Often it is hard to translate joules into the non-metric units employed in practical energy calculations. The ‘‘barrel of oil equivalent’’ or ‘‘boe’’ is defined by the U.S. Internal Revenue Service as precisely 5.8 million Btu [25], which – employing thermochemical calories – yields the SI equivalence~6.115 GJ per boe; the Reader is cautioned that this value is nominal only and that the actual caloric content of a particular barrel may vary by a few percent from this defined equivalence [9]. The ‘‘tonne of coal equivalent’’ or ‘‘TCE’’ is defined nominally as 7E09 calories [26], here taken to be thermochemical calories; and thus, 1 TCE= 29.288 GJ, although considerable variation is to be expected from coal seam to coal seam ([9, p. 59]). The natural gas is traditionally measured in ‘‘standard cubic feet’’ for which a nominal caloric equivalent is 1000 Btu per cubic foot, which translates into~37.24 MJ per cubic meter; once again, there is considerable variation from gas field to gas field ([9, p. 60]). Alternatively, the energy content of any source of fossil fuel can be measured in terms of: 1 metric tonne of oil equivalent= 1 toe= 10E09 thermochemical calories=~ 41.84 GJ
In addition to assuring an adequate supply of electrical energy, the world of 2050 must, if it is to be sustainable, also assure a sustainable supply of mineral resources. This task is predicted to be, with much much effort, tractable: but only if the sustainable energy hurdle has already been successfully jumped [30], [31].
WORLD RESOURCES OF FOSSIL FUEL. Since the Pearl Street generating station came on line in 1882, developed economies have enjoyed the benefits of massive energy storage. This has always been visible as the coal pile behind the generating station, and almost no utility customers ever remarked upon this because they never connected the dots. Today that fossil fuel is rapidly being depleted and is forecasted to be nearly gone and rather costly within a few decades [1], [32], [33].
ULTIMATELY RECOVERABLE RESOURCES. With respect to a particular nonrenewable substance, the ultimately recoverable resource is ‘‘an estimate of the total amount of [that substance] that will ever be recovered and produced. It is a subjective estimate in the face of only partial information.’’ [34]. Moreover, the estimated URR is subject to revision as the economic worth of the substance varies and as the technologies of extraction change. Nevertheless, there are two useful rules of thumb: (i) when resource depletion becomes so marked that the processes of extracting the substance costs more money than will be received when the substance is marketed, the substance ceases to be recoverable; and (ii), when the substance is a fossil fuel and a deposit becomes so lean that the energy stored in the substance is less than the energy expended extracting the substance, then the substance likewise ceases to be recoverable. Useful subsets of the URR are [34]: (i) proved reserves, the subset that is still recoverable with 90% probability; (ii) probable reserves, the subset that is still recoverable with 50% probability; and (iii) ) possible reserves, the subset that is still recoverable with 20% probability.
Whenever a substance is nonrenewable and mankind is consuming it at a rate that will soon exhaust the URR, mankind is facing a crisis.
COAL IS RUNNING OUT. The October 2013 prediction from Professor David Rutledge of the California Institute of Technology is that 90% of the World’s economically recoverable coal will have been recovered by 2067 [35]. Because his quantitative methodology has been so successful in modeling the exhaustion of already depleted coal fields, his date of 2067 should be taken seriously. Moreover, quantitatively similar predictions abound [1], [36]–[40].
The URR of coal has been estimated by several different authors. Mohr and Evans [36] predicted a URR of 700-1243 Gt. Höök et al. ([38, Table 4]) predicted~1000 Gt.
Rutledge [41] predicted 653-749 Gt. These predictions average out at around 860 Gt.
PETROLEUM IS RUNNING OUT. First, recent studies predict that oil resources also are being depleted and will, by the end of this century, be sharply diminished [1], [32], [40], [42]–[44]. Second, ‘‘From the beginning it was plain that only a finite amount of oil was in the ground and that no level of production, however low, could be maintained indefinitely. But as long as oil was being discovered faster than it was being produced, this limitation was a matter of only vague concern.’’ ([45, p.648]). Petroleum discovery, though complex, does seem to follow certain simple rules: (i) most of the petroleum in a region is contained in a few large fields [45]; (ii) when a region is explored, its large fields are discovered early [45]; (iii) giant oil fields (URR above 0.5 Gbbl) are responsible for~60% of world production [46]; (iv) in recent decades the discovery of giant fields has fallen precipitously [46]; and (v) for the past thirty or so years the consumption of oil has exceeded the discovery of new reserves ([47, Fig. 5.10]).
The data analyses of Brecha [44] suggest an estimate range of 2-3 Tbbl for ultimate planetary petroleum production. Therefore, for Fermi calculations, a reasonable URR value for Fermi calculations could be 2.5 Tbbl.
NATURAL GAS IS RUNNING OUT. Natural gas, oil, and tar sands are different end points achieved by the same basic geological processes ([32, Ch. 4): just as oil is a finite resource that is running out, the same is to be expected of natural gas – although its timeline may be modestly different ([1, Fig. 5]).
THE SIZE OF THE PLANET’S DOWRY OF FOSSIL FUEL. Fermi estimates of the planet’s RRR of fossil fuels are provided in Table 2. It seems clear that, if the World’s developing economies are to achieve Human Development Indices characteristic of present OECD economies, fresh energy supplies must be developed. Even if the projections of Table 2 are off by a factor of as much as three, the situation is still dire. For remember that Table 2 considers only the energy needs of traditional electricity generation: the demands of process heating in industry and the demands of transportation were not included.
A World Economy based upon energy from exhaustible fossil fuels therefore faces a triple whammy: (i) World population is growing; (ii) within developing economies, expectations and consumption are growing; and (iii), as a result of production and consumption, the resource bases themselves are shrinking rapidly. These trends combine to expand global demand for the benefits of fossil fuels while simultaneously diminishing mankind’s dowry of those fuels: what appears today to be an ample reserve can become depleted with startling rapidity.
RENEWABLE ENERGY AND ITS CHALLENGES. On no timescale relevant to human evolution is renewal of our rapidly depleting fossil fuels resource a rational possibility: when what we now have is used up, it is gone forever [32].
Fissile nuclei are a finite resource, even though their supply can (in principle) be extended by neutron irradiation of rather more common fertile but non-fissile nuclei. The ultimately recoverable resource (URR) of naturally occurring fissile nuclei is a matter of debate, as is the case with the better studied fossil fuels [40]. The supply of fertile nuclei (e.g., 232Th and 238U) is very large so that (in principle) ‘‘breeding’’ of fissile nuclei by irradiating fertile nuclei with neutrons could supply many thousands of years of fissile material. A significant impediment to a nuclear fission solution is that safe and profitable breeding has yet to be well-demonstrated, despite decades of off-again on-again research activity. A major downside to fission power is the generation of large quantities of radioactive waste that must be somehow be permanently and safely disposed of; and nigh seventy years into the ‘‘atomic era’’ this problem has not demonstrably and unequivocally been solved [51].
Nuclei for use in fusion reactors are much more abundant, but profitable fusion reactors have neither (i) been built nor (ii) been operated safely and for extended periods; moreover, they too should generate long-lived radioactive waste. In summary, there is widespread doubt that anthropogenically generated nuclear-based power can meet the World’s electricity needs [8], [52]–[56].
If a nuclear reactor of some sort is not a realistic source of sustainable power, then one must fall back upon the renewables. Two eminently readable treatises on renewable/sustainable energy are those of Armaroli and Balzani [57] and of MacKay [58]; the latter is notable for its dedication (p. vii) ‘‘to those who will not have the benefit of two billion years’ accumulated energy reserves’’. For readers in a hurry, the review article by Abbott ([59, pp. 48–52]) provides a compact no-nonsense summary of the relevant numbers: solar radiation and wind, both conspicuously intermittent generators of electricity, are the obvious hegemonic sources; and the others are anticipated to be niche players only.
MATCHING SUPPLY AND DEMAND: THE ACHILLES’ HEEL IS MASSIVE ELECTRICITY STORAGE. Early in the Twentieth Century, the celebrated radio pioneer Reginald Fessenden pithily described the challenge of electricity storage [60]: ‘‘ The problem of the commercial utilization, for the production of power, of the energy of solar radiation, the wind and other intermittent natural sources is a double one. The energy of the sources must first be changed so as to be suitable in form; it must next be stored so as to be available in time.’’
This Intermittency Challenge is with us still, so much so that the World’s questionable technological preparedness has been memorialized by calling massive electricity storage “the Achilles” heel of renewable energy’’ [61]. If electricity storage of requisite quality and quantity does not become available in timely fashion, then both developed’’ and ‘‘developing’’ economies will most probably stagnate and, in some cases, may regress egregiously.
As it would be most unwise to bungle the transition from the Age of Fossil Fuels to an Age of Renewable Energy, we should presumably develop storage facilities for massive amounts of electrical energy.
Absolute safety of supply is not achievable, but a hundred hours of backup would be enough to ride out most catastrophes. The quantity the World would need works out to be on the order of 1000 TWeh.16
STEADY-OUTPUT GENERATORS OF ELECTRIC POWER ALSO PROFIT FROM ELECTRICITY STORAGE. A practical device for ‘‘storing’’ massive quantities of electricity as electricity seems not at present exist [62]. However, as suggested by Fessenden [60], the energy can be converted into a form that can be stored; and the stored form can, at will, then be back-converted into electricity. Thus, for practical purposes, an electrical storage device can be thought of as a sort of ‘‘granary’’ for electricity, storing when electrical energy is in surplus and disbursing when it is in deficit: in concept it should work equally well, either with solar photovoltaic generation on a day of scudding clouds or with nuclear plant generation, which is output-sluggish and hard to match to diurnally shifting consumer demand.
UNTESTED SOLUTIONS TO THE INTERMITTENCY CHALLENGE SHOULD BE DISCOUNTED. While many papers are written in which the merits of massive electricity storage are modeled, the evidence for the existence of such storage is sparse [63]–[66]. To be specific, if one defines ‘‘massive’’ as ‘‘at least one gigawatt-hour’’ and consults the U. S. Department of Energy’s ‘‘Global Energy Storage Database’’ [67], one discovers that the database does not sort entries by energy capacity! If instead one tries ‘at least 250,000 kW rated output’ plus ‘at least 4 h operation at rated output’, one comes up with 37 projects that have a record of successful operation: all are pumped hydro and only 10 exceed 9.9 GWh, the largest being 39.1 GWh. This last figure is minuscule compared to the electricity storage that will be desirable in an era of renewable energy: it misses the impending need by perhaps four orders of magnitude!
Some Readers may stand firm in their belief that modern science and technology will, when the need becomes urgent, triumphantly surmount the technological challenges facing mankind. They are requested to study the cautionary tales presented in extenso in the Appendix: the history of technology abounds with compelling ideas that just did not work out as expected. Deus ex machina solutions may have been a useful devices in classical drama, but they have no place in guiding the course of nations.
THE RAGONE DIAGRAM AND ITS CONSEQUENCES. THE STORAGE “SMORGASBORD”. A storage facility for electrical energy is conceptually decomposable into three parts: (1) an input energy conversion module, which accepts electrical energy from (for example) a grid and converts it to a storable form; (2) an energy storage module, which actually warehouses that storable form; and (3) an output conversion module, which back-converts the stored form into electrical energy to be transported over the grid. Such a storage facility will typically be described by a Ragone diagram17 that displays two of the three variables: (i) the maximum rate (W) of energy conversion to/from the stored form; (ii) or the time (s) that this maximum rate can be sustained; or (iii) the rated capacity (J) of the storage module. A typical Ragone diagram is shown in Figure 3. The many colored areas indicate roughly (very roughly) the current operating ranges for single units within the ‘‘smorgasbord’’ of available storage technologies [67]; but all these technologies can in principle be stretched by building bigger or by combining storage units in series or parallel.18 What are vital to massive electricity storage are those technologies that appear in the upper right of the diagram, because (i) that corner is where extant massive storage technologies are located and (ii) all devices located there can (easily, in principle) be scaled up enormously. It is they that will be focussed upon below: synthetic combustibles, electrochemical storage in flow batteries, and storage as mechanical energy via either compressed air or elevated mass.
The discussions of electricity storage given below are intended, not to be encyclopedic, but rather to provide brief overviews of those technologies that cluster toward the upper right-hand corner of the Ragone chart of Fig. 3.
CANDIDATE MASSIVE TECHNOLOGIES 1) SYNTHETIC COMBUSTIBLES. Coal, oil, and natural gas – the backbone of the Age of Fossil Fuels [32], [73]–[75]19 – are natural products, the end result of photosynthesis coupled with eons of ordinary geological processes. What rendered them so historically important were: first, their ease of harvesting, with the useful energy returned by the harvest greatly exceeding the energy expended during the harvest; and, second, their high energy density, making their transport, storage, and use relatively convenient. As exhaustion of fossil fuels forces a switch to renewable energy, that convenience is in danger of being lost. Without jet fuel, the convenience of modern air travel vanishes. Without high energy liquid fuel, ground transport as we know it likewise vanishes. Consequently, many researchers have suggested that surplus renewably-generated electricity could be stored by using it to drive the synthesis of suitable combustible chemicals, which might then be used in roughly traditional ways: this certainly seems better than letting the surplus energy go to waste.
2) STORAGE IN BATTERIES In Fig. 3, the only batteries that appear anywhere near the upper right-hand corner are flow batteries. Flow batteries are exceptional among batteries in that the current-limiting surface areas of the anode, ion-selective membrane, and cathode are effectively independent of the volumes of anolyte and catholyte that determine the quantity of energy stored [91]. However, despite much research and many specialist meetings over the past several years, there is not yet very much of such storage extant. For example, among the operational flow-battery facilities listed by the DOE Global Energy Storage Database [67], the largest appears to be only 10 MWh. A recent DOE publication states that ‘‘. . . due to lack of MW-scale field history, flow batteries have not gained substantial commercial traction in the US, with various flow battery technologies still in the demonstration phase, and the largest single operational system at 0.6 MW . . . ’’ ([92, p. 18]). Moreover, even if one were tempted to fall back upon the tried and true non-flow lead-acid battery, this prospective energy storage device has been considered by two different groups and judged non-viable at the terawatt-day quantities needed [93], [94]. Finally, the modularity of batteries should make them seem extremely attractive, but only if (i) the chosen module uses no scarce mineral elements and (ii) the problem of weak links in the storage array can be resolved. With flow batteries, as with all batteries, questions of round-trip energy efficiency, storage, supply sustainability end-of-life recycling (or waste management) loom large.
Hydroelectric pumped storage. Storing water at a high head is desirable, whereas flat-topped mountains over 500 m high and suitable for an upper reservoir are scarce near metropolitan areas;
None of the candidate technologies for massive-scale renewable/sustainable generation of ‘‘green’’ electricity deliver it in a form suitable for high-efficiency storage. None of the prospectively-massive storage modes for transformed electricity is at present well enough developed to be designated a sovereign remedy for Intermittency.
ABOUT WILLIAM F. PICKARD. He received the Ph.D. degree in applied physics from Harvard University. He has pursued a continuously evolving career in teaching and academic research, the preponderance of which has been spent as a Professor with the Department of Electrical and Systems Engineering, Washington University in St. Louis, MO. His research areas have included:
high voltage engineering, electrobiology, the biological effects of electromagnetic �elds, and biological transport and systems biology. He currently concentrates upon the theory and practice of massive energy storage because the sustainability of an industrial civilization depends upon reliable dispatchable energy even though the major renewables are intermittent.
His current foci are the theory of heat exchangers upon which thermal storage depends and underground pumped hydro, the only electrotechnology that currently seems scalable to the multi-terawatt-day levels needed.
Abbreviations (including units not commonly employed in SI): bbl, barrel (of oil, equivalent); d, day; kcf, 1000 standard cubic feet; p, person; scf, standard cubic foot (of natural gas, equivalent); scm, standard cubic meter (of natural gas, equivalent); st, short ton of 2000 pounds; toe, metric tonne of oil equivalent; URR, ultimately recoverable resource;
MWh y-1 translates to 0.114 kW, which by Fig. 2 implies that a steady 1 kW per capita should deliver an HDI in the range of 0.88±0.05. That is, the 1 kW- assumption of Section II.B should, other things being equal, suffice to sustain what most of humanity would deem an enviable quality of life.
References (lots of good references if you want to do further research):
[1] S. H. Mohr, J. Wang, G. Ellem, J. Ward, and D. Giurco, “Projection of world fossil fuels by country,” Fuel, vol. 141, pp. 120�135, Feb. 2015. [
2] C. Budischak, D. Sewell, H. Thomson, L. Mach, D. E. Veron, and W. Kempton, “Cost-minimized combinations of wind power, solar power and electrochemical storage, powering the grid up to 99.9% of the time, J. Power Sour., vol. 225, pp. 60�74, Mar. 2013.
[3] M. Z. Jacobson et al., “Examining the feasibility of converting New York state’s all-purpose energy infrastructure to one using wind, water, and sunlight,” Energy Policy, vol. 57, pp. 585�601, Jun. 2013.
[4] S. Pfenninger, P. Gauché, J. Lilliestam, K. Damerau, and F. Wagner, “Potential for concentrating solar power to provide baseload and dispatchable power,” Nature Climate Change, vol. 4, pp. 689�692, Jun. 2014.
[5] Philostratus (the Athenian), The Life of Apollonius of Tyana: TR, C. P. Jones. Eds. Cambridge, MA, USA: Harvard Univ. Press, , 2005.
[6] J. Dator, Foreward. The Knowledge Base of Futures Studies, vol. 1, R. A. Slaughter, Ed. Hawthorn, Vic., Australia: DDM Media Group, 1996, pp. xix�xx.
[7] W. F. Pickard, “The future of biomass energy: A Fermi-calculation perspective,” Energy Policy, vol. 38, no. 4, pp. 1672�1674, 2010.
[8] M. V. Ramana, “The forgotten history of small nuclear reactors,” IEEE Spectrum, vol. 52, no. 5, pp. 44�58, May 2015. [9] International Energy Agency, Paris, France. (2012). Key World Energy Statistics. [Online]. Available: http://www.oecd-ilibrary.org/energy/ key-world-energy-statistics-2012_key_energ_stat-2012-en, accessed Jul. 4, 2015.
[10] S. B. Carter. (2006). Historical Statistics of the United States (Millennial Edition). [Online]. Available: http://hsus.cambridge.org/ HSUSWeb/toc/tableToc.do?id=Aa6-8
[11] U.S. Census Bureau. (2010). Population Estimates. [Online]. Available:
https://www.census.gov/popest/data/historical/index.html, accessed
Jul. 4, 2015.
[12] (2014). U.S. and World Population Clock. [Online]. Available:
http://www.census.gov/popclock/, accessed Jun. 29, 2015.
[13] Historical Statistics of the United States: Colonial Times to 1970.
U. S. Census Bureau, Washington, DC, USA, 1975.
[14] U.S. Energy Information Administration,Washington, DC, USA. (2012). Total Energy. [Online]. Available: http://www.eia.gov/totalenergy/ data/annual/showtext.cfm?t=ptb0802a, accessed Jul. 4, 2015.
[15] U.S. Energy Information Administration, Washington, DC, USA. (2015). Electricity Net Generation: Total (All Sectors). [Online]
http://www.eia.gov/totalenergy/data/monthly/pdf/sec7_5.pdf
[16] G. Constable and B. Somerville, A Century of Innovation: Twenty Engi- neering Achievements That Transformed Our Lives. Washington, DC, USA: Joseph Henry Press, 2003.
[17] United Nations Development Programme. (2010). Human Develop- ment Report 2010. The Real Wealth of Nations: Pathways to Human Development. [Online].
http://hdr.undp.org/sites/default/�les/ reports/270/hdr_2010_en_complete_reprint.pdf, accessed Jun. 29, 2015.
[18] The World Bank, Washington, DC, USA. (2013). Electric Power Consumption (kWh Per Capita). [Online]. Available: http://data. worldbank.org/indicator/EG.USE.ELEC.KH.PC, accessed Jun. 29,
2015.
[19] J. G. Lambert, C. A. S. Hall, S. Balogh, A. Gupta, and M. Arnold, “Energy, EROI and quality of life,” Energy Policy, vol. 64, pp. 153�167, Jan. 2014.
[20] L. W. Davis and J. Gertler, “Contribution of air conditioning adoption to future energy use under global warming,” Proc. Nat. Acad. Sci. USA, vol. 112, no. 19, pp. 5962�5967, 2015.
[21] The World Bank. (2014). World Development Indicators:
Electricity Production, Sources, and Access. [Online]. Available:
http://wdi.worldbank.org/table/3.7, accessed Jun. 29, 2015.
[22] United Nations. (2004). World Population to 2300. [Online]. Available: http://www.un.org/esa/population/publications/longrange2/ WorldPop2300�nal.pdf, accessed Jun. 29, 2015.
[23] P. Gerland et al., “World population stabilization unlikely this century,” Science, vol. 346, no. 6206, pp. 234�237, 2014.
[24] K. Malik. (2013). Human development report 2013: The rise of the south: Human progress in a diverse world. United Nations Development Programme. [Online]. Available: http://hdr.undp.org/sites/ default/�les/reports/14/hdr2013_en_complete.pdf
[25] United States Internal Revenue Service, New York, NY, USA. (2012). Internal Revenue Bulletin: 2012�18. [Online]. Available:
http://www.irs.gov/irb/2012-18_IRB/ar13.html, accessed Jul. 4, 2015.
[26] American Physical Society, New York, NY, USA. (2014). Energy Units. [Online]. Available: http://www.aps.org/policy/reports/popareports/ energy/units.cfm, accessed Jun. 24, 2015.
[27] L. Guruswamy, “Energy poverty,” Ann. Rev. Environ. Resour., vol. 36, pp. 139�161, Nov. 2011.
[28] ABET, Baltimore, MD, USA. (2015). Criteria for Accrediting Engineer- ing Programs, 2015�2016. [Online]. Available: http://www.abet.org/ accreditation/accreditation-criteria/criteria-for-accrediting-engineeringprograms-2015-2016/#objectives
[29] J. Rawls, A Theory of Justice. Cambridge, MA, USA: Harvard Univ. Press, 1971.
[30] W. F. Pickard, “Geochemical constraints on sustainable development: Can an advanced global economy achieve long-term stability?” Global Planetary Change, vol. 61, nos. 3�4, pp. 285�299, 2008.
[31] D. J. Murphy and C. A. S. Hall, “Year in review�EROI or energy return on (energy) invested,” Ann. New York Acad. Sci., vol. 1185, pp. 102�118, Jan. 2010.
[32] K. Aleklett, Peeking at Peak Oil. New York, NY, USA: Springer-Verlag, 2012.
[33] W. F. Pickard, “Smart grids versus the Achilles’ heel of renewable energy: Can the needed storage infrastructure be constructed before the fossil fuel runs out?” Proc. IEEE, vol. 102, no. 7, pp. 1094�1105, Jul. 2014.
[34] BP. (2015). Oil Reserve De�nitions. [Online]. Available: http:// www.bp.com/content/dam/bp/pdf/Energy-economics/statistical-review -2015/oil-reserve-de�nitions-bp-2015.pdf, accessed Jul. 4, 2015.
[35] D. Rutledge. (2013). Projections for Ultimate Coal Production From Production Histories Through 2012. [Online]. http://rutledge.caltech.edu/, accessed Jun. 24, 2015.
[36] S. H. Mohr and G. M. Evans, “Forecasting coal production until 2100,” Fuel, vol. 88, no. 11, pp. 2059�2067, 2009.
[37] T. W. Patzek and D. Croft, “A global coal production forecast with multi-Hubbert cycle analysis,” Energy, vol. 35, no. 8, pp. 3109�3122, 2010.
[38] M. Höök,W. Zittel, J. Schindler, and K. Aleklett, “Global coal production outlooks based on a logistic model,” Fuel, vol. 89, no. 11, pp. 3546�3558, 2010.
[39] R. Heinberg and D. Fridley, “The end of cheap coal,” Nature, vol. 468, no. 7322, pp. 367�369, 2010. [40] G. Maggio and G. Cacciola, “When will oil, natural gas, and coal peak?” Fuel, vol. 98, pp. 111�123, Aug. 2012. [41] D. Rutledge, “Estimating long-term world coal production with logit and probit transforms,” Int. J. Coal Geol., vol. 85, no. 1, pp. 23�33, 2011.
[42] C. J. Schenk. (2012). An estimate of undiscovered conventional oil and gas resources of the world, 2012. U.S. Geological Survey Fact Sheet 2012�3042, U.S. Geological Survey. [Online]. http://pubs.usgs.gov/fs/2012/3042/fs2012-3042.pdf
[43] J.Wang, L. Feng, L. Zhao, S. Snowden, and X.Wang, “A comparison of two typical multicyclic models used to forecast the world’s conventional oil production,” Energy Policy, vol. 39, no. 12, pp. 7616�7621, 2011.
[44] R. J. Brecha, “Ten reasons to take peak oil seriously,” Sustainability, vol. 5, no. 2, pp. 664�694, 2013.
[45] D. H. Root, L. J. Drew, and F. G. Wood, “The pattern of petroleum discovery rates: Why does the amount of petroleum discovered per unit of exploratory drilling drop off so sharply after the initial phases of exploration?” Amer. Sci., vol. 67, no. 6, pp. 648�652, 1979.
[46] M. Höök, R. Hirsch, and K. Aleklett, “Giant oil �eld decline rates and their in�uence on world oil production,” Energy Policy, vol. 37, no. 6, pp. 2262�2272, 2009.
[47] F. Robelius. (2007). Giant oil �eld decline rates and their in�uence on world oil production. Uppsala Univ., Uppsala, Sweden. [http://uu.diva-portal.org/smash/record.jsf?pid=diva2:169774
[48] BP. 2015. Statistical Review ofWorld Energy 2015. http://www.bp.com/content/dam/bp/pdf/Energy-economics/statisticalreview-2015/bp-statistical-review-of-world-energy-2015-full-report.pdf
[49] GPO. (2008). U.S. Government Printing Of�ce Style Manual. [Online]. Available: http://www.gpo.gov/fdsys/pkg/GPO-STYLEMANUAL-2008/pdf/GPO-STYLEMANUAL-2008.pdf
[50] American Oil & Gas Historical Society, Washington, DC, USA. (2014). History of the 42-Gallon Oil Barrel. http://aoghs.org/popular-oil-history-articles/history-of-the-42-gallon-oilbarrel/
[51] W. F. Pickard, “Finessing the fuel: Revisiting the challenge of radioactive waste disposal,” Energy Policy, vol. 38, no. 2, pp. 709�714, 2010.
[52] D. Abbott, “Is nuclear power globally scalable?” Proc. IEEE, vol. 99, no. 10, pp. 1611�1617, Oct. 2011.
[53] D. Abbott, “Limits to growth: Can nuclear power supply the world’s needs?” Bull. Atomic Scientists, vol. 68, no. 5, pp. 23�32, 2012.
[54] A. Ahmad and M. V. Ramana, “Too costly to matter: Economics of nuclear power for Saudi Arabia,” Energy, vol. 69, pp. 682�694, May 2014.
[55] S. R. Pillai and M. V. Ramana, “Breeder reactors: A possible connection between metal corrosion and sodium leaks,” Bull. Atomic Scientists, vol. 70, no. 3, pp. 49�55, 2014.
[56] N. S. Lewis, “Powering the planet,” MRS Bull., vol. 32, no. 10, pp. 808�820, 2007.
[57] N. Armaroli and V. Balzani, Energy for a Sustainable World: From the Oil Age to a Sun-Powered Future. Weinheim, Germany: Wiley, 2011.
[58] D. J. C. MacKay, Sustainable Energy�Without the Hot Air. Cambridge, U.K.: UIT Cambridge Ltd., 2009.
[59] D. Abbott, “Keeping the energy debate clean: How do we supply the world’s energy needs?” Proc. IEEE, vol. 98, no. 1, pp. 42�66, Jan. 2010.
[60] R. A. Fessenden, “The commercial solution of the problem of utilising, for the production of power, the energy of solar radiation, the wind and other intermittent natural sources,” Electrician, vol. 65, pp. 951�953, Sep. 1910.
[61] B. S. Lee and D. E. Gushee, “Electricity storage: The Achilles’ heel of renewable energy,” Chem. Eng. Progr., vol. 104, pp. S29�S32, Mar. 2008.
[62] W. F. Pickard, A. Q. Shen, and N. J. Hansing, “Parking the power: Strategies and physical limitations for bulk energy storage in
supply�demand matching on a grid whose input power is provided by intermittent sources,” Renew. Sustain. Energy Rev., vol. 13, no. 8, pp. 1934�1945, 2009.
[63] G. Philippidis, “Commentary: Powering America with sustainable energy in the 21st century,” J. Renew. Sustain. Energy, vol. 4, no. 6, p. 062801, 2012.
[64] T. Kousksou, P. Bruel, A. Jamil, T. El Rha�ki, and Y. Zeraouli, “Energy storage: Applications and challenges,” Solar Energy Mater. Solar Cells,
vol. 120, pp. 59�80, Jan. 2014.
[65] M. J. Alexander, P. James, and N. Richardson, “Energy storage against interconnection as a balancing mechanism for a 100% renewable UK electricity grid,” IET Renew. Power Generat., vol. 9, no. 2, pp. 131�141, 2015.
[66] T. M. I. Mahlia, T. J. Saktisahdan, A. Jannifar, M. H. Hasan, and H. S. C. Matseelar, “A review of available methods and development on energy storage; technology update,” Renew. Sustain. Energy Rev., vol. 33, pp. 532�545, May 2014.
[67] U.S. Department of Energy, Washington, DC, USA. (2015). Global Energy Storage Database. [Online]. Available: http://www. energystorageexchange.org/, accessed May 21, 2015.
[68] B. Zakeri and S. Syri, “Electrical energy storage systems: A comparative life cycle cost analysis,” Renew. Sustain. Energy Rev., vol. 42, pp. 569�596, Feb. 2015.
[69] S. Sabihuddin, A. E. Kiprakis, and M. Mueller, “A numerical and graphical review of energy storage technologies,” Energies, vol. 8, no. 1, pp. 172�216, 2015.
[70] F. Díaz-González, A. Sumper, O. Gomis-Bellmunt, and R. Villafá�la-Robles, “A review of energy storage technologies for wind power applications,” Renew. Sustain. Energy Rev., vol. 16, no. 4, pp. 2154�2171, 2012.
[71] A. Poullikkas, “A comparative overview of large-scale battery systems for electricity storage,” Renew. Sustain. Energy Rev., vol. 27, pp. 778�788, Nov. 2013.
[72] Z. Zhou, M. Benbouzid, J. F. Charpentier, F. Scuiller, and T. Tang, “A review of energy storage technologies for marine current energy systems,” Renew. Sustain. Energy Rev., vol. 18, pp. 390�400, Feb. 2013.
[73] P. J. E. M. van Dam, “Sinking peat bogs: Environmental change Holland, 1350�1550,” Environ. History, vol. 6, no. 1, pp. 32�45, 2001.
[74] U.S. Geological Survey, Reston, VA, USA. (2013). Peat. Mineral Commodity Summaries 2013. [Online]. Available: http://minerals.usgs. gov/minerals/pubs/mcs/2013/mcs2013.pdf, accessed Jun. 29, 2015.
[75] J. Grönroos et al., “Life-cycle climate impacts of peat fuel: Calculation methods and methodological challenges,” Int. J. Life Cycle Assessment, vol. 18, no. 3, pp. 567�576, 2013.
[76] A. Ursúa, L. M. Gandia, and P. Sanchis, “Hydrogen production from water electrolysis: Current status and future trends,” Proc. IEEE, vol. 100, no. 2, pp. 410�426, Feb. 2012.
[77] S. Verhelst et al., “Electricity powering combustion: Hydrogen engines,” Proc. IEEE, vol. 100, no. 2, pp. 427�439, Feb. 2012.
[78] U. Bossel, “Does a hydrogen economy make sense?” Proc. IEEE, vol. 94, no. 10, pp. 1826�1837, Oct. 2006.
[79] J. Andrews and B. Shabani, “Re-envisioning the role of hydrogen in a sustainable energy economy,” Int. J. Hydrogen Energy, vol. 37, no. 2, pp. 1184�1203, 2012.
[80] S. Verhelst, “Future vehicles will be driven by electricity, but not as you think,” Proc. IEEE, vol. 102, no. 10, pp. 1399�1403, Oct. 2014.
[81] W. L. Ahlgren, “The dual-fuel strategy: An energy transition plan,” Proc. IEEE, vol. 100, no. 11, pp. 3001�3052, Nov. 2012.
[82] Agency for Toxic Substances and Disease Registry, Atlanta, GA, USA. (2004). Ammonia. http://www.atsdr.cdc.gov/ toxpro�les/tp126-c1-b.pdf, accessed Jun. 28, 2015.
[83] M. Mikkelsen, M. Jørgensen, and F. C. Krebs, “The teraton challenge. A review of �xation and transformation of carbon dioxide,” Energy Environ. Sci., vol. 3, no. 1, pp. 43�81, 2010.
[84] C. Graves, S. D. Ebbesen, M. Mogensen, and K. S. Lackner, “Sustainable hydrocarbon fuels by recycling CO2 and H2O with renewable or nuclear energy,” Renew. Sustain. Energy Rev., vol. 15, no. 1, pp. 1�23, 2011.
[85] G. A. Olah, G. K. S. Prakash, and A. Goeppert, “Anthropogenic chemical carbon cycle for a sustainable future,” J. Amer. Chem. Soc., vol. 133, no. 33, pp. 12881�12898, 2011.
[86] F. Schüth, “Chemical compounds for energy storage,” Chem. Ingenieur Tech., vol. 83, no. 11, pp. 1984�1993, 2011.
[87] R. J. Pearson et al., “Energy storage via carbon-neutral fuels made from CO2, water, and renewable energy,” Proc. IEEE, vol. 100, no. 2, pp. 440�460, Feb. 2012.
[88] A. Harriman, “Prospects for conversion of solar energy into chemical fuels: The concept of a solar fuels industry,” Philos. Trans. Roy. Soc.
London A, Math., Phys., Eng. Sci., vol. 371, no. 1996, p. 20110415, 2013.
[89] V. N. Nguyen and L. Blum, “Syngas and synfuels from H2O and CO2:
Current status,” Chem. Ingenieur Tech., vol. 87, no. 4, pp. 354�375, 2015.
[90] K. S. Lackner, S. Brennan, J. M. Matter, A.-H. A. Park, A. Wright, and B. van der Zwaan, “The urgency of the development of CO2 capture from ambient air,” Proc. Nat. Acad. Sci. USA, vol. 109, no. 33, pp. 13156�13162, 2012.
[91] A. A. Akhil et al. (2013). DOE/EPRI 2013 electricity storage handbook. Sandia National Laboratories, Albuquerque, NM, USA. http://www.sandia.gov/ess/publications/SAND2013-5131.pdf
[92] U.S. Department of Energy. (2013). Grid Energy Storage. http://energy.gov/sites/prod/�les/2013/12/f5/Grid%20Energy%20Storage%20December%202013.pdf
[93] T.W. Murphy. (2011). A Nation-Sized Battery. http:// physics.ucsd.edu/do-the-math/2011/08/nation-sized-battery/ [94] W. F. Pickard, “A nation-sized battery?” Energy Policy, vol. 45, pp. 263�267, Jun. 2012.
[95] B. Huskinson et al., “A metal-free organic�inorganic aqueous �ow battery,” Nature, vol. 505, pp. 195�198, Jan. 2014.
[96] I. Dincer and M. A. Rosen, Exergy: Energy, Environment and Sustainable Development, 2nd ed. Oxford, U.K.: Elsevier, 2012.
[97] P. Vadasz, “Compressed air energy storage: Optimal performance and techno-economical indices,” Int. J. Appl. Thermodyn., vol. 2, no. 2, pp. 69�80, 1999.
[98] J. E. Mason and C. L. Archer, “Baseload electricity from wind via compressed air energy storage (CAES),” Renew. Sustain. Energy Rev., vol. 16, no. 2, pp. 1099�1109, 2012.
[99] R. Kushnir, A. Ullmann, and A. Dayan, “Thermodynamic and hydrodynamic response of compressed air energy storage reservoirs: A review,” Rev. Chem. Eng., vol. 28, nos. 2�3, pp. 123�148, 2012. [100] G. Grazzini and A. A. Milazzo, “A thermodynamic analysis of multistage adiabatic CAES,” Proc. IEEE, vol. 100, no. 2, pp. 461�472, Feb. 2012.
[101] Y.-M. Kim, J.-H. Lee, S.-J. Kim, and D. Favrat, “Potential and evolution of compressed air energy storage: Energy and exergy analyses,” Entropy, vol. 14, no. 8, pp. 1501�1521, 2012.
[102] Y. Zhang, K. Yang, X. Li, and J. Xu, “The thermodynamic effect of air storage chamber model on advanced adiabatic compressed air energy storage system,” Renew. Energy, vol. 57, pp. 469�478, Sep. 2013.
[103] H. Safaei, D. W. Keith, and R. J. Hugo, “Compressed air energy storage (CAES) with compressors distributed at heat loads to enable waste heat utilization,” Appl. Energy, vol. 103, pp. 165�179, Mar. 2013.
[104] S. D. Lim, A. P. Mazzoleni, J.-K. Park, P. I. Ro, and B. Quinlan, “Conceptual design of ocean compressed air energy storage system,” Marine Technol. Soc. J., vol. 47, no. 2, pp. 70�81, Mar./Apr. 2013.
[105] C. M. Oldenburg and L. Pan, “Porous media compressed-air energy storage (PM-CAES): Theory and simulation of the coupled wellbore� reservoir system,” Transp. Porous Media, vol. 97, no. 2, pp. 201�221, Mar. 2013.
[106] U.S. Energy Information Administration, Electric Power Annual. (2013). Existing Capacity by Energy Source. http://www.eia.gov/electricity/annual/html/epa_04_03.html
[107] U.S. Energy Information Administration, Electric Power Annual. (2013). Planned Generating Capacity Changes, by Energy Source. http://www.eia.gov/electricity/annual/html/epa_04_05.html
[108] W. F. Pickard, “The history, present state, and future prospects of underground pumped hydro for massive energy storage,” Proc. IEEE, vol. 100, no. 2, pp. 473�483, Feb. 2012.
[109] Sogecom. (2011). Flat-Land Large-Scale Electricity Storage (FLES). http://www.sogecom.nl/energy.html
[110] ARES. (2015). Grid Scale Energy Storage. http://www.aresnorthamerica.com/grid-scale-energy-storage
[111] C. Marchetti, “Primary energy substitution models: On the interaction between energy and society,” Technol. Forecasting Soc. Change, vol. 10, no. 44, pp. 345�356, 1977.
[112] R. Fouquet, Heat, Power and Light: Revolutions in Energy Services. Cheltenham, U.K.: Edward Elgar, 2008.
[113] V. Smil, Energy Transitions: History, Requirements, Prospects. Santa Barbara, CA, USA: Praeger, 2010.
[114] R. Fouquet, “The slow search for solutions: Lessons from historical energy transitions by sector and service,” Energy Policy, vol. 38, no. 11, pp. 6586�6596, Nov. 2010.
[115] S. Chu and A. Majumdar, “Opportunities and challenges for a sustainable energy future,” Nature, vol. 488, pp. 294�303, Aug. 2012.
[116] W. F. Pickard and D. Abbott, “Addressing the intermittency challenge: Massive energy storage in a sustainable future [scanning the issue],” Proc. IEEE, vol. 100, no. 2, pp. 317�321, Feb. 2012.
[117] U.S. Energy Information Administration. (2014). U.S. Petroleum and Other Liquids. http://www.eia.gov/forecasts/steo/ report/us_oil.cfm?src=Petroleum-b1
[118] U.S. Energy Information Administration. (2014). Coal. http://www.eia.gov/coal/
[119] U.S. Energy Information Administration. (2014). Natural Gas. http://www.eia.gov/naturalgas/
[120] BEA. (2014). Bureau of Economic Analysis. http:// www.bea.gov/newsreleases/national/gdp/gdpnewsrelease.htm
[121] G. F. Nemet; D. M. Kammen. U.S. energy research and development: Declining investment, increasing need, and the feasibility of expansion. Energy Policy, vol. 35, no. 1, pp. 746�755, Jan. 2007.
[122] M. G. Smith and J. Urpelainen, Why has public R&D on alternatives to fossil fuels decreased in industrialized countries? Environ. Sci. Policy, vol. 25, pp. 127�137, Jan. 2013.
[123] National Priorities. 2014. Federal Spending: Where Does the Money Go? National Priorities Project. http://nationalpriorities.org/budget-basics/federal-budget-101/spending/
[124] F. L. Pryor, Z. P. Pryor, M. Stadnik, and G. J. Staller, Czechoslovak aggregate production in the interwar period, Rev. IncomeWealth, vol. 17, no. 1, pp. 35�59, Mar. 1971.
[125] A. Teichova, The Czechoslovak Economy, 1918-1980. London, U.K.: Routledge, 1988.
[126] M. Albright and W. Woodward, Prague Winter: A Personal Story of Remembrance and War, 1937�1948. New York, NY, USA: Harper, 2012.
[127] T. W. Murphy. (2011). The Energy Trap. http://physics.ucsd.edu/do-the-math/2011/10/the-energy-trap/
[128] G. Crabtree, E. Kocs, and T. Aláan, Energy, society and science: The �fifty-year scenario, Futures, vol. 58, pp. 53�65, Apr. 2014.
[129] R. Baxter, Energy Storage: A Nontechnical Guide. Tulsa, OK, USA: PennWell, 2006.
[130] H. Ibrahim, A. Ilinca, and J. Perron, Energy storage systems� Characteristics and comparisons, Renew. Sustain. Energy Rev., vol. 12, no. 5, pp. 1221�1250, Jun. 2008.
[131] D. J. C. MacKay, “Solar energy in the context of energy use, energy transportation and energy storage, Philos. Trans. Roy. Soc. London A, Math. Phys. Sci., vol. 371, p. 20110431, Jul. 2013. [132] B. Dunn, H. Kamath, and J.-M. Tarascon, “Electrical energy storage for the grid: A battery of choices, Science, vol. 334, no. 6058, pp. 928�935, Nov. 2011.
[133] SBC Energy Institute, s-Gravenhage, The Netherlands. (2013). Electricity Storage. [https://www.sbc.slb.com/ SBCInstitute/Publications/ ~ / media/Files/SBC%20Energy%20Institute/ SBC%20Energy%20Institute_Electricity_Storage%20Factbook_vf1.pdf
[134] J. Nelson and P. Simshauser, Is the merchant power producer a broken model? Energy Policy, vol. 53, pp. 298�310, Feb. 2013.
[135] A. Ansar, B. Flyvbjerg, A. Budzier, and D. Lunn, Should we build more large dams? The actual costs of hydropower megaproject development, Energy Policy, vol. 69, pp. 43�56, Jun. 2014.
[136] C. Sulzberger, An early road warrior: Electric vehicles in the early years of the automobile, IEEE Power Energy Mag., vol. 2, no. 3, pp. 66�71, May/Jun. 2004.
[137] M. B. Schiffer, T. C. Butts, and K. K. Grimm, Taking Charge: The Electric Automobile in America. Washington, DC, USA: Smithsonian Institution Press, 1994.
[138] Electric Drive Transportation Association. (2015). Electric Drive Vehicle Sales Figures. http://electricdrive. org/index.php?ht=d/sp/i/20952/pid/20952
[139] Union of Concerned Scientists, Cambridge, MA, USA. (2013). U.S. Ballistic Missile Defense Timeline: 1945�2013.
http://www.ucsusa.org/nuclear_weapons _ and_global_security/solutions/missile-defense/us-ballistic-missile-defense.html
[140] E. Marshall, “MILITARY RESEARCH: A midcourse correction for U.S. missile defense system,” Science, vol. 339, no. 6127, pp. 1508�1509, Mar. 2013.
[141] Missile Defense Agency, Fort Belvoir, VA, USA. (2013). Aegis Bal- listic Missile Defense System Completes Successful Intercept Flight Test. http://www.mda.mil/news/13news0009.html
[142] M. Dodge. (2013). Missile defenses: Robust testing program essential. The Heritage Foundation. http://www.heritage.org/research/reports/2013/05/missile-defense-testing-robust-programessential
[143] World Bank. (2015). GDP Growth (Annual%). http://data.worldbank.org/indicator/NY.GDP.MKTP.KD.ZG?page=4
[144] A. Ciralsky. (Sep. 16, 2013). Will it Fly? Vanity Fair. http://www.vanityfair.com/politics/2013/09/joint-strike-�ghter-lockheed-martin
[145] W. Boardman. (2014). F-35 Burns on Runway During Testing. http://readersupportednews.org/opinion2/277-75/24466-focus-f-35-burns-on-runway-during-testing
[146] W. Boardman. (2014). F-35: Zombie Fighter-Bomber of American `Defense’ Fantasies? http://www.smirkingchimp.com/thread/william-boardman/58078/f-35-zombie-�ghter-bomber-ofamerican-defense-fantasies
[147] T. Mason, T. Curry, and D. Wilson. (2012). Capital costs for transmission and substations. Black & Veatch.
https://www.wecc.biz/Reliability/1210_BV_WECC_TransCostReportFinal.pdf
[148] H. Petroski, Success Through Failure: The Paradox of Design. Princeton, NJ, USA: Princeton Univ. Press, 2006.

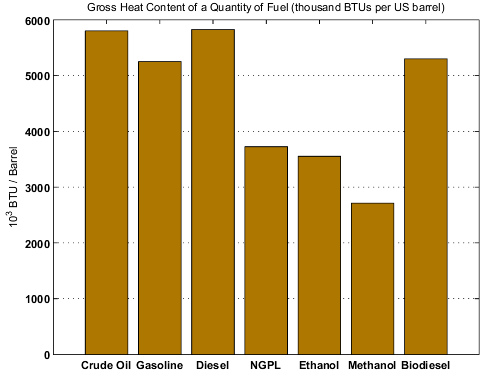
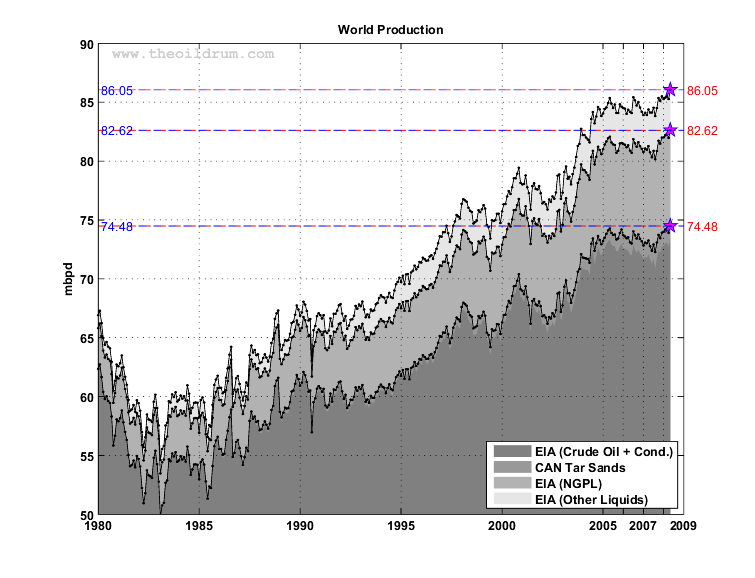
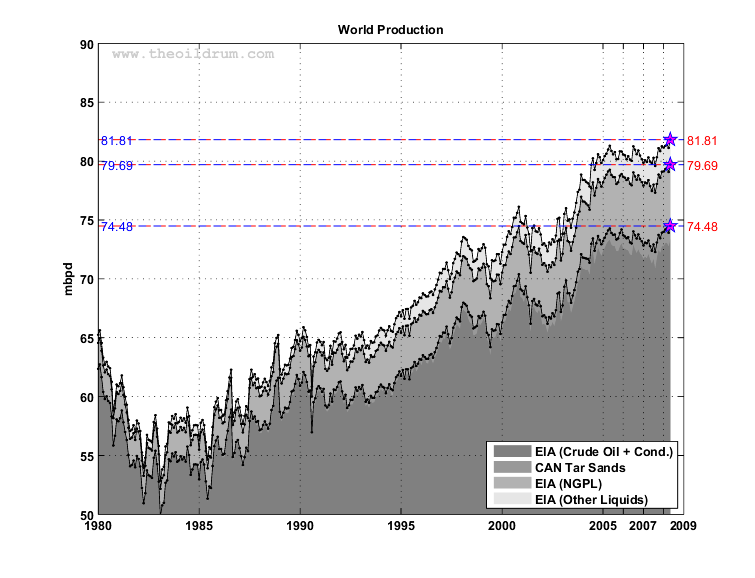
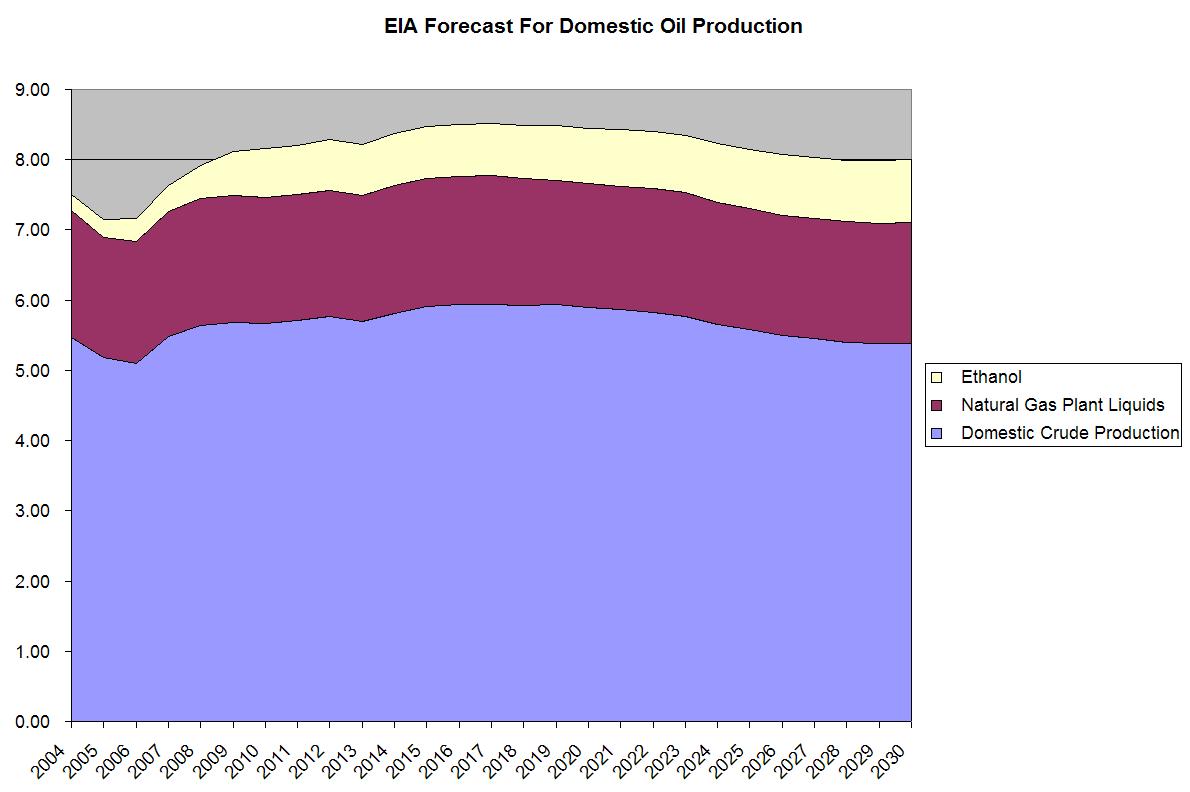
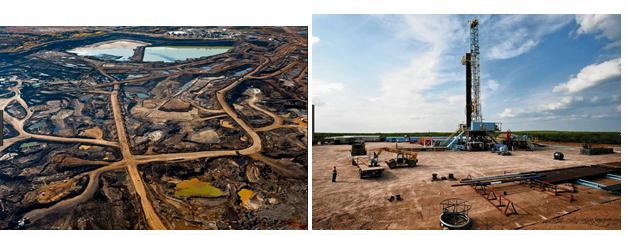 [ Below is a post by Art Berman which I found interesting because I’m concerned about whether enough diesel can be made in the future to keep trucks running. Light tight “fracked” oil is better at making plastics and gasoline than diesel fuel. Tar sands need natural gas or light oil additions to thin the tarry asphalt enough to get through pipelines to refineries to be further refined with light “fracked” oil, hence the happy marriage of light oil and tar sands.