
[ There’s a great deal of interest in the Hill’s Group report, but Nate Hagens came up with similar results back in 2007 and he explains his ideas far more eloquently. Although much production of U.S. oil and gas may perhaps go net energy negative by 2030, the Middle East and a few other areas will still be producing net energy positive barrels. Though whether they will be exporting as much is doubtful given that their population is growing at the same time their oil production is declining — see the export land model post for details. There is also a part 1 here and a part 3 here. See all of Nate Hagens posts at theoildrum here]
Nate Hagens. April 2, 2007. “Peak Oil” – Why Smart Folks Disagree – Part II. The Oil Drum.
There continues to be considerable disagreement on both the timing and the magnitude of Peak Oil, though last week’s GAO report(pdf) should be helpful in shrinking that gap. Part I of this 3 part series summarized some of the recent discussion of why some are very concerned about Peak Oil and others are relatively unconcerned. We also discussed why there needs to be a clear definition of Peak Oil so that policymakers discuss ‘apples and apples’. This post will continue to examine areas of disagreement between the two camps, and will particularly focus on what I perceive to be the largest disconnect in energy, financial and government circles – that of the difference between gross and net production of finite resources.

Decline in Net Energy on US Oil Production
A Hypothetical Sensitivity Analysis on EIA Projections (mbpd)(click to enlarge)
If you ask 100 people about Peak Oil, you will get a few shrugs of disdain, a few vehement diatribes and about 90 blank stares. Its not a subject easily talked about, easily understood, or easily internalized. This post points out some major areas of why people either disagree about or don’t comprehend the magnitude of this human problem. These issues have been thoroughly discussed on this site for the past 2 years, but for new readers I will attempt to briefly summarize some of these major areas of disagreement – for old readers (err..seasoned readers), please jump down to Reason #6, where begins some new analysis. This post will be followed by Part III, which will discuss the more interesting and controversial social and psychological reasons why there exists such a polarization of opinion on this important topic.
REASON #1 THERE IS VERY LITTLE RELIABLE DATA ON OIL, GAS (AND COAL)
Neither the concerned nor the unconcerned camp can have any great confidence in reserve or future production data due to the fact that 85-90% of the worlds oil is owned or controlled by nations or national oil companies. Furthermore, estimates on the dollar and energy costs to produce this oil are all but nonexistent. The unconcerned camp leans heavily on forecasts from the USGS and EIA, both of which have in recent years been overly optimistic. (The US government Energy Information Agency has a $60 median forecast for oil for 2030!!(1) While there is a (very slight) chance they could be right, the prediction is based on not only a paucity of data, but (at least historically) has been comprised of economic as opposed to scientific analysis:
“..These adjustments to the USGS and MMS estimates are based on non-technical considerations that support domestic supply growth to the levels necessary to meet projected demand levels.”(2)
In other words, the figures were rearranged to show that we will always have enough. Yet these pronouncements and predictions are received by corporate America as carrying the weight of certainty (more on this in part III).
The concerned camp at least uses the data that we DO have – that of past and current production. 50 countries have already peaked in production and many more could peak in the very near future based on logistical and hubbert linearization methods discussed on this website. While its possible these countries could rebound and see new peaks, that has not been the pattern. The USA peaked in production in 1970 and has since been in terminal decline with the exception of the blip up from the North Slope in Alaska. Yet the EIA ccurrently continues to forecast increased US production from now until 2016 in their latest report.
The basic point here is: we don’t know, so isn’t it better to use the precautionary principle than keep driving and hoping we’re not on fumes?
REASON #2 -ACTUAL PRODUCTION FLOWS DO NOT EQUAL “PRODUCTIVE CAPACITY”
THOUGHT EXPERIMENT
Imagine for the moment that a large group of apple orchards represents the worlds oil fields (apples being the oil). As frugivores, we care about the rate at which apples can be picked in one orchard (and all orchards) and delivered to the grocer. CERA type analysis is focused on counting how many total apples are in all the orchards, including the wormy ones (heavy oil), the ones on top of trees requiring heavy equipment to pick (oil sands) and the ones on farmers land they have never been allowed onto, but take the word of the farmer how many apples he has (middle east). They also are including oranges (coal-to liquids), pears (oil shale) and kumquats (ethanol) to come up with their ‘apple resource’. Even if we can and should count all these fruits as apples, the rate at which our apple picking resources can extract the apples and get them to the supermarket is a far more limiting statistic than the number of apples in the orchards. Plus many of our recipes just don’t taste as good using kumquats.
The second half of oil(or even 3/4 according to CERA) will follow vastly different rules than the first half. Deeper wells in more remote, sensitive locations, heavier, sourer oil, growing populations and internal consumption in exporting countries, lack of skilled oil personnel and geologists, geopolitical conflict, hurricanes in new exploration areas, expensive rigs, environmental limitations, first nation disputes, lack of upstream capital expenditures, etc will all contribute to actual production being unlikely to match ‘productive capacity’. Again, maybe it will. But maybe it won’t. And the flow rate of liquid fuels is what makes the world economy run, not how much is conceivably underground.
A prime example of the risk of these type of projections was pointed out by our resident water cut sleuth” last week. Cambridge Energy (CERA) expects Saudi Arabia to grow to 14.3 million barrels a day in 2015 from 12.7 mbpd in 2005 (actual production in 2005 was under 9.5 mbpd). So, sometimes productive capacity is even higher than actual production in the past.
REASON #3 – THE TIMING OF PEAK OIL IS SO IMPORTANT BECAUSE OF THE TIME LAGS REQUIRED FOR MITIGATION
The worlds transportation (and therefore food) system is utterly dependent on oil. In the DOE funded Hirsch Report, the economist authors made it very clear that the Peaking of global oil production was a monumental task and would require 20 years! lead time to effectively mitigate (noticeably absent from the report were environmental consequences of the choices of mitigation). Even at 10 year lead time they predicted liquid fuel shortfalls. In other words, this is not a problem that we can solve overnight.
Last weeks release of the much anticipated GAO Report on Peak Oil echoes the urgency with which to change policy due to long lead times and the pervasivness of oil services in our society.
REASON #4 – THE MARKET WILL SOLVE IT, RIGHT?
In Part III of this article I will discuss our penchant for believing confident authority figures. For now lets address the most embedded theme among the unconcerned – that the market will automatically solve the energy problem via advanced price signals that will lead to new energy technology that replaces fossil fuels.
Neoclassical economic theory has as a core assumption perfect information. But, as we have seen above, we actually have very little good information on future oil supplies and flows. The worlds major oil exporters mostly have below investment grade sovereign credit ratings, and the market is priced at the marginal barrel. As long as the market is reasonably supplied over the short term, and the major media focus on the government forecast for oil prices to remain constant for the next 25 years (the EIA has two forecasts a high of $90 in 2030 and a low of $28), the classic Hotelling model of resource extraction, where resource owners charge increasing rents and withhold production to maximize rents, has not yet started to kick in. From the above referenced TOD post:
The authors (Gowdy et al) conclude that temporary incremental production gains are offset by later steeper decline rates in the tail end of production without increasing the overall URR. Their main conclusions are essentially that 1) oil is not being treated as a finite resource as oil field analyses predict and 2) temporary production gains mask real scarcity and result in misleading low oil prices.
This is consistent with the thesis that parts of Ghawar are mostly watered out and there will not be a gradual decline when they quit but more of an abrupt crash. How many of the worlds productive fields will show this pattern due to horizontal drilling and advanced techniques getting out as much as possible as soon as possible? As ‘John’ said in the introductory interview, people may believe in the concept of peak oil, but they are trying to make money and live for today – the market probably wont give us a strong signal until we are well past peak oil – and that may even be masked by demand destruction due to recession/depression. Following the precautionary principle is not a strong suit of a market based economy. Without good information on 90% of the worlds oil, and decades needed to properly adapt, it is likely the market will be in for some surprises that don’t have easy invisible hand fixes.
Briefly regarding alternative energy, we a)have to replace the total liquid fuels lost by a source or sources that give us the same or higher energy gain and can scale/grow at the same or higher rate than oil and gas deplete and b) do so without running into limitations of other finite resources such as water, land, soil, etc.(3) A colleague and I have just completed a paper showing that global bio-energy growth will be severely limited by water constraints by 2025, as one example.
REASON #5 – ITS NOT ABOUT RUNNING OUT OF OIL, BUT RUNNING OUT OF THE PERCEPTION OF GROWTH
There will still be oil in the ground 100 years from now, and even 1 million years from now. Peak oil has never been about it ‘running out’. But society has become accustomed to growth. The embodied energy in fossil fuels generates this growth (aided and leveraged by human labor and ingenuity, but the vast majority due to the energy capacity of oil to do work). Remember one barrel of oil has the amount of BTUs it would take an average man 12.5 years of 40 hours a week of labor to produce.
Our debt based capitalist society is based on the ability of everyone to climb the ladder. If it becomes apparent that there is a ceiling, all the rules of the system breakdown. Growth is based on the ability of people to get loans, grow businesses and repay the loans with interest. If there is less and less energy available each year thats one thing – it might just show up as recession/belt-tightening. However, if peoples PERCEPTION is that less and less energy will be available then why would banks give out loans, why would people go to work, etc? The economy can only grow if the Energy Return on Investment from oil is replaced with something as high or higher. (more on that below)
Largely because oil is finite and dollars are not, King Hubbert concluded we would have either a zero interest rate, or (very high) inflation(5).
REASON #6 – THERE IS AN INCREASING GAP BETWEEN REPORTED BTU CONTENT AND USABLE ENERGY
Most oil analysts focus on the gross amount of oil produced. This will be increasingly misleading, for many reasons. First of all, the different liquids called ‘oil’ in the EIA and CERA forecasts differ in their BTU content.
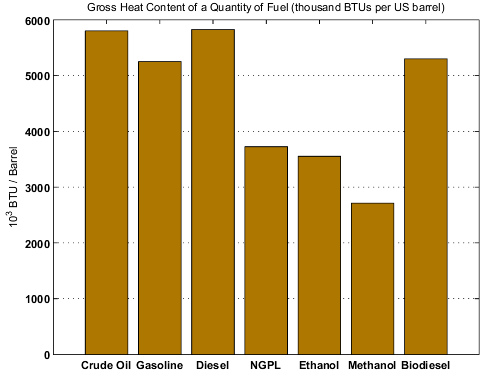
Gross Heat Content of 42 Gallons (1 US Barrel) of different fuels (Source EIA -ConversionFactors and Gross Heat Contents and the DEO (BiomassEnergy Book, Appendix A).
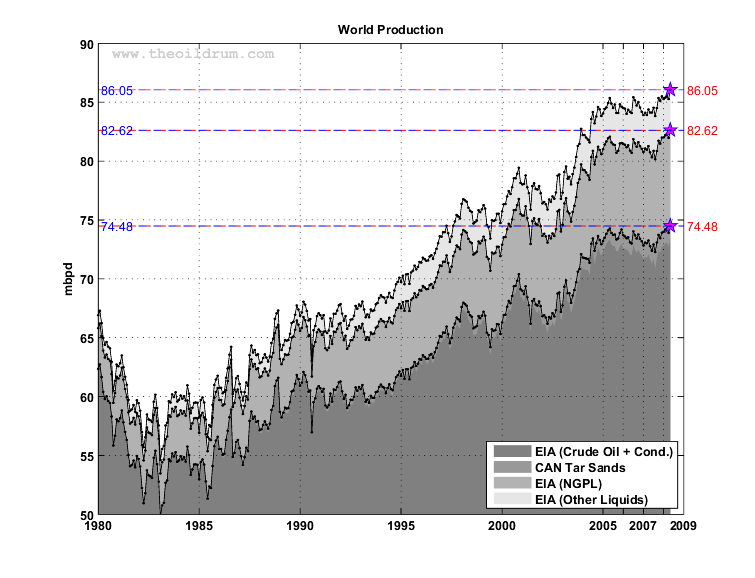
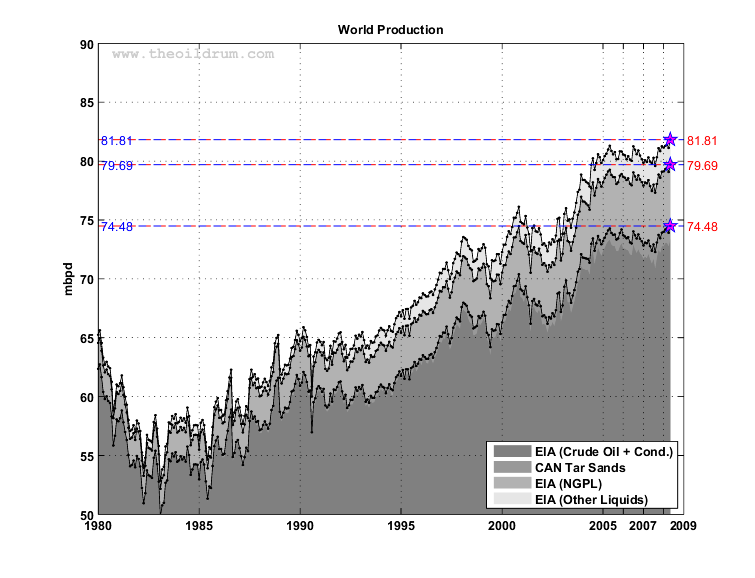
Natural Gas Plant Liquids(NGPL) and “Other Liquids” (primarily ethanol) are taking up a larger share of world production (the relative width of the two lighter gray areas is growing on left graph). These liquids have much less BTU content than crude oil and we need more of these products to accomplish the same amount of work as with straight crude oil. 42 gallons of Ethanol equals 0.61 barrel of crude oil. One barrel of NGPL only equates to 0.64 barrel of crude oil. The graph on the top is what is reported by the EIA as ‘total oil production’. The graph on the bottom is adjusted for the lower BTU content of NGPL and ethanol. As you can see – there is about a 5mpbd drop in BTU content available to do economic work.
We need oil for the energy services it provides. Though we notionally have 85mbpd, we only get to use 80mbpd of ‘oil’ BTU content. So other than convenience, using gross figures in projecting supply, especially when an increasing % of the liquids will be coming from lower BTU sources is overly optimistic.
US ONLY
 |
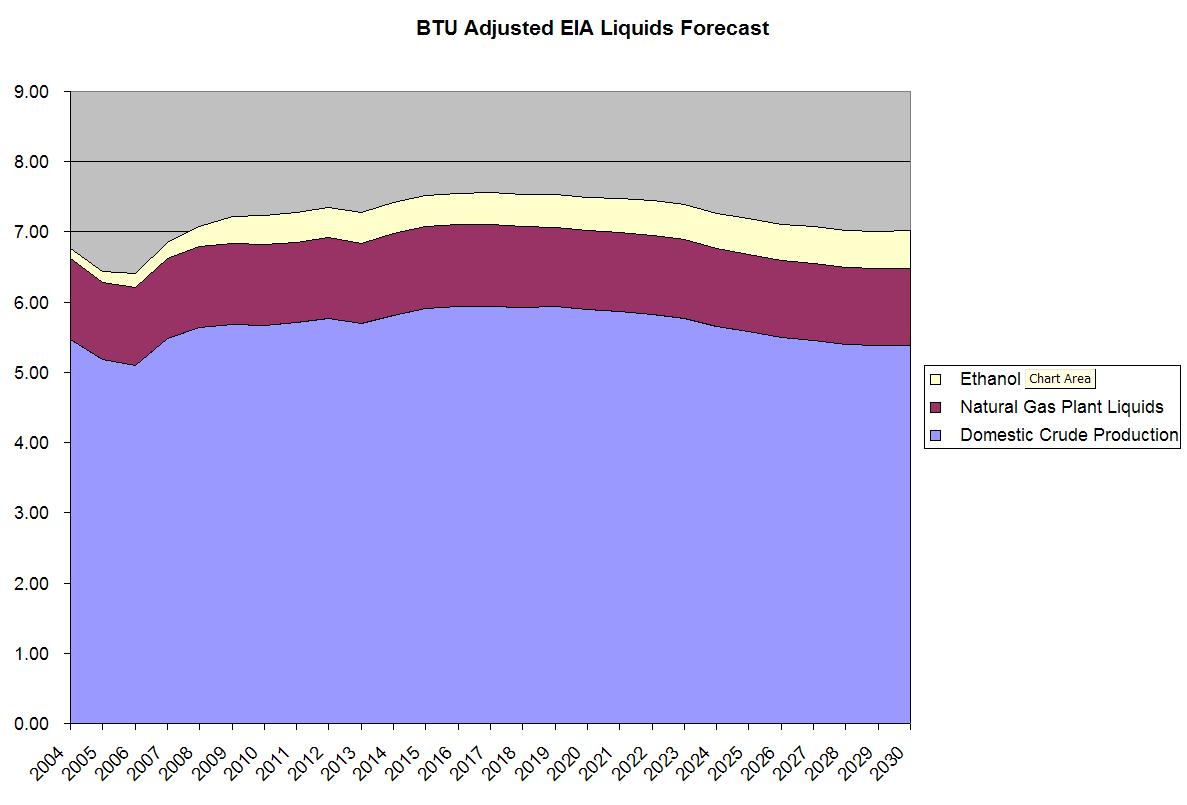 |
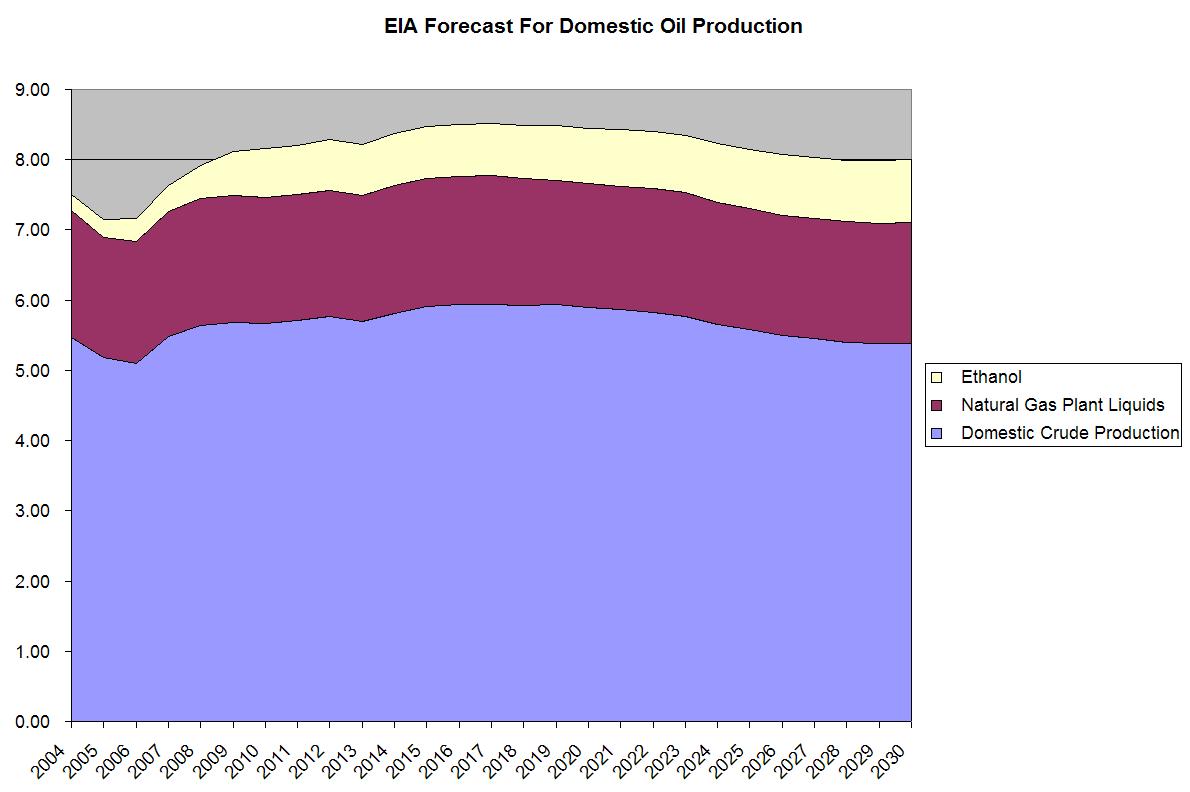
| EIA Forecast US Production (gross)in mbpd | EIA BTU Adjusted US Production in mbpd |
Above are the EIA oil production forecasts through 2030 for domestic US production. As can be seen the lower BTU content in NGPL and ethanol cause our governments gross production to be about 12% too high by BTU content.
But wait. It gets worse. Potentially much worse.
REASON #7 NET ENERGY MATTERS FAR MORE THAN GROSS ENERGY
Net energy analysis is little used and much misunderstood. Essentially, the economy is 100% dependent on energy to do work. The first law of thermodynamics states there is a finite amount of energy in a closed system – that capital, labor and technology cannot create more energy. Available energy must be used to transform existing resources (e.g., oil), or to divert existing energy flows (e.g., wind or solar) into more available energy.
The second law of thermodynamics posits that there is an energy loss at every step in the economic process. (for example – about 30% of the BTUs in internal combustion engines are ‘utilized’ the rest is dissipated as heat loss). An energy resource has to produce more energy than it uses, otherwise it becomes an energy sink. It takes about 735 joules of energy to lift 15 kg of oil 5 meters out of the ground just to overcome gravity -imagine how much energy is required to lift oil from 27,000 feet beneath the ocean (Jack II). The most concentrated and easiest accessible oil is produced as soon as technology and scale can access it; thereafter, more and more energy is required to locate, harvest, refine and and distribute oil. At some unknown point in the future, more energy will be required to find and procure oil than the energy recovered in the oil– and the “resource” will become a “sink”, irrespective of oil prices. I wrote a specific example of how declines in net energy would take away from productive sectors of society here.
This is theoretically illustrated in the below graphic from an upcoming paper in AMBIO.
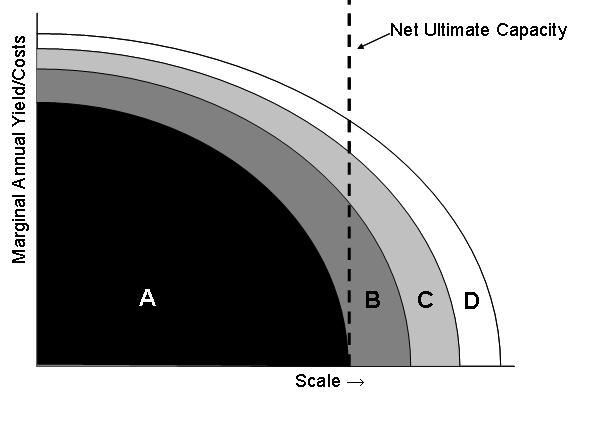
Graphic from Energy Return on Investment – Towards a Consistent Framework Mulder, K. and Hagens, N. forthcoming (Click to Enlarge)
The total ‘resource’ in the above graphic is the area A+B+C+D. It directly requires D energy to extract A+B+C+D energy. Extraction and distribution also requires indirect costs (like employees driving to work, health insurance, steel for the drillpipes, sandwich meat, etc.) This is energy cost C. As the scale of resource extraction increases, the ratio of A/(C+D) declines. Though conventional economics might not have done so, we also included cost B, which is the environmental externality costs of increased extraction. Once the scale of extraction reaches the point between A and B on the X axis, it takes more energy to produce the marginal unit than the marginal unit is worth. The ‘resource’ is still in the ground but is energetically unprofitable to produce. If at this point, (assuming one values the environmental tier B), an energy company uses its own stocks of energy to continue production, they do so at an energy loss, and would be better of selling or using their stored energy for other purposes.
As Richard Heinberg recently wrote about, an upcoming report from Energy Watch Group called “Coal: Resources and Future Production,” notes that:
Each coal class has a different energy content:
anthracite 30 MJ/kg
bituminous coal 18.8–29.3 MJ/kg
sub-bitiminous coal 8.3–25 MJ/kg
lignite 5.5–14.3 MJ/kg
and
“the authors of the report conclude that growth in total volumes (in USA) can continue for 10 to 15 years. However, in terms of energy content U.S. coal production peaked in 1998 at 598 million tons of oil equivalents (Mtoe); by 2005 this had fallen to 576 Mtoe.”
In other words, we can continue to grow the gross amount of resource, but the amount of BTUs available to do work has declined since 1998. (Ive not yet seen this report so dont know what to make of it, but illustrate the concept here so as to make declining net energy on oil and gas more easy to grasp.
WE NEED THE SAME TYPE OF ANALYSIS ON OIL AND GAS
Where does the oil ‘resource’ fall on this scale? It is difficult to say for certain. Analysis by Cutler Cleveland suggests that the net energy of oil (EROI-1) was over 100:1 in the 1930s when discovery peaked in the US. It dropped to 30:1 in the 1970s and has since fallen to 10-15:1. Once you account for refining the EROI declines to 5-10:1 Why does this matter? Well lets put it in its simplest terms. Lets for the moment assume that the energy inputs in oil extraction are completely oil and gas. This is actually not far from the truth:

Source Cutler ClevelandClick to EnlargeIn this example, if the world oil and gas industry is averaging a 10:1 energy gain, that means 10% of the worlds oil and gas is needed to procure the rest. If the net energy drops to 4:1, then 20% of the worlds oil and gas is needed to procure the other 80%. If the net energy drops to 3:1, which it eventually could, 25% of the worlds oil and gas will be needed to get the other 75% used by society. So clearly 85 million barrels a day doesn’t tell us the whole picture. Perhaps 50 million bpd at 20:1 net energy generates more ‘wealth’ for the world than 120mbpd of 5:1 oil – because an increasing part of the ‘gross resource’ will be required by oil companies before non-energy society ever sees it.
Most people think of net energy as some esoteric topic that has fleeting relevance to our energy predicament. However, as Joseph Tainter outlined, energy gain (or lack thereof) is critical to the functioning and expansion of society.(3) Many in the investment community are confused as to why energy prices are so high, yet many energy companies (particularly exploration) are struggling to show profits. One reason is their own higher energy use coupled with higher prices for everything in the last few years.
I dont have accurate net energy figures for current oil and gas exploration. (No one does, but it is sorely needed). If we use Professor Clevelands’ net energy figures for US exploration and production and linearly extrapolate the average EROI decline over the last 3 decades forward in time and then overlay it with the EIA forecast for US production, you’d get a graph that would look something like this!:
Total domestic oil projection (EIA)(1) in mbpd with sensitivity on net available to society (green)
As natural gas prices increase, the costs of petroleum extraction will also increase (which at least partially explains the higher cost numbers from E&P last year). If North America doesn’t get off the natural gas treadmill, there will start to be a strong positive feedback loop as natural gas is the largest energy input into petroleum extraction. More and more gas will be needed for exploration and production leaving less for plastic bags, fertilizers, and furnaces.
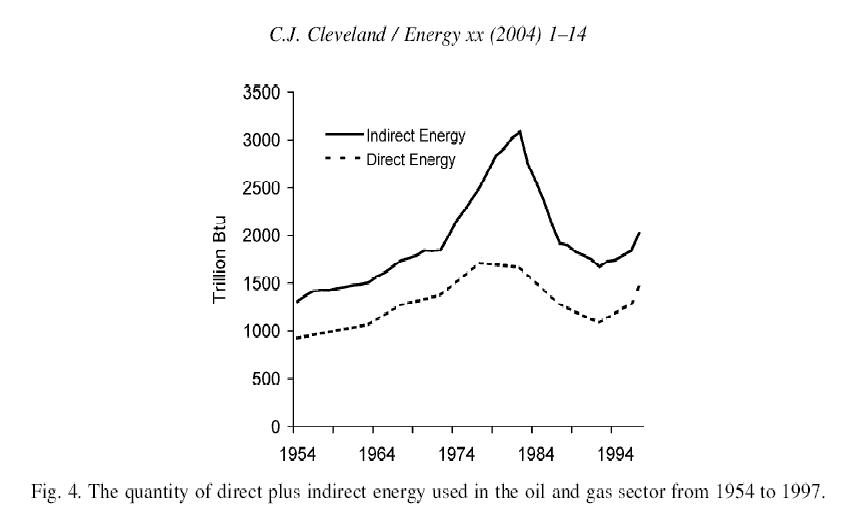
INDIRECT COSTS
Another aspect of net energy that is missed by most wall street analysts (in my opinion) is indirect costs. In addition to the direct electricity, natural gas, etc needed for E&P, there are also pipes, machinery, cement, lumber, steel, wires, tools, etc. As much energy that is used directly in the discovery and harvesting process, the indirect energy is even greater:
What does this all mean? It has two important implications. First, it suggests that the ‘total resource’ that gives CERA its confidence to delay the timing of Peak Oil, is not an apples and apples comparison of energy-many of the resources that make up their ‘stacked resource’ are not equivalent in terms of how much energy is left over for society. Second, and more worrisome, is the fact that as net energy of each fossil resource declines, a greater and greater % of its productive flows, will have to be used by the oil and gas companies themselves. This at a minimum robs economic growth and energy services from the rest of society and at a maximum, robs from both the economy and the environment, as energy companies seek out resources that have not yet become sinks (think Florida coast, ANWAR, etc)
SOME REAL LIFE DATA
There is some compelling and concerning pieces of evidence that tie together the last several paragraphs. Much of the expected growth in ‘oil’ in the coming decades comes from unconventional sources. The net energy of shale oil, tar sands, ethanol, etc is a fraction of that of historical crude production. Though a credible net energy study has yet to be done on tar sands, equity research on SUNCOR from John S Herold suggests it costs $30 a barrel to upgrade bitumen to oil. This presumably covers direct costs of the easier mining of bitumen as opposed to the in-situ production. If oil goes to $150 per barrel, will it still cost $30 to produce? Or do costs keep up with or outpace the commodity price? What happens if there is a cost blowout in Fort McMurray for housing, helicopters, services, raw materials, transportation, water, etc?
Before you look at the next graph, imagine how the above net energy information might translate into dollars, as net energy declines. As depleted regions require more energy to be productive, the costs should increase, and if we are approaching energy break even they should increase more than the commodity itself.
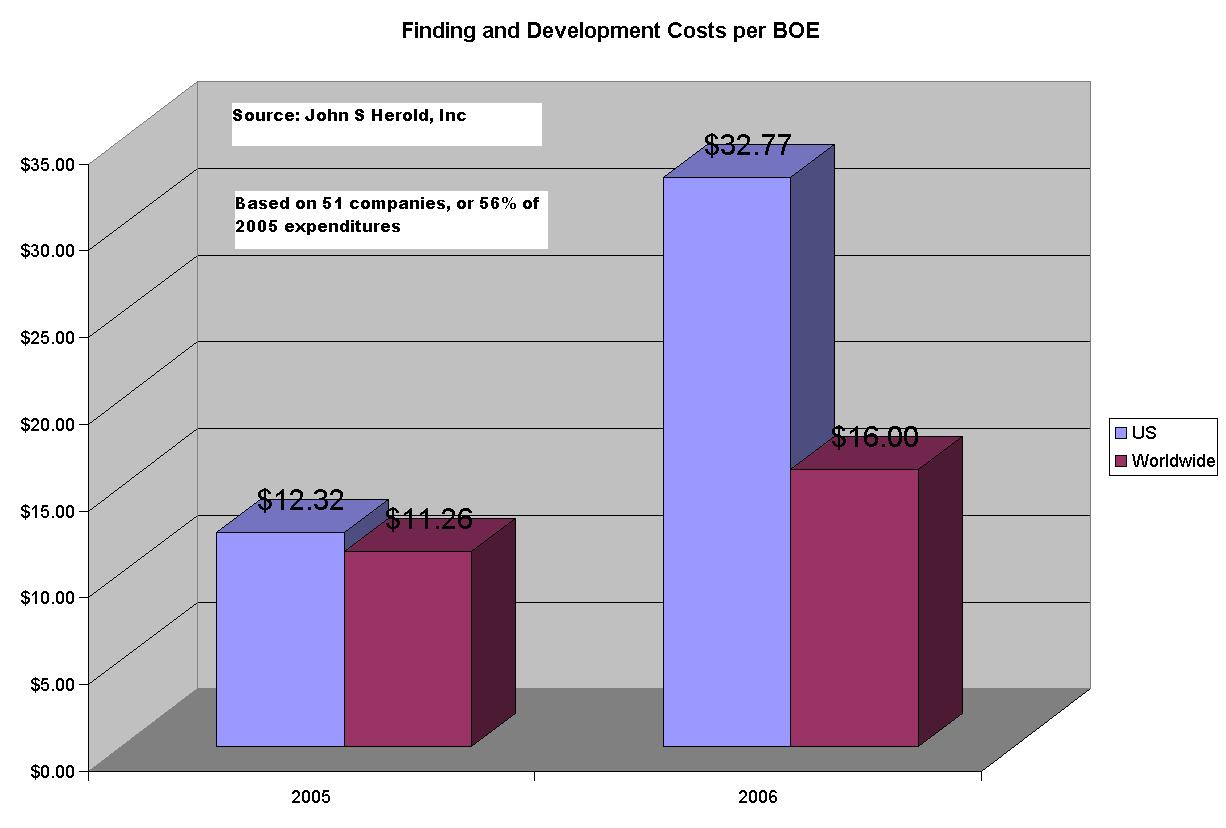
Finding and Development Costs per Barrel Oil Equivalent – Source – John S. Herold, IncClick to Enlarge
A FEW CLOSING WORDS ON NET ENERGY
Net energy analysis is not a purely physical principle, as the economy dictates how much energy it takes to make and deliver products that are used to procure energy. More efficient methods will result in higher net energy and vice versa. If the markets were perfectly functioning, devoid of subsidies and inclusive of environmental externalities, then in theory energy return would equate to financial return. But since the market is focused on the marginal barrel, if enough dollars exist to pay for production at a profit then those dollars will be printed. Net energy analysis holds moving pieces more constant than financial analysis (though the two can never totally be separated)
In sum, net energy analysis is important not only for comparing alternative energy technologies, but for determining how much energy out of our fixed pie is used by the energy sector. Since its the ‘net’ that we care about, it’s important that the energy data agencies move towards ‘net liquid fuel available to non-energy producing sectors’ as a measure of Peak Oil. Oil production and cost to society will increasingly be obfuscated as debt and credit become more significant drivers of growth. As such, we are highly likely to grow gross production, while net energy declines. The unawares will be focused on the gross, as usual.
As an important future exercise, I would like to analyze how much of the worlds 85 million barrels per day of oil (which we now know has a BTU content equal to 80 million) is used by the energy and utility companies finding and delivering the energy services to the rest of society. Is it 20%, 25%? Whatever % this is, I expect it to increase. If it increases, some other economic sectors use will decrease – hospitals? shopping centers? individual drivers? airplanes? Disneyland?
CONCLUSIONS
In the era of fossil fuel use and depletion, much uncertainty and confusion still exists in policy circles and the general public as to the urgency of the situation. CERA, historically respected in oil supply analysis, is in my opinion providing detailed maps to the wrong destinations. In the only category that really matters in the Peak Oil debate, net liquid fuel availability and cost to non-energy producing society, there is ample evidence suggesting that the peak in cheap oil, which society and institutions are built around, is already behind us. This is not a binomial equation. An imminent peak or a peak of affordable oil in 2040 (CERAs projection) have dramatically different risk profiles for society. The best case scenario brewed by conflating reserves with resources, net energy with gross energy, capacity with flow-rates and ignoring the environment makes for a sweet tasting drink. But should we be drinking it?
(**I admit the possibility that although I am looking 2 steps ahead CERA might be looking 3 steps ahead, meaning they are part of an intentional effort to make the 2040 peak message take hold, so that societal uncertainty and pell-mell policy doesn’t disrupt needed upstream investment. But I think it more likely they, and others, are just too narrowly focused in the boundaries of their analysis.)
Actual production can and will differ dramatically from productive capacity. To base decade lag time decisions (like changing transportation infrastructure to more electric, and relocalizing certain basic goods manufacturing) on best case scenarios is foolhardy. What is the risk reward scenario of such decisions? If CERA is right and we get to some 120 mbpd (net)of oil, all the better to use it for an early transition. If they are wrong or potentially WAY wrong, then the complacency in corporate circles from CERA and EIA optimism will mean we have missed our chance to prepare. To focus on a particular productive capacity or even flow rate are the wrong goals, because at 120 mpbd of lower quality/much more expensive oil, we will be stealing from both the environment and the economy. Using dollars to forecast costs is using a moving target. If tar sands are profitable at $32 with oil at $55, will the cost be $132 when oil is $155? Or even higher given wide boundary costs? Money, research and effort needs to go towards a better accounting and estimation of the energy costs of extracting our remaining fossil fuels.
This is the most important issue facing the 3 generations sharing the planet today. We are at a critical time for our nation and our world. Whether we make no changes, small changes or huge paradigm shifts in the direction of our policies and priorities is an open question, but one that will affect not only the environment and our children, but us as well.
THE BOTTOM LINE
1. Flow rates of liquid fuels available to non-energy society matter. Productive capacity means little.
2. Better technology is in a race with depletion, and so far is losing (declining net energy).
3. Focusing on energy return (gross minus energy cost) bypasses many of the moving pieces in project decision criteria inherent in financial analysis which increasingly includes debt/credit.
4. Modern society has been built around high energy density infrastructure. Declines in net energy, if not replaced, will have serious economic implications.
5. Declines in net energy, if replaced, must adhere to increasing limitations on other resources, particularly water, food, and waste absorption.
6. During the last 150 years, the market treated oil as a ‘near infinite resource’. Increasing awareness of many of the issues raised above means classic Hotelling analysis of resource owners acting to maximize rents may soon become a reality (e.g. Opec permanently restraining production, knowing they will get higher prices in the future)
7. The window to address these issues at a societal level is before net energy declines so much that half of us are working for Exxon. Oil at $80, $100, $120, etc. will increasingly price out sectors of the global economy, and eventually population.
To conclude, here is a hypothetical conversation between the head of an oil analysis company and the president of the United States circa 2020. It is one of many such possible conversations for a decade hence. As a citizen of the US or of the planet, how would you want to change it?
SOURCES
(1) EIA Annual Energy Outlook 2007
(2) US Department of Energy: Annual Energy Outlook, 1998 pg. 217
(3) Tainter, Joseph Resource Transitions and Energy Gain: Contexts of Organization Ecology and Society 2003
(4) Cleveland, CJ, “Net Energy from the Extraction of Oil and Gas in the United States
(5) Hubbert, M King. “On the Nature of Growth – Testimony on Hearing for National Energy Conservation Policy Act 1974” June 6, 1974
2 Responses to Nate Hagens “Peak Oil” – Why Smart Folks Disagree – Part II