On November 18, 1992 approximately 1700 scientists from around the world, and the majority of the Nobel Prize laureates in the sciences, signed the document titled ‘World Scientist’s Warning to Humanity‘.
WORLD SCIENTISTS’ WARNING TO HUMANITY
Human beings and the natural world are on a collision course. Human activities inflict harsh and often irreversible damage on the environment and on critical resources. If not checked, many of our current practices put at serious risk the future that we wish for human society and the plant and animal kingdoms, and may so alter the living world that it will be unable to sustain life in the manner that we know. Fundamental changes are urgent if we are to avoid the collision our present course will bring about.
THE ENVIRONMENT
The environment is suffering critical stress:
The Atmosphere
Stratospheric ozone depletion threatens us with enhanced ultra-violet radiation at the earth’s surface, which can be damaging or lethal to many life forms. Air pollution near ground level, and acid precipitation, are already causing widespread injury to humans, forests and crops.
Water Resources
Heedless exploitation of depletable ground water supplies endangers food production and other essential human systems. Heavy demands on the world’s surface waters have resulted in serious shortages in some 80 countries, containing 40% of the world’s population. Pollution of rivers, lakes and ground water further limits the supply.
Oceans
Destructive pressure on the oceans is severe, particularly in the coastal regions which produce most of the world’s food fish. The total marine catch is now at or above the estimated maximum sustainable yield. Some fisheries have already shown signs of collapse. Rivers carrying heavy burdens of eroded soil into the seas also carry industrial, municipal, agricultural, and livestock waste — some of it toxic
Soil
Loss of soil productivity, which is causing extensive Land abandonment, is a widespread byproduct of current practices in agriculture and animal husbandry. Since 1945, 11% of the earth’s vegetated surface has been degraded — an area larger than India and China combined — and per capita food production in many parts of the world is decreasing.
Forests
Tropical rain forests, as well as tropical and temperate dry forests, are being destroyed rapidly. At present rates, some critical forest types will be gone in a few years and most of the tropical rain forest will be gone before the end of the next century. With them will go large numbers of plant and animal species.
Living Species
The irreversible loss of species, which by 2100 may reach one third of all species now living, is especially serious. We are losing the potential they hold for providing medicinal and other benefits, and the contribution that genetic diversity of life forms gives to the robustness of the world’s biological systems and to the astonishing beauty of the earth itself.
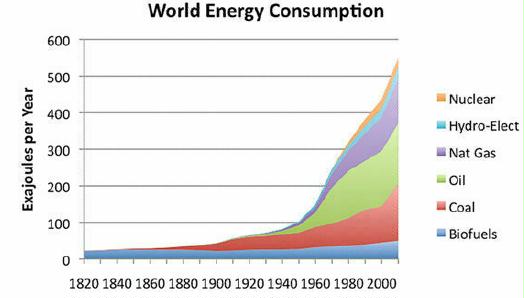
Much of this damage is irreversible on a scale of centuries or permanent. Other processes appear to pose additional threats. Increasing levels of gases in the atmosphere from human activities, including carbon dioxide released from fossil fuel burning and from deforestation, may alter climate on a global scale. Predictions of global warming are still uncertain — with projected effects ranging from tolerable to very severe — but the potential risks are very great.
Our massive tampering with the world’s interdependent web of life — coupled with the environmental damage inflicted by deforestation, species loss, and climate change — could trigger widespread adverse effects, including unpredictable collapses of critical biological systems whose interactions and dynamics we only imperfectly understand.
Uncertainty over the extent of these effects cannot excuse complacency or delay in facing the threat
POPULATION
The earth is finite. Its ability to absorb wastes and destructive effluent is finite. Its ability to provide food and energy is finite. Its ability to provide for growing numbers of people is finite. And we are fast approaching many of the earth’s limits. Current economic practices which damage the environment, in both developed and underdeveloped nations, cannot be continued without the risk that vital global systems will be damaged beyond repair.
Pressures resulting from unrestrained population growth put demands on the natural world that can overwhelm any efforts to achieve a sustainable future. If we are to halt the destruction of our environment, we must accept limits to that growth. A World Bank estimate indicates that world population will not stabilize at less than 12.4 billion, while the United Nations concludes that the eventual total could reach 14 billion, a near tripling of today’s 5.4 billion. But, even at this moment, one person in five lives in absolute poverty without enough to eat, and one in ten suffers serious malnutrition.
No more than one or a few decades remain before the chance to avert the threats we now confront will be lost and the prospects for humanity immeasurably diminished.
WARNING
We the undersigned, senior members of the world’s scientific community, hereby warn all humanity of what lies ahead. A great change in our stewardship of the earth and the life on it, is required, if vast human misery is to be avoided and our global home on this planet is not to be irretrievably mutilated.
WHAT WE MUST DO
Five inextricably linked areas must be addressed simultaneously:
1. We must bring environmentally damaging activities under control to restore and protect the integrity of the earth’s systems we depend on.
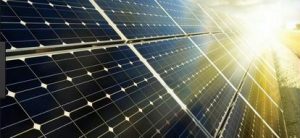
We must, for example, move away from fossil fuels to more benign, inexhaustible energy sources to cut greenhouse gas emissions and the pollution of our air and water. Priority must be given to the development of energy sources matched to third world needs — small scale and relatively easy to implement.
We must halt deforestation, injury to and loss of agricultural land, and the loss of terrestrial and marine plant and animal species.
2. We must manage resources crucial to human welfare more effectively.
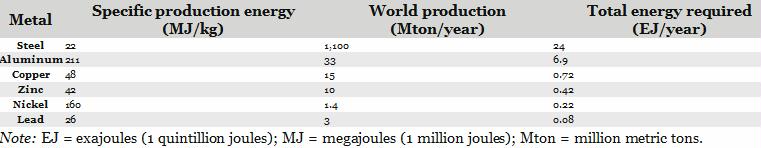
We must give high priority to efficient use of energy, water, and other materials, including expansion of conservation and recycling.
3. We must stabilize population. This will be possible only if all nations recognize that it requires improved social and economic conditions, and the adoption of effective, voluntary family planning.
4. We must reduce and eventually eliminate poverty.
5. We must ensure sexual equality, and guarantee women control over their own reproductive decisions.
The developed nations are the largest polluters in the world today. They must greatly reduce their overconsumption, if we are to reduce pressures on resources and the global environment. The developed nations have the obligation to provide aid and support to developing nations, because only the developed nations have the financial resources and the technical skills for these tasks.
Acting on this recognition is not altruism, but enlightened self-interest: whether industrialized or not, we all have but one lifeboat. No nation can escape from injury when global biological systems are damaged. No nation can escape from conflicts over increasingly scarce resources. In addition, environmental and economic instabilities will cause mass migrations with incalculable consequences for developed and undeveloped nations alike.
Developing nations must realize that environmental damage is one of the gravest threats they face, and that attempts to blunt it will be overwhelmed if their populations go unchecked. The greatest peril is to become trapped in spirals of environmental decline, poverty, and unrest, leading to social, economic and environmental collapse.
Success in this global endeavor will require a great reduction in violence and war. Resources now devoted to the preparation and conduct of war — amounting to over $1 trillion annually — will be badly needed in the new tasks and should be diverted to the new challenges.
A new ethic is required — a new attitude towards discharging our responsibility for caring for ourselves and for the earth. We must recognize the earth’s limited capacity to provide for us. We must recognize its fragility. We must no longer allow it to be ravaged. This ethic must motivate a great movement, convince reluctant leaders and reluctant governments and reluctant peoples themselves to effect the needed changes.
The scientists issuing this warning hope that our message will reach and affect people everywhere. We need the help of many.
We require the help of the world community of scientists — natural, social, economic, political;
We require the help of the world’s business and industrial leaders;
We require the help of the worlds religious leaders; and
We require the help of the world’s peoples.
We call on all to join us in this task.
==================================
NOBEL PRIZE WINNERS
Philip Anderson, Nobel laureate, Physics; USA
Christian Anfinsen, Nobel laureate, Chemistry; USA
Werner Arber, Nobel laureate, Medicine; Switzerland
Julius Axelrod, Nobel laureate, Medicine; USA
David Baltimore, Nobel laureate, Medicine; USA
Baruj Benacerraf, Nobel laureate, Medicine; USA
Georg Bednorz, Nobel laureate, Physics; Switzerland
Sune Bergstrom, Nobel laureate, Medicine; Sweden
Hans Bethe, Nobel laureate, Physics; USA
Michael Bishop, Nobel laureate, Medicine; USA
Konrad Bloch, Nobel laureate, Medicine; USA
Nicholaas Bloembergen, Nobel laureate, Physics; USA
Baruch Blumberg, Nobel laureate, Medicine; USA
Norman Borlaug, Agricultural Scientist, Nobel laureate, Peace; USA & Mexico
Adolph Butenandt, Nobel laureate, Chemistry; Fmr. President, Max Planck Inst.; Germany
Georges Charpak, Nobel laureate, Physics; France
Stanley Cohen, Nobel laureate, Medicine; USA
E. J. Corey, Nobel laureate, Chemistry, USA
John Cornforth, Nobel laureate, Chemistry; Great Britain
Jean Dausset, Nobel laureate, Medicine; France
Gerard Debreu, Nobel laureate, Economics; USA
Pierre-Gilles de Gennes, Nobel laureate, Physics; France
Johann Deisenhofer, Nobel laureate, Chemistry; Germany & USA
Renato Dulbecco, Nobel laureate, Medicine; USA
Manfred Eigen, Nobel laureate, Chemistry; Germany
Gertrude Elion, Nobel laureate, Medicine; USA
Richard Ernst, Nobel laureate, Chemistry; Switzerland
Val Fitch, Nobel laureate, Physics; USA
William Fowler, Nobel laureate, Physics; USA
Jerome Friedman, Nobel laureate, Physics; USA
Kenichi Fukui, Nobel laureate, Chemistry; Japan
Carleton Gajdusek, Nobel laureate, Medicine; USA
Murray Gell-Mann, Nobel laureate, Physics; USA
Donald Glaser, Nobel laureate, Physics; USA
Sheldon Glashow, Nobel laureate, Physics; USA
Roger Guillemin, Nobel laureate, Medicine; USA
Herbert Hauptman, Nobel laureate, Chemistry; USA
Dudley Herschbach, Nobel laureate, Chemistry, USA
Gerhard Herzberg, Nobel laureate, Chemistry; Canada
Antony Hewish, Nobel laureate, Physics; Great Britain
George Hitchings, Nobel laureate, Medicine; USA
Dorothy Crowfoot Hodgkin, Nobel laureate, Chemistry; Great Britain
Roald Hoffman, Nobel laureate, Chemistry; USA
Robert Holley, Nobel laureate, Medicine; USA
Francois Jacob, Nobel laureate, Medicine; France
Jerome Karle, Nobel laureate, Physics; USA
Henry Kendall, Nobel laureate, Physics; Chairman, Union of Concerned Scientists; USA
John Kendrew, Nobel laureate, Chemistry; Great Britain
Klaus von Klitzing, Nobel laureate, Physics; Germany
Aaron Klug, Nobel laureate, Chemistry, Great Britain
Leon Lederman, Nobel laureate, Physics; Chr., Amer. Assn. Adv. Sci.; USA
Yuan T. Lee, Nobel laureate, Chemistry; USA
Jean Marie Lehn, Nobel laureate, Chemistry; France
Wassily Leontief, Nobel laureate, Economics; USA
Rita Levi-Montalcini, Nobel laureate, Medicine; USA & Italy
William Lipscomb, Nobel laureate, Physics; USA
James Meade, Nobel laureate, Economics; Great Britain
Hartmut Michel, Nobel laureate, Chemistry; Germany
Brenda Milner, Neurologist, Academy of Sciences, Canada
Cesar Milstein, Nobel laureate, Medicine; Argentina & Great Britain
Franco Modigliani, Nobel laureate, Economics; USA
Nevill Mott, Nobel laureate, Physics; Great Britain
Joseph Murray, Nobel laureate, Medicine; USA
Louis Neel, Nobel laureate, Physics; France
Erwin Neher, Nobel laureate, Medicine; Germany
Marshall Nirenberg, Biochemist; Nobel laureate, Medicine; USA
George Palade, Nobel laureate, Physics; USA
Linus Pauling, Nobel laureate, Chemistry & Pence, USA
John Polanyi, Nobel laureate, Chemistry; Canada
George Porter, Nobel laureate, Chemistry; Great Britain
Ilya Prigogine, Nobel laureate, Chemistry; Belgium
Edward Purcell, Nobel laureate, Physics; USA
Tadeus Reichstein, Nobel laureate, Medicine; Switzerland
Burton Richter, Nobel laureate, Physics; USA
Frederick Robbins, Nobel laureate, Medicine; USA
Carlo Rubbia, Nobel laureate, Physics, Italy & Switzerland
Abdus Salam, Nobel laureate, Physics; President, Third World Academy of Sciences, Pakistan & Italy
Frederick Sanger, Nobel laureate, Chemistry; Great Britain
Melvin Schwartz, Nobel laureate, Physics; USA
Julian Schwinger, Nobel laureate, Physics; USA
Glenn Seaborg, Nobel laureate, Physics; USA
Kai Siegbahn, Nobel laureate, Physics; Sweden
Herbert Simon, Nobel laureate, Economics; USA
George Snell, Nobel laureate, Medicine; USA
Roger Sperry, Nobel laureate, Medicine; USA
Jack Steinberger, Nobel laureate, Physics; USA & Switzerland
Donnall Thomas, Nobel laureate, Medicine; USA
Jan Tinbergen, Nobel laureate, Economics; Netherlands
Samuel C. C. Ting, Nobel laureate, Physics; USA
James Tobin, Nobel laureate, Economics; USA
Alexander Todd, Nobel laureate, Chemistry; Great Britain
Susumu Tonegawa, Nobel laureate, Medicine; Japan & USA
Simon van der Meer, Nobel laureate, Physics; Netherlands & Switzerland
John Vane, Nobel laureate, Medicine; Great Britain
Harold Varmus, Nobel laureate, Medicine; USA
George Wald, Nobel laureate, Medicine; USA
E. T. S. Walton, Nobel laureate, Physics, Ireland
James Watson, Nobel laureate, Medicine; USA
Thomas Weller, Nobel laureate, Medicine; USA
Torsten Wiesel, Nobel laureate, Medicine; USA
Maurice Wilkins, Nobel laureate, Medicine; Great Britain
Geoffrey Wilkinson, Nobel laureate, Chemistry; Great Britain
PROMINENT INDIVIDUALS AMONG MORE THAN 1,500 SIGNATORIES
Anatole Abragam, Physicist; Fmr. Member, Pontifical Academy of Sciences; France
Carlos Aguirre President, Academy of Sciences, Bolivia
Walter Alvarez Geologist, National Academy of Sciences, USA
Viqar Uddin Ammad, Chemist, Pakistani & Third World Academies, Pakistan
Claude Allegre, Geophysicist, Crafoord Prize, France
Michael Alpers Epidemiologist, Inst. of Med. Research, Papua New Guinea
Anne Anastasi, Psychologist, National Medal of Science, USA
How Ghee Ang, Chemist, Third World Academy, Singapore
Mary Ellen Avery, Pediatrician, National Medal of Science, USA
Michael Atiyah, Mathematician; President, Royal Society; Great Britain
Howard Bachrach, Biochemist, National Medal of Science, USA
John Backus, Computer Scientist, National Medal of Science, USA
Achmad Baiquni, Physicist, Indonesian & Third World Academies, Indonesia
H. A. Barker, Biochemist, National Medal of Science, USA
Francisco J. Barrantes, Biophysicist, Third World Academy, Argentina
David Bates, Physicist, Royal Irish Academy, Ireland
Alan Battersby, Chemist, Wolf Prize in Chemistry, Great Britain
Germot Bergold, Inst. Venezolano de Investigaciones Cientificas, Venezuela
Daniel Bes, Physicist, Argentinean & Third World Academies, Argentina
Arthur Birch Chemist, Australian Academy of Science, Australia
David Mervyn Blow, Wolf Prize in Chemistry, Great Britain
Bert Bolin, Meteorologist, Tyler Prize, Sweden
Frederick Bormann, Forest Ecologist; Past President, Ecological Soc. of Amer.; USA
Raoul Bott, Mathematician, National Medal of Science, USA
Ronald Breslow, Chemist, National Medal of Science
Ricardo Bressani, Inst. of Nutrition, Guatemalan & Third World Academies, Guatemala
Hermann Bruck, Astronomer, Pontifical Academy of Sciences, Great Britain
Gerardo Budowski, Natural Resources, Univ. Para La Paz, Costa Rica
E. Margaret Burbidge, Astronomer, National Medal of Science, USA
Robert Burris, Biochemist, Wolf Prize in Agriculture, USA
Glenn Burton, Geneticist, National Medal of Science, USA
Sergio Cabrera, Biologist, Univ. de Chile, Chile
Paulo C. Campos, Medical scientist, Philippine & Third World Academies, Philippines
Ennio Candotti, Physicist; President, Brazilian Soc. Adv.of Science; Brazil
Henri Cartan, Wolf Prize in Mathematics, France
Carlos Chagas, Biologist; Univ. de Rio de Janeiro; Fmr. President, Pontifical Academy of Sciences; Brazil
Sivaramakrishna Chandrasekhar, Center for Liquid Crystal Research, India
Joseph Chatt, Wolf Prize in Chemistry, Great Britain
Shiing-Shen Chern, Wolf Prize in Mathematics, China & USA
Christopher Chetsanga, Biochemist, Affican & Third World Academies, Zimbabwe
Morris Cohen, Engineering, National Medal of Science, USA
Stanley N. Cohen, Geneticist, Wolf Prize in Medicine, USA
Mildred Cohn, Biochemist, National Medal of Science, USA
Hector Croxatto, Physiologist, Pontifical & Third World Academies, Chile
Paul Crutzen, Chemist, Tyler Prize, Germany
Partha Dasgupta, Economist, Royal Society, Great Britain
Ogulande Robert Davidson, Univ. Res. & Dev. Serv., African Acad., Sierra Leone
Margaret Davis, Ecologist, National Academy of Sciences, USA
Luis D’Croz, Limnologist, Univ. de Panama, Panama
Frederica de Laguna, Anthropologist, National Academy of Sciences, USA
Paul-Yves Denis, Geographer, Academy of Sciences, Canada
Pierre Deligne, Mathematician, Crafoord Prize, France
Frank Dixon, Pathologist, Lasker Award, USA
Johanna Dobereiner, Biologist, First Sec., Brazilian Academy of Sci.; Pontifical & Third World Academies, Brazil
Joseph Doob, Mathematician, National Medal of Science, USA
Heneri Dzinotyiweyi, Mathematician, African & Third World Academies, Zimbabwe
Samuel Eilenberg, Wolf Prize in Mathematics, USA
Mahdi Elmandjra, Economist; Vice President, African Academy of Sciences; Morocco
Paul Ehrlich, Biologist, Crafoord Prize, USA
Thomas Eisner, Biologist, Tyler Prize, USA
Mohammed T. El-Ashry, Environmental scientist, Third World Academy, Egypt & USA
Aina Elvius, Astronomer, Royal Academy of Sciences, Sweden
K. O. Emery, Oceanographer, National Academy of Sciences, USA
Paul Erdos, Wolf Prize in Mathematics, Hungary
Vittorio Ersparmer, Pharmacologist, Accademia Nazionale dei Lincei, Italy
Sandra Faber, Astronomer, National Academy of Sciences, USA
Nina Federoff, Embryologist, National Academy of Sciences, USA
Herman Feshbach, Physicist, National Medal of Science, USA
Inga Fischer-Hjalmars, Biologist, Royal Academy of Sciences, Sweden
Michael Ellis Fisher, Physicist, Wolf Prize in Physics, Great Britain & USA
Daflinn Follesdal, President, Norwegian Academy of Science;Norway
Otto Frankel, Geneticist, Australian Academy of Sciences, Australia
Herbert Friedman, Wolf Prize in Physics, USA
Konstantin V. Frolov Engineer; Vice President, Russian Academy of Sciences; Russia
Madhav Gadgil, Ecologist, National Science Academy, India
Mary Gaillard, Physicist, National Academy of Sciences. USA
Robert Gallo, Research Scientist, Lasker Award, USA
Rodrigo Gamez ,Instituto Nacional de Biodiversidad, Costa Rica
Antonio Garcia-Bellido, Biologist, Univ. Auto. Madrid, Royal Society, Spain
Leopoldo Garcia-Collin, Physicist, Latin American & Third World Academies, Mexico
Percy Garnham, Royal Society & Pontifical Academy, Great Britain
Richard Garwin, Physicist, National Academy of Sciences, USA
Georgii Georgiev, Biologist, Lenin Prize, Russia
Humam Bishara Ghassib, Physicist, Third World Academy, Jordan
Ricardo Giacconi, Astronomer, Wolf Prize in Physics, USA
Eleanor J. Gibson, Psychologist, National Medal of Science, USA
Marvin Goldberger, Physicist; Fmr. President, Calif. Inst. of Tech., USA
Maurice Goldhaber, Wolf Prize in Physics, USA
James Gowans, Wolf Prize in Medicine, France
Roger Green, Anthropologist, Royal Society, New Zealand
Peter Greenwood, Ichthyologist, Royal Society, Great Britain
Edward Goldberg, Chemist, Tyler Prize, USA
Coluthur Gopolan, Nutrition Foundation of India, Indian & Third World Academies, India
Stephen Jay Gould, Paleontologist, Author, Harvard Univ., USA
Herbert Gutowsky, Wolf Prize in Chemistry, USA
Erwin Hahn, Wolf Prize in Physics, USA
Gonzalo Halffter, Ecologist, Inst. Pol. Nac. ,Mexico
Kerstin Hall, Endocrinologist, Royal Academy of Sciences, Sweden
Mohammed Ahmed Hamdan, Mathematician, Third World, Academy, Jordan
Adnan Hamoui, Mathematician, Third World, Academy, Kuwait
A. M. Harun-ar Rashid, Physicist; Sec., Bangladesh, Academy of Sci., Bangladesh
Mohammed H. A. Hassan, Physicist; Exec. Sec., Third World Academy of Sciences; Sudan & Italy
Ahmed Hassanli, Chemist, African Academy of Sciences, Tanzania & Kenya
Stephen Hawking, Mathematician, Wolf Prize in Physics, Great Britain
Elizabeth Hay, Biologist, National Academy of Sciences, USA
Nick Holonyak, Electrical Engineer, National Medal of Science, USA
Lars Hormander, Wolf Prize in Mathematics, Sweden
Dorothy Horstmann, Epidemiologist, National Academy of Sciences, USA
John Houghton, Meteorologist; Chairman, Science Working Group, IPCC; Great Britain
Sarah Hrdy, Anthropologist, National Academy of Sciences, USA
Kenneth Hsu, Geologist, Third World Academy, China & Switzerland
Kun Huang, Physicist, Chinese Academy of Sciences, China
Hiroshi Inose, Electrical Engineer; Vice President, Engineering Academy; Japan
Turner T. Isoun, Pathologist, African Academy of Sciences, Nigeria
Carl-Olof Jacobson Zoologist; Sec-Gen., Royal Academy of Sciences; Sweden
Dorothea Jameson, Psychologist, National Academy of Sciences, USA
Daniel Janzen, Biologist, Crafoord Prize, USA
Cecilia Jarlskog, Physicist, Royal Academy of Sciences, Sweden
Louise Johnson, Biophysicist, Royal Society, Great Britain
Harold Johnston, Chemist, Tyler Prize, USA
Victor A. Kabanov, Chemist, Lenin Prize in Science, Russia
Robert Kates, Geographer, National Medal of Science, USA
Frederick I. B. Kayanja, Vice-Chnclr., Mbarara Univ., Third World Academy, Uganda
Joseph Keller, Mathematician, National Medal of Science, USA
Elisabeth Kessler, Royal Academy of Sciences, Sweden
Maung-U Khin, Pediatrician, Third World Academy, Myamnar & USA
Gurdev Khush, Agronomist, International Rice Institute, Indian Natl. Sci. Academy, India & Philippines
Susan Kieffer, Geologist, National Academy of Sciences, USA
E. F. Knipling, Agricultural Researcher, National Medal of Science, USA
Walter Kohn, Physicist, National Medal of Science, USA
Janos Kornai, Economist, Hungarian Academy of Science, Hungary
Aderemi Kuku, Mathematician, African & Third World Acads., Nigeria
Ikuo Kushiro, Geologist, Japan Academy, Japan
Devendra Lal, Geophysicist, National Science Academy, India
Gerardo Lamas-Muller, Biologist, Museo de Historia Natural, Peru
Torvard Laurent, Physiological chemist; President, Royal Academy of Sciences; Sweden
Sang Soo Lee, Physicist, Korean & Third World Academies, Rep. of Korea
Susan Leeman PharmacologistX National Academy of Sciences,USA
Luna Leopold, Geologist, National Medal of Science, USA
Louis Leprince-Ringuet, Physicist, French & Pontifical Academies, France
Vladilen Letokhov, Physicist, Lenin Prize in Science, Russia
Li Chang-lin, Environmental Sciences, Fudan University, China
Shan Tao Liao, Mathematician, Chinese & Third World Academies, China
Jane Lubchenco, Zoologist; President-Elect, Ecological Soc. of Amer.; USA
Christopher Magazda, Limnologist, African Academy of Sciences, Zimbabwe
Lydia Phindile Makhubu, Chemist, Third World & African Academies, Swaziland
Khursheed Ahmad Malik, Microbiologist, Pakistan & Third World Academies, Pakistan & Germany
Lynn Margulis, Biologist, National Academy of Sciences, USA
Paul Marks, Oncologist, National Medal of Science, USA
George Martine, Inst. for Study of Society, Population, & Nature; Brazil
Frederico Mayor, Biochemist; Dir. Gen., UNESCO, Spain & France
Ernst Mayr, Zoologist, National Medal of Science, USA
Maclyn McCarty, Wolf Prize in Medicine, USA
James McConnell, Physicist, Pontifical Academy of Sciences, Ireland
Digby McLaren, Past President, Royal Society of Canada; Canada
Jerrold Meinwald, Chemistry, Tyler Prize, USA
M. G. K Menon, Physicist; President, International Council of Scientific Unions; India
Gennady Mesiatz, Physicist; Vice President, Russian Academy of Sciences; Russia
Jan Michalski, Biologist, Polish Academy of Science, Poland
Andrei Monin, Oceanologist, State Prize, Russia
Marcos Moshinsky, Physicist, Pontifical Academy of Sciences, Mexico
Teruaki Mukaiyama, Chemist, Japan Academy, Japan
Walter Munk, Geophysicist, National Medal of Science, USA
Anne Murray, Ethnographer, Royal Academy of Sciences, Sweden
Noreen Murray, Biologist, Royal Society, Great Britain
Lawrence Mysak, Meteorologist; Vice President, Academy of Science, Royal Society of Canada; Canada
Jayant Vishnu Narlikar, Astrophysicist, Indian & Third World Academies, India
Anwar Nasim, Biologist, Third World Academy, Saudi Arabia
Kim Nasmyth, Biologist, Royal Society, Great Britain & Austria
James Neel, Geneticist, National Medal of Science, USA
Yuval Ne’eman, Physicist, Natl. Acad. of Sci. & Humanities, Israel
Oleg M. Nefedov, Chemist; Vice President, Russian Academy of Sciences; Russia
Yasutomi Nishizuka, Biochemist, Lasker Award, Japan
John S. Nkoma, Physicist, Third World Academy, Botswana
Paul Nchoji Nkvvi, Anthropologist, African Academy, Cameroon
Howard Odum, Ecologist, Crafoord Prize, USA
Bede Nwoye Okigbo, Agricultural Scientist; Dir., U.N. Unv.Pgm. Natrl. Res. in Afr.; Nigeria & Kenya
Ayub Khan Ommaya, Neurobiologist, Third World Academy, Pakistan & USA
Cyril Agodi Onwumechili, Physicist, Fmr. Pres., Nigerian Acad. of Sciences, Nigeria & Great Britain
Mary Jane Osborn, Microbiologist, National Academy of Scientists, USA
Yuri Ossipyan, Physicist; Vice President, Russian Academy of Sciences; Russia
Autzr Singh Paintal, Physiologist, Fmr. President, Indian National Science Academy, India
George Pake, Physicist, National Medal of Science, USA
Mary Lou Pardue, Biologist, National Academy of Sciences, USA
Barbara Pearse, Molecular Biologist, Royal Society, Great Britain
Muhammed Abed Peerally, Biologist, Third World Academy, Mauritius
Manuel Peimbert, Astronomer, Univ. Nac. Aut. de Mexico, Mexico
Roger Penrose, Mathematician, Wolf Prize in Physics, Great Britain
John Philip, Agricultural Science, Australian Academy of Science, Australia
Lilian Pickford, Physiologist, Royal Society, Great Britain
John R. Pierce, Electrical Engineer, National Medal of Science, USA
Giampietro Puppi, Physicist, Pontifical Academy of Sciences, Italy
Atta ur-Rahman, Chemist, Pakistani & Third World Academies, Pakistan
G. N. Ramachandran, Mathematician, Inst. of Science, India
Tiruppattur Ramakrishnan, Physicist, Indian & Third World Academies, India
Chintamani Rao, Inst. of Science, Indian and Pontifical Academies, India
Eduardo Rapoport, Ecologist, Third World Academy, Argentina
Marianne Rasmuson, Geneticist, Royal Academy of Sciences, Sweden
Peter Raven, Director, Missouri Botanical Garden; National Academy of Sciences, USA
Martin Rees, Astronomer, Royal Society & Pontifical Academy, Great Britain
Gerardo Reichel-Dolmatoff, Anthropologist, Columbian & Third World Academies, Columbia
Frederick Reines, Physicist, National Medal of Science, USA
Alexander Rich, Biologist, National & Pontifical Academies, USA
Ralph Riley, Wolf Prize in Agriculture, Great Britain
Claude Rimington, Inst. for Cancer Research, Norwegian Academy of Science, Norway
Gustavo Rivas Mijares, Engineer; Fmr. President, Academy of Sciences, Venezuela
Wendell Roelofs, Entomologist, National Medal of Science, USA
Betty Roots, Zoologist, Academy of Sciences, Canada
Miriam Rothschild, Biologist, Royal Society, Great Britain
Sherwood Rowland, Chemist; President, American Assoc for the Advancement of Science; USA
Janet Rowley, Physician, National Academy of Sciences, USA
Vera Rubin, Physicist, National Academy of Sciences, USA
Yuri Rudenko, Energy Research Inst., State Prize laureate, Russia
Elizabeth Russell, Jackson Laboratory, National Academy of Sciences, USA
Albert Sabin, Virologist, National Medal of Science, USA
Carl Sagan, Astrophysicist & Author, USA
Roald Sagdeev, Physicist, Russian & Pontifical Academies, Russia & USA
Ruth Sager, Geneticist, National Academy of Sciences, USA
Farrokh Saidi, Surgeon, Third World Academy, Iran
Jose Sarukhan, Biologist, Third World Academy, Mexico
Berta Scharrer,Neuroscientist, National Medal of Science, USA
Richard Schultes, Botanist, Tyler Prize, USA
Michael Sela, Weizmann Inst., Pontifical Academy of Science, Israel
Arne Semb-Johansson, Entomologist, Norwegian Academy of Science, Norway
Salimuzzaman Siddiqui, Chemist, Pontifical & Third World Academies, Pakistan
Thomas Silou, Biochemist, African Academy of Sciences, Congo
Alexej Sitenko, Physicist, Ukrainian Academy of Sciences, Ukraine
Jens Skou, Biophysicist, Royal Academy of Sciences, Denmark
Charles Slack, Agricultural Science, Royal Society, New Zealand
Alexander Spirin, Biologistn Lenin Prize, Russia
Earl Stadtman, Biochemist, National Medal of Science, USA
Thressa Stadtman, Biochemist, National Academy of Sciences, USA
Ledyard Stebbins, Geneticist, National Medal of Science, USA
Janos Szentgothai, Fmr. President, Hungarian Academy of Sciences; Hungary
Tan Jia-zhen, Geneticist, Shanghai Univ., China
Andrezej Tarkowski, Embryologist, Polish [text missing]
Valentine Telegdi, Wolf Prize in Physics, Switzerland
Kirthi Tennakone, Physicist, Third World Academy, Sri Lanka
Walter Thirring, Physicist, Austrian & Pontifical Academies, Austria
Cheng Kui Tseng, Oceanologist, Chinese & Third World Academies, China
Hans Tuppy, Biochemist, Austrian & Pontifical Academies, Austria
James Van Allen, Physicist, Crafoord Prize, USA
Martha Vaughan, Biochemist, National Academy of Sciences, USA
Henrik Wallgren, Zoologist, Society of Science & Letters, Finland
Prawase Wasi, Hematologist, Third World Academy, Thailand
Gerald Wasserburg, Geophysicist, Crafoord Prize, USA
Victor Weisskopf, Wolf Prize in Physics, USA
Diter von Wettstein, Physiologist, Royal Academy of Sciences, Denmark
Fred Whipple, Astronomer, National Academy of Sciences, USA
Gilbert White, Geographer, Tyler Prize, USA
Jerome Wiesner, Physicist, Fmr. President, Mass. Inst. of Tech., USA
Richard Willems, Geneticist, Estonian Biocentre, Estonia
Edward O. Wilson, Biologist, Crafoord Prize, USA
Lawrence A. Wilson, Agricultural Science, Third World Academy, Trinidad
Evelyn Witkin, Biologist, National Academy of Sciences, USA
Yang Fujia, Physicist, Chinese & Third World Academies, China
Alexander L. Yanshin, Geologist, Karpinsky Gold Medal, Russia
Yongyuth Yuthavong, Biochemist; Director, National Sci. & Tech. Devl. Agency, Thailand
Zhao Zhong-xian, Physicist, Chinese & Third World Academies, China
Zhou Guang-zhao, Physicist; President, Chinese Academy of Sciences;, China
Solly ZuckerInan, Zoologist, Royal Society, Great Britain
=========================================================
Over 1,500 members of national, regional, and international science academies have signed the Warning. Sixtynine nations from all parts of Earth are represented, including each of the twelve most populous nations and the nineteen largest economic powers. The full list includes a majority of the Nobel laureates in the sciences. Awards and institutional affiliations are listed for the purpose of identification only. The Nobel Prize in medicine is for physiology or medicine.