
[ The good news is that The IPCC has greatly exaggerated the amount of coal reserves we actually have
The scientists below find that the Intergovernmental Panel on Climate Change (IPCC) has greatly exaggerated coal reserves, so the IPCC scenario that business as usual leads to an RPC 8.5 scenario is highly unlikely to happen. Rutledge argues we’ll more likely see scenarios from RCP 2.6 to RCP 4.5.
Tad Patzek, a professor at the University of Texas, Austin, estimates carbon emissions from global coal production will decline by 50% by 2050. He estimates that 36 of the 40 different Intergovernmental Panel on Climate Change (IPCC) scenarios are far too high, with “20 of the 40 IPCC scenarios resulting in carbon emissions in the year 2100 that are 20 to 100 times the base-case here. The real problem [in 2050] will be an insufficient supply of fossil energy, not an overabundance. Most of the IPCC scenario writers accepted the common myth of 200–400 years of coal supply, and now their “eternal” (100 years plus) growth of carbon dioxide emissions is a commonly accepted social myth,” says Patzek. “The IPCC carbon estimates used by all major decision makers, are based on economic [growth] unconstrained by geophysics,” says Patzek.
Further proof: Just like oil, coal production also follows Hubbert’s Curve. In Patzek’s study “A global coal production forecast with multi-Hubbert cycle analysis,” he modified Hubbert’s method to allow for several bell curves to take into account coal mines all over the world and the different technologies they use. Other studies back his results up, as you can see in the papers cited below.
The remaining coal is of poor quality with low energy content. Just as we got the easiest, shallowest oil, so did we get the easiest, highest energy coal. More than half of the remaining coal reserves are poor quality soft coal (i.e. lignite), with an energy content only a third of anthracite. Remaining coal is often deep or thin-seamed. According to Richard Heinberg “In terms of the energy it yields, domestic coal production peaked in the late 1990s (more coal is being mined today in raw tonnage, but the coal is of lower and steadily declining energy content).”
Below are 9 studies, sometimes of them with excerpts. A link to the article is in the title if you want to read more.
Alice Friedemann www.energyskeptic.com author of “When Trucks Stop Running: Energy and the Future of Transportation”, 2015, Springer and “Crunch! Whole Grain Artisan Chips and Crackers”. Podcasts: KunstlerCast 253, KunstlerCast278, Peak Prosperity]
Rutledge, Dave. 22 April 2014. Coal and the IPCC and 2011 Estimating long-term world coal production with logit and probit transforms. International Journal of Coal Geology 85: 23-33.
The IPCC assumes a maximum coal production of 3,500 Gt by 2100, 5 times as high as my estimate. The World Coal Association reported the highest amount of reserves at 1038 Gt. The United Nations World Energy Council and British Petroleum estimate of world coal reserves is 890 Gt. Steve Mohr’s 2010 Hubbert linearization based on individual countries gave 702 Gt, and Patzek and Gregory Croft’s global multi-cycle Hubbert analysis gave 630 Gt.
I argue that future fossil-fuel CO2 emissions without any climate policy at all are likely to fall between those of the policy scenarios RCP 2.6 and RCP 4.5.
In the IPCC’s business-as-usual scenario, Representative Concentration Pathway (RCP) 8.5, coal accounts for half of future carbon-dioxide emissions through 2100, and two-thirds of the emissions through 2500. The IPCC’s coal burn is enormous, twice the world reserves by 2100, and seven times reserves by 2500. Coal so dominates that it is not an exaggeration to say that the IPCC and climate-change research programs depend on this massive coal burn for their existence. Without the threat of coal, the IPCC could close up shop and the research program funding would drop to a small fraction of what is spent on research in weather forecasting.
American Coal Reserves
Bituminous coal from the Illinois Basin reached peak coal production in 1977, yet stimates of Illinois’ proven reserves are still high—second only to Montana in the United States—even though coal production has declined to a little more than half of what was produced there 20 years ago (Patzek). Anthracite coal in the Central Appalachian Basin in 1917. Abot 60% of the original estimated coal reserves are in just 3 states, of which Wyoming produces 90% of this coal from the Powder River Basin (PRB). At the rate coal is being produced from 16 coal mines in the PRB, it’s likely peak coal production will be reached in 2015 (Stricker).
Coal is the bulwark of US energy production making up about a third of all energy produced and about half of its electricity generation capacity, over the last decade. Current energy policy in the Unites States assumes that there is at least a century of coal remaining within the nation that can be produced at the current rate of consumption. This assumption is based on the large reported coal reserves and resources. We show that, in coal-producing regions and nations, historically reported reserves are generally overestimated by a substantial magnitude. We demonstrate that a similar situation currently exists with US reserves. We forecast future US coal production, in both raw tonnage and energy, using a multi-cyclic logistic model fit to historical production data. Robustness of the model is validated using production data from regions within the US, as well as outside, that have completed a full production cycle. Results from the model indicate maximum raw tonnage coal production will occur in a time window between the years 2009 and 2023, with 2010 being the most likely year of such a maximum. Similarly, energy production from coal will reach a maximum in the years between 2003 and 2018, with 2006 being the most likely year of maximum occurrence. The estimated energy ultimate recoverable reserves (URR) from the logistic model is 2750 quadrillion BTU (2900 EJ) with 1070 quadrillion BTU (1130 EJ) yet to be mined, while the estimated raw tonnage URR is 124 billion short tons (112 Gt) with 52 billion short tons yet (47 Gt) to be mined. This latter value is merely a fifth of the long held estimate of 259 billion short tons (235 Gt) (Reaver)
Patzek, T., et al. 15 May 2010. A global coal production forecast with multi-Hubbert cycle analysis. Energy 35: 3109-22
Reaver, G.F., et al. 9-1-2014. Imminence of peak in US coal production and overestimation of reserves. Intl Journal of Coal Geology 131:90-105
Stricker, G.D., et al. 2009. Depletion of coal reserves and its effect on carbon dioxide emissions. 34th International Technical Conference on coal utilization and fuel systems: proceedings, coal Utilization and fuel systems.
Oil Limits and Climate Change – How They Fit Together April 11, 2014. Gail Tverberg. Our Finite World
Tverberg shows why fossil fuel use (and thus anthropogenic carbon emissions) will be at a little less than 40% of 2010 levels in 2030 — far lower than the best case IPCC projections RCP 2.6 scenario. This is because fossil fuels will be declining exponentially soon, and not just geologically, but for economic and political reasons as well.
November 2013. Peak Coal in America. This article makes the case we’ve got only 20 years of coal left, not 200 years.
Paige, S. Oct 29, 2013. Peak Oil May Keep Catastrophic Climate Change in Check. Scientists suggest that the highest possible pollution rates are unlikely. Scientific American.
Geological Society of America. Rutledge, D. 2013. Projections for Ultimate Coal production from production histories through 2012. Engineering and Applied Science, Cailfornia Institute of Technology
Rutledge shows evidence for the largest possible coal production leading to an RPC of 4.5, and lower than that if there are any societal disruptions like the fall of the Soviet Union. But the IPCC is projecting an RPC of 8.5 because they optimistically assume there are no resource limitations and don’t have a realistic understanding of proven reserves.
Despite many government programs to encourage alternative energy sources, the fraction of the world’s primary energy that is provided by fossil fuels has not budged from 85% since 1990. This is because rising wind, solar and biofuels have been offset by the decline in the share of nuclear energy. During the time the Kyoto Agreement was in effect from 1997 to 2012, world coal production rose 66%.
It is now clear that estimates of coal production are too high. In spite of a history of reserves over-estimation, RCP 8.5 (where RCP stands for representative concentration pathway) is the most commonly used for climate calculations which assumes a multiple of the reserves will be available for production.
[Rutledge shows that a more realistic range of ultimate coal production worldwide is 667-785 Gt, including the cumulative production through 2012 of 334 Gt leaving 333-450 Gt left to be mined. This compares with World Energy Council reserves plus cumulative production of 1,165 Gt.
Time estimates should be regarded as tentative because historical events like the collapse of the Soviet Union have changed the trends in the past. If the current trends continue, 90% of the coal would be produced by 2067.
Richard Heinberg and David Fridley. 18 November 2010. The end of cheap coal. Nature, vol 468 p 367-9
Below are excerpts from this paper:
New forecasts suggest that coal reserves will run out faster than many believe. Energy policies relying on cheap coal have no future.
We believe that it is unlikely that world energy supplies can continue to meet projected demand beyond 2020.
A spate of recent studies suggests that available, useful coal may be less abundant than has been assumed — indeed that the peak of world coal production may be only years away. One pessimistic study concluded that global energy derived from coal could peak as early as 2011.
In terms of energy output, US coal production peaked in the late 1990s (volume continued to increase, but the coal was of lower energy content).
Resources are exaggerated
A lot of coal is so difficult to get at it will probably remain in the ground. Much of China’s coal, over 90%, is from mines as much as 1,000 meters deep. We strongly suspect that the current reserves figures are too optimistic.
One way to estimate future production is to look at past production trends. This method was pioneered by geophysicist King Hubbert. Applying Hubbert analysis to coal, Chinese academics Tao and Li forecast that China’s production will peak and begin to decline long as early as 2025. A forecast by the Energy Watch Group, used a lower reserves figure of 114.5 billion tonnes to forecast a peak of production in 2015, with a rapid production decline commencing in 2020. During and after the period when production peaks, resource quality will dwindle and mining costs will rise, pushing up coal prices.
Coal consumption is accelerating fast, notably in China. This renders meaningless reserves-lifetime figures calculated on the basis of flat demand. A 2009 report from China’s Energy Research Institute forecast that coal demand would rise by 700 million to 1 billion tonnes by 2020, reducing the reserves lifetime to about 33 years. If coal demand grows in step with projected Chinese economic growth, the reserves lifetime would drop to just 19 years.
2013 Geological Society of America. Will Realistic Fossil Fuel Burning scenarios prevent catastrophic climate change? Tans, Pieter, National Oceanic and Atmospheric Administration, Earth Systems Research Laboratory.
Future emissions scenarios in the international assessments of climate change are driven almost entirely by demographic and socio-economic factors, with potential resource limitations assumed to be overcome by technological innovation. This session calls those scenarios into question. We consider it more realistic to expect future emissions to remain near the low end of the range considered by the International Panel on Climate Change, with the lower emissions forced on us rather than by a deliberate policy choice. A low emissions scenario will not prevent human-caused climate change, but will prevent worse outcomes that we may be able to predict better after we have experienced the 21st century. The reasons are fundamental: 1. The longevity of the CO2 enhancement in the atmosphere and oceans is thousands of years. 2. CO2 removal strategies require much energy. 3. The impact of enhanced greenhouse gases on the Earth energy balance is known accurately.
Patzek, Tadeusz W. et al. 15 May 2010. A global coal production forecast with multi-Hubbert cycle analysis. Energy 35: 3109-22
The most important conclusion of this paper is that the peak of global coal production from the existing coalfields is imminent [Patzek writes in 2012 that coal peaked energy-wise in 2011], and coal production from these areas will fall by 50% in the next 40 years. The CO2 emissions from burning this coal will also decline by 50%. Thus, current focus on carbon capture and geological sequestration may be misplaced. Instead, the global community should be devoting its attention to conservation and increasing efficiency of electrical power generation from coal.
The current paradigms of a highly-integrated global economy and seamless resource substitution will fail in a severely energy constrained world. e destination is downhill from the coal mine]
The global peak of coal production from existing coalfields is predicted to occur close to the year 2011. The peak coal production rate is 160 EJ/y, and the peak carbon emissions from coal burning are 4.0 Gt C (15 Gt CO2) per year. After 2011, the production rates of coal and CO2 decline, reaching 1990 levels by the year 2037, and reaching 50% of the peak value in the year 2047. Most of the IPCC scenario writers accepted the common myth of 200 to 400 years of coal supply, and now their “eternal” (100 years plus) growth of carbon dioxide emissions in turn is a part of the commonly accepted social myth.
The estimated CO2 emissions from global coal production will decrease by 50% by the year 2050. Between the years 2011 and 2050, the average rate of decline of CO2 emissions from the peak is 2% per year, and this decline increases to 4% per year thereafter.
Two IPCC scenarios peak in the year 1990, 3 in 2020, 3 in 2030, 3 in 2040, 13 in 2050, while in the 16 remaining scenarios coal production simply grows exponentially until the year 2100. Twenty out of the 40 IPCC scenarios result in carbon emissions in the year 2100 that are 20 to 100 times the base-case here. The real problem 40 years from 2009 will be an insufficient supply of fossil energy, not its overabundance, as the IPCC economists would have it.
Summary of coal production and CO2 emissions by largest coal-producing countries on the Earth.
| Country | EJ peak year (a) | Ultimate Coal Production (EJ) | Peak coal rate (EJ/Year) | Ultimate CO2 emissions (Gt) | Peak CO2 rate (Gt/y) |
| China | 2011 | 4015.6 | 75.8 | 365 | 6.9 |
| USA (b) | 2015 | 2756.7 | 26.8 | 250.5 | 2.4 |
| Australia | 2042 | 1714.5 | 23.5 | 155.8 | 2.1 |
| Germany/Poland | 1987 | 1104.4 | 14.9 | 100.4 | 1.4 |
| FSUc | 1990 | 1070.3 | 20.3 | 97.3 | 1.8 |
| India | 2011 | 862.6 | 13.6 | 78.4 | 1.2 |
| UK | 1912 | 753 | 7.7 | 68.4 | 0.7 |
| S. Africa | 2007 | 478.6 | 6.8 | 43.5 | 0.6 |
| Mongolia | 2105 | 279.2 | 3.2 | 25.4 | 0.3 |
| Indonesia | 2012 | 135.5 | 5.8 | 12.3 | 0.5 |
| Global ultimate/peak | 2011 | 13,170.50 | 160 | 1197 | 15 |
| (a) The peak of coal ton production and Energy (EJ) peak aren’t always the same | |||||
| (b) Excluding Alaskan coal | |||||
| (c) Former Soviet Union, excluding Russian Far East coal | |||||
Leslie Glustrom. March 18, 2013. The US Coal Industry—How Much Longer? NYU Coal Finance Workshop. Clean Energy Action, Boulder, CO
Glustrom estimates that we only have 10 years left for the coal industry, and maybe even less 3 to 5 years even, certainly not 20 years.
Charlie Hall: Leslie Glustrom’s presentation shows that although the enormous powder river formation indeed holds a lot of coal (hundreds of years at current rates), the depth of the seam deepens greatly from East (where the present mines are) to West so that the overburden (miner’s term for ecosystem) increases from 20 feet to 800 feet and that in 20 years you would have to mine 10 tons of overburden per ton of coal, which she does not think we will do due to the cost of the electricity needed to do that. I think she was talking about EROI without understanding that she was.
Below shows 2005 coal deliveries by region (red = Powder River Basin in Wyoming)
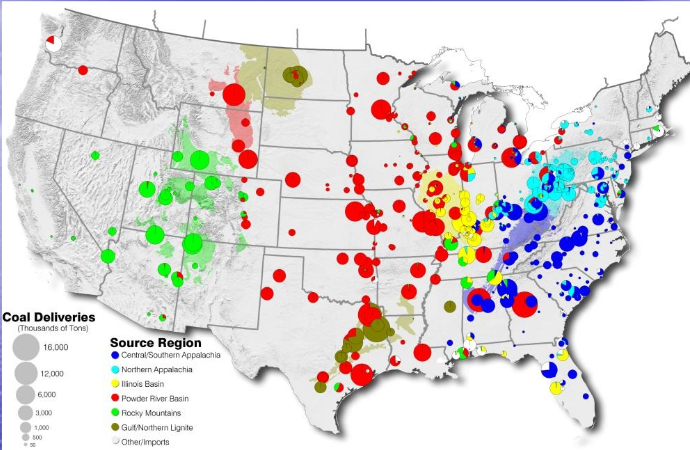
Most U.S. coal is buried too deeply to mine at a profit and the EIA has never analyzed their estimated recoverable reserves for economic recoverability. As a result our coal deposits are better classified as resources rather than reserves. And the current financial distress of U.S. coalmining companies weakens their ability to take on the investments they need to continue coal production
Powder River Basin, WY: coal powers 16 million U.S. households (over half of US coal comes from Wyoming)
- Black Thunder Mine Remaining Life: About 8 Years, Life Extension: About 7 Years, Current Overburden: 282 Feet, Expansion Overburden: 400+ Feet
- North Antelope/Rochelle Mine Remaining Life: About 6 Years, Life Extension: 10 Years, Current Overburden: 211 Feet, Expansion Overburden: 340+ Feet
Aug. 21, the federal government offered about 148 million tons of coal in Wyoming’s Powder River Basin for “lease” and no coal company bid to buy this coal — even though these coal “leases” are widely seen as essentially giving the public’s coal away.
In 2012 EIA US coal estimated recoverable “reserves” 258 Billion tons (table 15 EIA annual coal report)
A Key Source of the Confusion About US Coal Supplies — the EIA Has Been Publishing Reserve Data as Though They Contain Estimates of Economic Recoverability — When They Don’t
In 1997, the EIA acknowledged that its “Estimated Recoverable Reserves” did not include an estimate of economic recoverability stating: “The usual understanding of the term “reserves” as referring to quantities that can be recovered at a sustainable profit cannot technically be extended to EIA’s estimated recoverable reserves because economic and engineering data to project mining and development costs and coal resource market values are not available
Source: http://www.eia.doe.gov/cneaf/coal/reserves/chapter1.html
70% of the Coal In the Powder River Basin is Not Surface Accessible (Source: US DOE, DOI and DOA Inventory of Federal Coal Resources August 2007).
Signs that coal is peaking: costs are way up
- The cost of Eastern coal mining production has nearly doubled since 2005 ($42/ton) to $80/ton in 2012.
- Powder River Basin Mine production costs have bone from $7/ton to $13/ton from 2004 to 2012
- The cost of Eastern coal mining production has nearly doubled since 2005 ($42/ton) to $80/ton in 2012.
- Powder River Basin Mine production costs have bone from $7/ton to $13/ton from 2004 to 2012
- US coal costs went up 8.75% a year from 2004-2011
- Michigan delivered coal costs went up 10.81%/year 2004-2011
- Ohio delivered coal costs went up 8.19%/year 2004-2011
- Colorado delivered coal costs went up 8.53%/year 2004-2011
- West Virginia coal peaked in 1947
- Colorado coal peaked in 2004
- Wyoming probably peaked in 2008
Losses are way up
- Peabody $1 billion losses 2012 Q4
- Arch coal $700 million losses 2012 Q2 & Q4
- Alpha Natural resources $2 billion in losses 2012 Q2
As reported in Quarterly Earnings Reports and Annual 10-K Reports to the Securities and Exchange Commission
#1 Peabody (“BTU”) $418 Million Term Loan
- $ 912 Million Term Loan Facility
- $650 Million due 2016 (7.375%) $1.52 Billion due 2018 (6%)
- $650 Million due 2020 (6.5%) $1.34 Billion due 2021 (6.25%)
- $247 Million due 2026 (7.875%)
- Others due later …….
Total over $6 Billion in Debt…. From Peabody 2012 10-K Annual Report, page F-35
Alpha Natural Resources (“ANR”)
- $536 Million due 2015 (3.25%)
- $287 Million due 2015 (2.375%)
- $540 Million due 2016 (Term loan)
- $500 Million due 2018 (9.75%)
- $800 Million due 2019 (6%)
- $700 Million due 2021 (6.25%)
Total over $3 Billion in Debt
“ANR Poses Imminent Danger to Stockholders…”From Alpha Natural Resources 2012 10-K Annual Report
References
2010 Survey of Energy Resources. 2010. World energy Council. http://go.nature.com/hde5r7
2050 China Energy and CO2 Emissions Report (in Chinese). 2009. science Press
Campbell, C. J. & Laherrère, J. H. March 1998. The end of Cheap oil. Scientific American.
Coal Reserves of the Matewan Quadrangle, Kentucky. 2003. A Coal Recoverability Study. us bureau of Mines Circular 9355. USGS.
Energy Information Administration. Annual Energy Outlook 1998 (Doe/eia, 1997).
Heinberg, Richard. Feb 15, 2011. #225: Earth’s Limits: Why Growth Won’t Return. RichardHeinberg.com
Höök, M., et al. 2010. Global Coal production outlooks based on a logistic model. Fuel 89, 3546–3558
Luppens, J. et al. 2008. Assessment of Coal Geology, Resources, and Reserves in the Gillette Coalfield, Powder River Basin, Wyoming. open-File report 2008-1202 USGS.
Mohr, S. H. et al. 2009. Forecasting coal production until 2100. Fuel 88, 2059–2067
Patzek T. W. and Croft, G. 2010. “A Global Coal Production Forecast with Multi-Hubbert Cycle Analysis,” Energy, 35; pp 3109-3122
Rutledge, D. 2007. Hubbert’s Peak, The Coal Question, and Climate Change. http://rutledge.caltech.edu
Strategic Analysis of the Global Status of Carbon Capture and Storage. 2009. Global CCs institute, 2009.
Tao, Z. & Li, M. 2007. What is the Limit of Chinese Coal Supplies: A STELLA model of Hubbert Peak. Energy Pol. 35, 3145–3154
Ward, K. October 13, 2012. Coal’s decline forewarned Minable seams running out, experts say. West Virginia Gazette.
Zittel, W. et al. March 2007. Coal: Resources and Future Production. Energy Watch Group, Paper no. 1/07; http://go.nature.com/jngfsa