
Canning, P. 2010. Energy Use in the U.S. Food System. USDA Economic Research Report Number 94
Another great review of this article is Beyond Food Miles by Michael Bomford, a research scientist and extension specialist at Kentucky State University, an adjunct faculty member in the University of Kentucky Department of Horticulture
In 2007 the U.S. The United States economy used 100 quadrillion Btu of energy: 85% from fossil fuels, 8% nuclear fuel, 6% hydroelectric, 1% biomass, geothermal, solar, and wind.
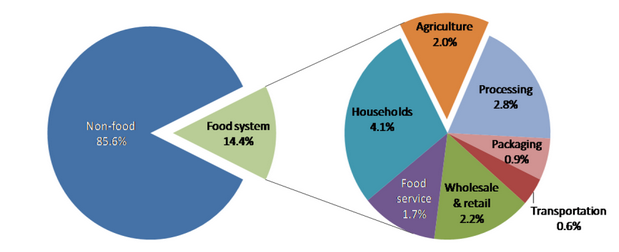
Pimentel et al., 2008, “Reducing Energy Inputs in the US Food System,” Human Ecology 36., reported that food used 19% of the national energy budget. Other researchers come up with different figures, because calculating energy use is complicated. This report concluded 14.4% [my summary below makes it clear why every report comes up with a different number, it’s an insanely complex system with so many components and variables to include or exclude, that no report will have the same figure].
Energy is used throughout the U.S. food supply chain, from the manufacture and application of agricultural inputs, such as fertilizers and irrigation; through crop and livestock production, processing, and packaging; distribution services, such as shipping and cold storage; the running of refrigeration, preparation, and disposal equipment in food retailing and food service establishments; and in home kitchens.
In addition, life cycle analyses were also done on the energy
- imported food (energy used by ships, barges, trains, trucks, fertilizers, etc)
- municipal waste disposal
- Water required: sewage systems and water services
The energy used to EXPORT food was NOT CONSIDERED IN THIS STUDY.
Energy used in a salad mix bought on the East Coast grown in California
The lettuce mix is just one of the 45,000 items sold in 140,000 supermarkets and 537,000 food and beverage service establishments in the USA in 2007. nationwide. Each of these purchased,
stored, prepared, cleaned, and disposed of food items.
- The farm California used a precision seed planter months before attached to a gas-powered farm tractor.
- Fertilizers and pesticides were trucked to wholesalers by diesel powered trucks.
- Local farmers drove in gas-fueled trucks to buy these fertilizers and pesticides.
- A diesel-powered broadcast spreader applied fertilizers, pesticides, and herbicides to the lettuce
- These nitrogen-based fertilizers, pesticides, and herbicides, were all made with natural gas and electricity
- The farms used electric-powered irrigation equipment throughout much of the growing period
- At harvest, field workers packed harvested vegetables in boxes produced at a paper mill
- The boxes were in gas-powered trucks to ship to a regional processing plant, where specialized machinery cleaned, cut, mixed, and packaged the salad mixes.
- Utility services at the paper mill, plastic packaging manufacturers, and salad mix plants use energy to produce the boxes used at harvest and the packaging used at the processing plant, and for processing and packaging the fresh produce.
- The packaged salad mix was shipped in refrigerated containers by a combination of rail and truck to an East Coast grocery store
- The grocery store kept the lettuce under constant refrigeration.
- To purchase this packaged salad mix, a consumer probably got there by car or mass transit.
- At home, the consumer refrigerated the salad mix a while before eating it.
- Dishes and utensils used to eat the salad may be placed in a dishwasher for cleaning and reuse—adding to the electricity use of the consumer’s household.
- Leftover salad may be ground in a garbage disposal and washed away to a wastewater treatment facility, or disposed, collected, and hauled to a landfill
Household measurements
26.7%: Electricity for cooking, cleaning, and food storage, 6.6% cooking (i.e. electric range, oven, microwave, toaster oven, and coffee makers), 14% refrigeration, 3.6 freezers; 2.5% dishwashers,
3% (in 2001) Cooking heat other than electricity (natural gas and liquid petroleum gas (LPG)
2% roughly Auto fuel for food-related personal transportation
Embodied energy in purchases of food storage, preparation, and serving equipment
Part of the embodied energy in purchases of automobiles, parts, and auto services (insurance and accessories were not included)
Table 5: Freight industry
Average miles 2007 Commodity
- 374 Fresh produce, oilseeds, and other horticulture
- 243 Meat, fish, and preparations
- 262 Milled grain products and preparations, and bakery products
- 230 Other prepared foodstuffs and fats and oils
Freight mode:
BTU’s 2007 Energy use by freight mode
23,260 Energy use per truck mile
14,990 Energy use per freight car rail mile
Sources: USDA, Economic Research Service using data from the U.S. Department of
Transportation (www.bts.gov), and U.S. Department of Energy (http://cta.ornl.gov/cta/).
Agriculture mechanization grew 10%, labor declined 30% between 1996 – 2006
With farm machinery use on the rise and use of agricultural chemicals roughly constant, energy services for the production of farm inputs may have increased steadily over the past decade.
References
Ayers, R.U., and A.V. Kneese. 1969. “Production, Consumption, and Externalities,” American Economic Review 59, No. 3, June, pp. 282-297.
Bullard, C., and R. Herendeen. 1975. “The Energy Costs of Goods and Services,” Energy Policy 1, No. 4 (Dec.), pp. 268-277.
Cawley, J. 2006. “Markets and Childhood Obesity Policy,” The Future of Children 16, No. 1, pp. 69-88.
Cutler, D.M., E.L. Glaeser, and J.M. Shaprio. 2003. “Why Have Americans Become More Obese?” Journal of Economic Perspectives 17, No. 3: pp. 93-118.
Heller, M.C., and G.A. Keoleian. 2000. Life Cycle-Based Sustainability Indicators for Assessment of the U.S. Food System, Center for Sustainable Systems Report No. CSS-0004, University of Michigan, December, http://css.snre.umich.edu/css_doc/CSS00-04.pdf
Hirst, E. 1974. “Food-Related Energy Requirements,” Science 184 (April 12), pp. 134-38.
Hoekstra, R., and J. Van Den Bergh. 2002. “Structural Decomposition
Analysis of Physical Flows in the Economy,” Environmental and Resource Economics 23, pp. 357-78.
Lane, J., Moss, P., Salzman, H., and Tilly, C. 2003. “Too Many Cooks? Tracking Internal Labor Market Dynamics in Food Service With Case Studies and Quantitative Data,” in Low-Wage America: How Employers Are Reshaping Opportunity in the Workplace, E. Appelbaum, A. Bernhardt,
and R.J. Murnane (eds.), Russell Sage Foundation, New York, NY.
Leontief, W. 1967. “An Alternative to Aggregation in Input-Output Analysis
and National Accounts,” Review of Economics and Statistics 49, No. 3, August, pp. 412-19.
Martinez, S. 2007. The U.S. Food Marketing System: Recent Developments, 1997-2006, Economic Research Report No. 42, USDA, Economic Research Service, May, www.ers.usda.gov/publications/err42/
Miller, R.E., and P.E. Blair. 1985. Input-Output Analysis: Foundations and Extensions, Prentice-Hall, Inc., Englewood Cliffs, NJ.
Oak Ridge National Laboratory, Center for Transportation Analysis. 2008. Transportation Energy Data Book: Edition 27, http://www-cta.ornl.gov/data/index.shtml
Pimentel, D., S. Williamson, C. Alexander, O. Gonzalez-Pagan, C. Kontak, and S. Mulkey. 2008. “Reducing Energy Inputs in the US Food System,” Human Ecology 36, pp. 459-471.
Rose. A., and S. Casler. 1996. “Input-Output Structural Decomposition Analysis: A Critical Appraisal,” Economic Systems Research 8, No. 1, pp. 33-62.
Stewart, H., N. Blisard, and D. Jolliffe. 2006. Let’s Eat Out: Americans Weigh Taste, Convenience, and Nutrition, Economic Information Bulletin No. 19, U.S. Department of Agriculture, Economic Research Service, October, www.ers.usda.gov/publications/eib19/
United Nations, European Commission, International Monetary Fund,
Organisation for Economic Co-operation and Development, and World
Bank. 2003. Handbook of National Accounting, Integrated Environmental
and Economic Accounting, Studies in Methods, Series F, No. 61, Rev. 1
(ST/ESA/STAT/SER.F/61/Rev.1).
U.S. Department of Commerce, U.S. Census Bureau. Annual Population
Estimates 2000 to 2008, www.census.gov/popest/states/NST-ann-est.html
U.S. Department of Commerce, U.S. Census Bureau. Historical National
Population Estimates: 1900 to 1999, www.census.gov/popest/
archives/1990s/
U.S. Department of Commerce, U.S. Census Bureau. Economic Census
2002, www.census.gov/econ/census02/
U.S. Department of Commerce, Bureau of Economic Analysis. NIPA Tables,
www.bea.gov/national/nipaweb/Index.asp
U.S. Department of Commerce, Bureau of Economic Analysis. Underlying
Detail – NIPA Tables, www.bea.gov/national/nipaweb/nipa_underlying/
SelectTable.asp
U.S. Department of Commerce, Bureau of Economic Analysis (BEA).
Benchmark Input-Output Accounts, www.bea.gov/industry/index.
htm#benchmark_io
U.S. Department of Energy, Energy Information Administration. 2008.
Annual Energy Review 2007, DOE/EIA-0384, June, www.eia.doe.gov/aer/
U.S. Department of Energy, Energy Information Administration. 2009.
Annual Energy Outlook, 2009, DOE/EIA-0383.
U.S. Department of Energy, Energy Information Administration. 2005 (and
previous years). Residential Energy Consumption Survey, http://www.eia.
doe.gov/emeu/recs/
U.S. Department of Labor, Bureau of Labor Statistics (BLS). Quarterly
Census of Employment and Wages (various years), www.bls.gov/cew/
U.S. Department of Labor, Bureau of Labor Statistics. Consumer
Expenditure Survey (various years), www.bls.gov/cex/
U.S. Department of Labor, Bureau of Labor Statistics. 2007. Women in the Labor Force: A Databook, Report 1002, September, www.bls.gov/cps/wlf-databook-2007.pdf
U.S. Department of Transportation, Federal Highway Administration.
Highway Statistics 2006, PB 2008, www.fhwa.dot.gov/policy/ohim/hs06/index.htm
U.S. Department of Transportation, Bureau of Transportation Statistics (USDOT). 2003. U.S. International Trade and Freight Transportation Trends, BTS03-02, www.bts.gov/publications/
us_international_trade_and_freight_transportation_trends
U.S. Department of Transportation, Bureau of Transportation Statistics (USDOT). 2008. 2007 Commodity Flow Survey: Preliminary, December, www.bts.gov/publications/commodity_flow_survey
U.S. Environmental Protection Agency (EPA). 2008. Municipal Solid Waste Generation, Recycling, and Disposal in the United States: Facts and Figures for 2007, EPA-530-F-08-018, November, www.epa.gov/osw