
Preface. The word “water” appears nowhere in this document, even though that’s a major limiting factor for CSP with thermal storage. Dry cooling is possible, but it lowers the EROI and raises the already way-too-high capital cost. An electric grid that’s mainly renewable can not exist without energy storage, but the low EROI, seasonality, extremely high capital cost, small class 5 region far from transmission, limited water in the Southwest, and lack of a national grid will limit CSP as a solution.
Alice Friedemann www.energyskeptic.com author of “When Trucks Stop Running: Energy and the Future of Transportation”, 2015, Springer, Barriers to Making Algal Biofuels, and “Crunch! Whole Grain Artisan Chips and Crackers”. Podcasts: Derrick Jensen, Practical Prepping, KunstlerCast 253, KunstlerCast278, Peak Prosperity , XX2 report
***
Notes from 2 National Renewable Energy Laboratory studies:
The Potential Role of Concentrating Solar Power in Enabling High Renewables Scenarios in the United States 2012
AND
Operation of Concentrating Solar Power Plants in the Western Wind and Solar Integration Phase 2 Study 2014
Concentrating solar power (CSP), when deployed with thermal energy storage, provides a dispatchable source of renewable energy.
Large-scale deployment of CSP faces a number of challenges—areas with the best direct normal solar resources are often in remote locations, and CSP faces increasing competition from solar photovoltaics (PV), which has fewer siting restrictions and is currently projected to have a lower overall levelized cost of electricity.
The results show that large-scale deployment of CSP (=10 GW) is dependent on some combination of substantially reduced costs and the use of its ability to provide grid flexibility.
The need for new transmission and the remote locations of CSP resources are key challenges for large-scale deployment of CSP. One important issue is the limited demand for electricity in states with good DNI resources. While states like California are large, the overall demand in the 6 states with excellent DNI resources (with at least some class 3 and above) is only about 12% of total U.S. demand in 2010 (EIA 2011). This requires increasing the use of CSP in regions with lower-quality resources or building long-distance transmission to send CSP generation to surrounding regions. This will likely require building greater connection between the Western and Eastern Interconnections as the Western Interconnection as a whole represents only about 18% of total U.S. demand. Furthermore, within the Western Interconnection, CSP obviously competes with high-quality PV resources, but it also competes with good-quality wind resources, the nation’s highest-quality geothermal resources, and existing hydro.
Two studies sponsored by the U.S. Department of Energy that were completed in 2012 evaluated the potential mix of renewable energy technologies that could serve a large fraction of the U.S. electricity demand and the associated evolution of the U.S. grid to 2050. The SunShot Vision Study evaluated the impact of low-cost solar technologies, while the Renewable Electricity Futures Study analyzed the grid benefits and impacts of providing up to 90% of the nation’s electricity from renewables.
Overall, the studies found a very large range of CSP deployment scenarios, ranging from essentially no new deployment in cases with no cost improvements, to over 100 GW in scenarios with aggressive cost reductions. While some of the scenarios evaluated CSP without storage, the analysis found very limited opportunities for this technology, especially considering projected decreases in PV costs.
But with thermal energy storage, combined with appropriate valuation of its grid flexibility benefits, there could be significant deployment opportunities. These opportunities are dependent on at least 3 factors: decreased cost, ability to deploy new transmission, and appropriate valuation of CSP flexibility.
This deployment will depend on new transmission to connect CSP into the existing grid to supply energy to the southwestern United States and California.
Very high penetration will require longer-distance transmission to supply a greater fraction of the Western Interconnection and exploit CSP resources that exist in western Texas and on the far western edge of the Eastern Interconnection.
In all scenarios, most of the development in the East is actually on the far western part of the interconnection. Constrained transmission disincentivizes CSP in the Western Interconnection because the cost of new transmission is tripled, eliminating the possibility of exports from the highest quality CSP resource regions.
Finally, large-scale deployment depends on recognition and valuation of CSP’s flexibility and capacity during the system planning process. This valuation is especially important in scenarios where the system becomes highly dependent on variable renewable sources, such as solar PV and wind, and the system requires generators capable of ramping rapidly over a large range of operation. An additional important consideration is the appropriate timing of investment in flexible generation resources, so they are available when less flexible sources of energy are introduced to the grid. Including the value of grid flexibility can produce an overall least-cost energy mix, as opposed to a mix of the lowest-cost energy sources that does not consider the interaction between multiple generation technologies
Overall the studies found a range of opportunities for CSP deployment, largely dependent on reduced technology costs, the ability to construct new transmission, and appropriate valuation of CSP capacity and flexibility, especially in scenarios where the system becomes highly dependent on variable renewable sources such as solar photovoltaics (PV) and wind.
The SunShot Vision study was designed to examine the impacts and benefits of achieving significant cost reductions in solar technologies. The SunShot Vision study used the National Renewable Energy Laboratory’s (NREL) Regional Energy Deployment System (ReEDS) (Short et al. 2011) and Solar Deployment System (SolarDS) (Denholm et al. 2009) models to develop and evaluate a reference scenario, assuming moderate solar energy price reductions, and the SunShot scenario, where the cost of solar energy is reduced by about 75% from 2010 to 2020,
For the SunShot scenario, solar technology installed system prices were assumed to reach the SunShot Initiative’s targets by 2020: $1.00/W for utility-scale PV systems, $1.25/W for commercial rooftop PV, $1.50/W for residential rooftop PV, and $3.60/W for CSP systems with up to 14 hours of thermal energy storage (TES) capacity.2
As with the SunShot Vision study, RE Futures used the ReEDS and SolarDS models to develop a set of reference and high renewable energy scenarios. The biggest single difference between the studies was the basis on which they deployed renewable energy. The SunShot Vision study developed generation mixes solely on an economic least-cost basis, though with an aggressive cost-reduction target for solar technologies. RE Futures set targets for renewable penetrations for the year 2050 (from 30% to 90% of all demand) and evaluated the resulting least-cost geographical deployment of all conventional and renewable generating technologies. Renewable sources essentially competed against each other for market share within this overall renewable requirement.
RE Futures explored a similar set of topics as the SunShot Vision study, such as resource availability, impact on system costs, environmental impacts and benefits, and basic grid operation. ReEDS represents the contiguous United States using 356 CSP/wind resource regions and 134 power control areas. This level of geographic detail enables the model to account for geospatial differences in resource quality, transmission needs, electrical (grid-related) boundaries, and political boundaries. ReEDS dispatches generation within 17 different time slices, including 4 time slices for each season representing morning, afternoon, evening, and nighttime, with an additional summer-peak time slice. This level of temporal detail—though not as sophisticated as an hourly chronological dispatch model—enables ReEDS to consider seasonal and diurnal changes in demand and resource availability. Because there are still significant demand and resource variations that can occur within each of these time slices, ReEDS utilizes statistical calculations derived from hourly data to estimate the capacity value and curtailment of variable wind and solar resources.
Implementation of Concentrating Solar Power CSP uses mirrors or lenses to concentrate sunlight and produce intense heat, which is used to produce electricity via a thermal energy conversion process similar to those used in conventional power plants. ReEDS models CSP plants both with and without TES.
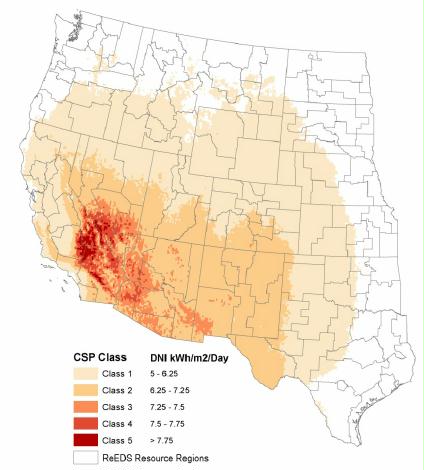
Figure 1. CSP resource in the United States (U.S. DOE 2012) Note: A small amount of class 1 resource in Florida is not shown. The resource data is translated into a typical DNI year (TDY) hourly resource dataset for representative sites of each CSP/wind resource region.
Because the goals of the CSP SunShot program are focused on dispatchable CSP, CSP without TES was not modeled in the SunShot scenario.
In addition to performance characteristics and costs, available land area (and corresponding capacity) was also established for each resource class. Figure 2 provides the availability of CSP at each CSP/wind resource region4 in the western United States (with a small amount of class 1 CSP available in southern Florida). This resource availability considers land unavailable for 5development based on a large set of exclusions, such as slope and environmental restrictions. After removing this excluded land, remaining area for each CSP resource class is converted into gigawatts of available capacity assuming a plant density of 31 MW/km2 for a system with a solar multiple of 2.6
Overall, the resource base in the United States for CSP is very large—after exclusions, about 7,500 GW, producing about 17,500 TWh of annual CSP electricity generation (more than four times the current U.S. annual demand) could be sited in seven southwestern states (NREL 2012).
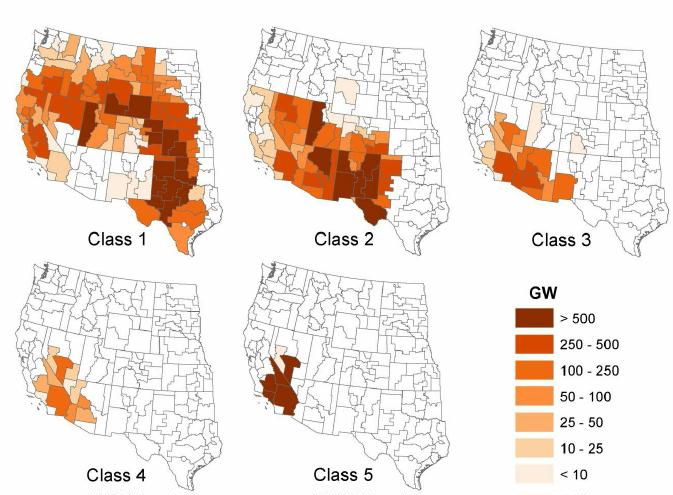
Figure 2. CSP available resource by class (for solar multiples of 2) (U.S. DOE 2012
CSP plants must be interconnected to the grid, often requiring new transmission. Based on the CSP resource data, a supply curve representing the cost of connecting individual CSP sites to the existing grid as well as to local demand centers was developed based on a geographic information system database of the resource, existing grid,7 and loads. Additional transmission may be built by ReEDS to enable CSP to provide energy over long distances, even across interconnections, when it is cost competitive compared to other options to provide energy, capacity, and flexibility. In addition to the transmission costs associated with the supply curves, a $120/kW fee for connection to the grid is applied to new CSP plants in ReEDS.
For conventional and non-solar renewable energy technologies, the SunShot scenario and the RE Futures RE-ITI scenario both assume price reductions as projected by Black & Veatch (2012). In the RE Futures RE-ETI scenario, greater renewable technology price reductions are assumed, while the RE-NTI scenario assumes no renewable technology price reductions.
RE Futures assumed substantial adoption of electric and plug-in hybrid-electric vehicles, with some flexibility of when charging occurs.
The primary driver behind the limited near-term growth is the relatively high delivered cost of energy from CSP, as well as limited value of its flexibility at low penetrations of variable generation.
At low penetrations of wind and PV, both sources are incorporated into the existing grid mix with limited additional need for system flexibility—the existing mix of generators is largely able to accommodate the additional variability and uncertainty. At low penetration, the energy value of wind and PV is relatively high, replacing higher-cost fuels with limited curtailment (Mills and Wiser 2012; Denholm et al. 2008). PV also has relatively high capacity value given its coincidence with demand patterns. Under these conditions, the firm capacity and dispatchability of CSP is less valuable, and it must compete essentially on a pure cost-of-energy basis.
As penetration of wind and solar PV increases, grid flexibility requirements also increase. Wind and PV begin to displace less valuable energy sources, and curtailment of these sources may increase (Denholm and Margolis 2007). Capacity value falls, particularly for PV where the demand peak is shifted to the early evening. Under these conditions, the dispatchability of CSP becomes more important, as the grid needs generation sources that can meet demand during the late afternoon and evening (Denholm and Mehos 2011). In both SunShot Vision and RE Futures, this occurs beyond the 2020 timeframe and coincides with projected decreasing costs of CSP technologies. The combination of flexibility requirements and lower-cost CSP corresponds to the significant increase in growth beginning in about 2025 for SunShot, and somewhat later in various RE Futures scenarios. A previous analysis of CSP deployment using the ReEDS model found similar results (Blair 2007).
In the Sunshot scenario, about 83 GW of CSP is installed by 2050, contributing about 8% of total U.S. electric demand.
The results show that large-scale deployment of CSP (=10 GW) is dependent on some combination of substantially reduced costs and the use of its ability to provide grid flexibility. In cases where CSP shows little performance improvement and the grid uses small amounts of variable generation, CSP faces a challenging economic environment, and ReEDS shows relatively little deployment. Overall, the fraction of generation contributed by CSP with storage varies greatly with the different scenarios and actually has the greatest range of contribution of all the technologies evaluated in the RE Futures study. This reflects the sensitivity of CSP to multiple factors
As a result of limitations of deploying CSP exclusively in the West, the highest CSP deployment cases developed substantial CSP resources outside the Western Interconnection, as illustrated in Table 2.
Table 2. Distribution of CSP Capacity in 2050 2050 Capacity (GW) Scenario West ERCOTa
Development occurs in the small part of New Mexico in the Eastern Interconnection, the Texas panhandle, Florida, and Oklahoma.
Figure 7 provides an example system dispatch in the Western Interconnection demonstrating the mix of generation sources used to meet load, as well as the significant net exports that occur even during periods of high demand. It also shows significant curtailment of renewable resources— largely solar generation in the middle of the day; this means that additional non-dispatchable solar (PV or CSP without storage) will largely be curtailed, particularly in high- solar/low demand periods in the spring.
350 300 Curtailment 250 Wind PV 200 CSP Hydropower 150 Gas CT Gas CC 100 Coal Other Nuclear50 Load
The dispatch results from GridView demonstrate three important aspects of CSP with TES. First, by shifting mid-day solar to later in the day, TES reduces renewable curtailment and increases the use of renewable energy, compared to cases without TES or other forms of electricity storage. Second, the dispatchability of CSP and its ability to rapidly ramp addresses the increase in variability created by PV and wind. Finally, CSP provides firm system capacity during the evening when the net load (load minus wind and PV generation) peaks.
Figure 8 illustrates the first two of these benefits during a four-day period in the spring. During these four days, the supply of renewable energy significantly exceeds demand during the middle of the day. Very large amounts of PV create an extremely low net load in the middle of the day, resulting in significant renewable curtailment. About 18% of potential renewable energy generation is curtailed in these four days, and this would be much higher if CSP generation were not able to shift a significant fraction of its generation to later in the day. The large mid-day generation from PV also creates a large upramp in evening demand, which is largely met by CSP, along with other dispatchable renewable and conventional generation sources.
Figure 10 provides a case in the Western Interconnection where wind provides about 31% of annual demand. This four-day period shows a more irregular net- load pattern due to the combined variability of both wind and PV. CSP provides a significant fraction of the net system flexibility to respond to the net demand.
Conclusions
Solar and wind represent the largest renewable resource base in the United States with the technical potential of either technology greatly exceeding the total demand for electricity. However, the variability and uncertainty of these resources requires an increasingly flexible grid at higher penetrations. Recent studies of high penetration renewable scenarios demonstrate the opportunity for the large-scale deployment of CSP with TES to provide a flexible and dispatchable source of energy. These studies find economic opportunities for CSP to provide a significant share of the nation’s generation mix. This deployment will likely depend on reduction in the cost of CSP compared to current costs. In all scenarios evaluated, limited CSP deployment is likely to occur at current costs on a pure economic basis. Achieving even partially the goals of the SunShot Initiative can potentially result in significant deployment. This will depend on two other factors. The first is significant new transmission development. This includes transmission development to connect CSP into the existing grid to supply energy to the southwestern United States and California. Very high penetration will require longer-distance transmission to supply larger areas of the Western Interconnection.
Transformational change, where CSP provides 10% or more of the nation’s electricity, will likely require expanded capacity between the Western Interconnection and Eastern Interconnection. The second factor is recognition and valuation of CSP’s flexibility and capacity value and consideration of this value during the system planning process. This includes appropriate timing of investment of CSP so its flexibility is available when less-flexible sources of energy are introduced to the grid. Including the value of grid flexibility can produce an overall least-cost energy mix, as opposed to a mix of the lowest-cost energy sources that does not consider the interaction between multiple generation technologies.
References
ABB, Inc. (2008). GridView User’s Manual, Version 6.0.
Black & Veatch. (2012). Cost and Performance Data for Power Generation Technologies. Overland Park, KS: Black & Veatch.
Blair, N. (2007). Concentrating Solar Deployment Systems (CSDS) – A New Model for Estimating U.S. Concentrating Solar Power Market Potential. NREL Report No. CP-640-41415. Golden, CO: NREL, 2 pp.
Brinkman, G.; Denholm, P.; Drury, E.; Ela, E.; Mai, T.; Margolis, R.; Mowers, M. (2012). Grid Modeling for the SunShot Vision Study. NREL Report No. TP-6A20-53310. Golden, CO: NREL, 38 pp.
Denholm, P.; Margolis, R. M. (2007). “Evaluating the Limits of Solar Photovoltaics (PV) in Traditional Electric Power Systems.” Energy Policy (35:5); pp. 2852–2861.
Denholm, P.; Margolis, R. M.; Milford, J. M. (2008). “Quantifying Avoided Fuel Use and Emissions from Solar Photovoltaic Generation in the Western United States.” Environmental Science and Technology (43:1); pp. 226–232.
Denholm, P.; Drury, E.; Margolis, R. (2009). Solar Deployment System Model (SolarDS): Documentation and Base Case Results. NREL/TP-6A2-45832. Golden, CO: NREL.
Denholm, P.; Mehos, M. (2011). Enabling Greater Penetration of Solar Power via the Use of Thermal Energy Storage. NREL Report No. TP-6A20-52978. Golden, CO: NREL.
EIA. (November 2011). Electric Power Annual 2010. Washington, DC: U.S. Energy Information Administration. Accessed September 18, 2012: http://www.eia.gov/electricity/annual/.
EIA. (2010). Annual Energy Outlook 2010: With Projections to 2035. DOE/EIA-0383(2010). Washington, DC: U.S. Energy Information Administration. Accessed September 18, 2012: http://www.eia.gov/oiaf/aeo/pdf/0383%282010%29.pdf.
Madaeni, S.M.; Sioshansi, R.; Denholm, P. (2011). Capacity Value of Concentrating Solar Power Plants. NREL/TP-6A20-51253. Golden, CO: NREL. Accessed September 18, 2012: http://www.nrel.gov/docs/fy11osti/51253.pdf.
Mills, A.; Wiser, R. (June 2012). Changes in the Economic Value of Variable Generation at High Penetration Levels: A Pilot Case Study of California. LBNL-5445E. Berkeley, CA: LBNL.
National Renewable Energy Laboratory. (2012). Renewable Electricity Futures Study. Hand, M.M.; Baldwin, S.; DeMeo, E.; Reilly, J.M.; Mai, T.; Arent, D.; Porro, G.; Meshek, M.; Sandor, D. eds. 4 vols. NREL/TP-6A20-52409. Golden, CO: National Renewable Energy Laboratory.
NREL. (2010). “System Advisor Model (SAM) Version 2010.4.12.” Accessed September 18, 2012: https://www.nrel.gov/analysis/sam/.
Short, W.; Sullivan, P.; Mai, T.; Mowers, M.; Uriarte, C.; Blair, N.; Heimiller, D.; Martinez, A. (2011). Regional Energy Deployment System (ReEDS). NREL/TP-6A20-46534. Golden, CO: NREL. Accessed September 18, 2012: http://www.nrel.gov/docs/fy12osti/46534.pdf.
U.S. Department of Energy (DOE). (2012). SunShot Vision Study. NREL Report No. BK-5200-47927; DOE/GO-102012-3037. Washington DC: U.S. Department of Energy.
Notes from 33 page: NREL. May 2014. Operation of Concentrating Solar Power Plants in the Western Wind and Solar Integration Phase 2 Study. National Energy Renewable Lab. Technical Report NREL/TP-6A20-61782 May 2014
The Western Wind and Solar Integration Study (WWSIS) explores various aspects of the challenges and impacts of integrating large amounts of wind and solar energy into the electric power system of the West.
The phase 2 study (WWSIS-2) is one of the first to include dispatchable concentrating solar power (CSP) with thermal energy storage (TES) in multiple scenarios of renewable penetration and mix. As a result, WWSIS-2 provides unique insights into CSP plant operation, grid benefits, and how CSP operation and configuration might need to change under scenarios of increased renewable penetration. Examination of the WWSIS-2 results indicates that in all scenarios CSP plants with TES provide firm system capacity, reducing the net demand and the need for conventional thermal capacity. The plants also reduced demand during periods of short-duration, high-ramping requirements that often require use of lower efficiency peaking units. Changes in CSP operation are driven largely by the presence of other solar generation, particularly photovoltaics (PV).
Use of storage by the CSP plants increases in the higher solar scenarios, with operation of the plant often shifted to later in the day. CSP operation also becomes more variable, including more frequent starts. Finally, CSP output is often very low during the day in scenarios with significant PV, which helps decrease overall renewable curtailment (overgeneration). However, the CSP plant configuration studied was not designed to minimize curtailment, implying further analysis of configuration is needed to understand the role of CSP in enabling high renewable scenarios in the western United States.
CSP with TES is a dispatchable source of renewable energy and can provide valuable grid flexibility services, including the ability to shift energy in time, rapidly change output, and provide firm capacity. The ability to store energy for later use can be particularly valuable in high renewable scenarios during periods when there is limited correlation between the natural supply of solar or wind energy and electricity demand.
Use of storage by the CSP plants increases in the higher solar scenarios, meaning a greater fraction of solar energy is stored for use later in the day. CSP operation becomes more variable, including more frequent starts. • In all scenarios, CSP plants generate at nearly full output during periods of peak net demand, providing high capacity value. • CSP plants are often ramped during periods of high variability of wind and solar, thereby reducing the ramping requirements of conventional thermal and hydroelectric generators. Combined with the high capacity value, this implies these plants provide a potentially significant source of grid flexibility. • CSP output is often very low during the day in the High Solar Scenario. This helps decrease overall renewable curtailment (overgeneration). However, the configuration studied may not be optimal for the High Solar Scenario, implying further analysis of CSP plant configuration is needed to understand its role in enabling high renewable scenarios in the western United States.1
WWSIS-1, released in May 2010, examined the viability, benefits, and challenges of integrating high penetrations of wind and solar power into the western grid. WWSIS-1 found it to be technically feasible if certain operational changes could be made, but it raised questions regarding the impact of cycling on wear-and-tear costs and emissions.
WWSIS-2 modeled four renewable scenarios in the U.S. portion of the Western Interconnection, including the TEPPC 2020 “base” scenario and three 33% renewable scenarios:
- TEPPC Scenario (9.4% wind, 3.6% solar)
- High Wind Scenario (25% wind, 8% solar)
- High Solar Scenario (8% wind, 25% solar)
- High Mix Scenario (16.5% wind, 16.5% solar).
Two unit-commitment cycles were simulated: a day-ahead (DA) “market” and 4-hour ahead (4HA) “market.” The DA market is used to commit units with long start times or high start costs (coal, nuclear, and biomass generators), using a 48- hour optimization horizon. The extra 24 hours in the unit commitment horizon (for a full 48-hour window) also helps properly schedule storage (including CSP with thermal storage).
Operation of CSP Plants to Provide Peak Capacity. One of the most significant benefits of CSP with TES is to provide firm system capacity by shifting energy to periods of peak demand.
It shows that the natural inflow of solar energy is not entirely coincident with demand, with an offset of about 4 hours. However, the use of storage enables the CSP plants to shift output to periods of highest net demand.
As greater amounts of wind and solar are added to the system, the timing of peak demand can shift, potentially increasing the importance of energy storage in CSP plants.
CSP Operation to Reduce Ramping Requirements. In addition to providing firm capacity, CSP can also replace the need for conventional generators to vary output during periods of high net load variability. This benefit occurs during all seasons, including periods with some of the highest instantaneous net load ramp rates (MW/minute) that occur near sunset on winter days. These ramp requirements are often associated with short duration peak periods. These winter peaks are much lower in magnitude than summer peaks, so typically do not drive peak capacity requirements. However, they often require the use of lower efficiency combustion turbines because the duration of the demand is not long enough to warrant starting a more efficient combined-cycle unit (exacerbated by the need for high ramp rates).
The increased ramp rates demonstrated in Figure 9 and Figure 10 must be met by dispatchable resources. In both the High Wind and High Solar Scenarios, CSP plants are often dispatched to meet demand during the period of highest net load, avoiding the use of other thermal generators, including lower efficiency combustion turbines. Figure 11 shows the CSP generation during the two-week periods that correspond to Figure 9 . It shows a very different mode of operation in response to system demand compared to the summer operation observed in Section 3.2. The overall availability of solar energy is lower, and the plants tend to operate in a fairly narrow window, primarily generating at nearly full output during the peak period. However, the plants also often carry over energy to the following day to meet the morning load peak. During the overnight hours the CSP plants either operate at minimum generation levels or shut down completely. Overall, unlike operation during the summer, CSP plants in the winter generate in a pattern anti-correlated with solar availability.
CSP Operation to Reduce Renewable Curtailment and Overgeneration, The WWSIS-2 scenarios demonstrate that spring presents the most difficult challenges in terms of potential curtailment. Curtailment is driven by a number of factors, including the coincidence of renewable supply with demand patterns as well as grid flexibility. Grid flexibility is driven by factors such as transmission capacity and generation mix, including the ability of conventional generators to ramp over a large range and at a high rate (NERC 2010). During the spring both wind and solar output can be relatively high, but mild weather produces some of the lowest load periods of the year.
Figure 12 shows the net load profiles for the week with the lowest net load of the year, which occurs at about 2 am on March 18 in the High Wind Scenario and at about noon on March 29 in the High Solar Scenario.
The net load drops rapidly and to low levels in the middle of the day, followed by a significant up-ramp as solar production drops. In these cases, the net load drops below what the grid can reliably meet with the installed generation mix. Wind or solar energy must be curtailed so that the conventional generation fleet can maintain generation at some minimal level. The actual generation from PV and wind allowed by the grid in the simulations is shown in Figure 13, which shows significant curtailment.
During periods of lowest net load, nearly all online thermal generation is generating at minimum stable levels around noon each day when PV output is the greatest but before load has peaked.
Significant solar energy is curtailed during the day as shown by the dotted line. This energy is curtailed partly because the start costs of coal generators do not justify turning them off in the morning and back on for the evening load peak.
In the High Solar Scenario, CSP plants in the spring tend to start up in the morning, using as much solar energy as is possible before the large amount of PV generation exceeds what the grid can accommodate due to system flexibility limits. At this point significant curtailment of solar energy begins to occur. CSP plants reduce output or even shut down during the middle of the afternoon and the CSP plant stores as much as possible. It should be noted that this operation is based on a plant utilizing direct storage, capable of sending all energy from the solar field to storage, even during times of high solar field output.
Figure 16 provides the average dispatch profile during the spring season in Arizona for the High Wind and High Solar Scenarios. It shows the CSP plant shifting as much energy as possible to the evening hours in an attempt to avoid curtailment. However, the ability of CSP to avoid curtailment is limited by the configuration of the CSP plant modeled in the study. In all scenarios, the CSP plant configurations are the same—a solar multiple of 2.0 with 6 hours of TES capacity. In this configuration only 3 hours of incident solar energy (at reference conditions) can be stored by the plant. While reference conditions typically do not occur for several hours, this limited storage capacity has a clear impact on the ability of CSP to shift energy during periods of low net demand. Because the modeled CSP plants cannot store a greater fraction of the incident solar energy, this leads to some production during periods of low demand (further reducing the net load) but also resulting in curtailment of CSP generation. (This explains why the area under the High Solar curve is lower than the High Wind curve.) This also introduces more frequent starts, with the average plant (of all plants in the study) increasing starts from about 1.4 times per day to about twice per day during this period.
Overall, these results indicate that CSP is a potentially important tool to avoid “over generation” events where renewable energy supply exceeds demand, considering grid flexibility limits. However, this will require further examination of different CSP plant configuration, as well as their associated costs and benefits. In the High Solar Scenario, a large fraction of CSP generation is curtailed in this spring period due to the limited thermal storage capacity and high solar multiple.
Increased storage capacity needs to be compared to its cost, particularly when this capacity might only be needed for a few weeks or months when the most significant mismatch between solar energy supply and demand patterns occur.
Variation in CSP plant operation is driven mostly by the increases in solar penetration. In the lower penetration of solar, optimal CSP operation is observed to be similar to previous analysis. This includes a “block” dispatch in the summer and a diurnal peaking dispatch in the winter.
In the higher penetration of solar cases, operation of CSP begins to shift to later in the day with greater use of energy storage, more frequent starts, and lower generation in the middle of the day. • In all scenarios evaluated, CSP plants are able to reduce the net peak demand, demonstrating high capacity credit and the potential ability to replace conventional capacity. • CSP plants with rapid ramping capability reduce the need for operation of peaking units during all seasons, including winter when short-term peaks are often observed. • CSP plants with TES can avoid curtailment of mid-day solar, which becomes more important with increased PV penetration. • The optimal configuration of a CSP plant can vary depending on the mix of renewable generators and grid flexibility requirements. In particular, as solar penetration increases and the net load becomes “peakier,” lower solar multiples might be needed to maximize the flexibility of CSP to effectively respond to system variability. This optimal configuration must be balanced against the increased cost of delivered energy due to lower utilization of the plant. This “net-benefit” will be addressed in future studies.
Overall, this study observed a number of quantifiable benefits of CSP with TES. However, several aspects of CSP’s ability to help integrate renewables (including both PV and wind) need further analysis to understand the potential contribution of CSP to overall system flexibility. In particular, the role of CSP in lowering minimum generation constraints and provision of fast ramping capability and other ancillary services will need further analysis in scenarios comparing CSP to other grid flexibility options.
References
Denholm, P.; Wan, Y.; Hummon, M.; Mehos, M. (2013). Analysis of Concentrating Solar Power with Thermal Energy Storage in a California 33% Renewable Scenario. P-6A20-58186. Golden, CO: National Renewable Energy Laboratory.
Denholm, P.; Hummon, M. (2012). Simulating the Value of Concentrating Solar Power with Thermal Energy Storage in a Production Cost Model. TP-6A20-56731. Golden, CO: National Renewable Energy Laboratory.
Denholm, P.; Mehos, M. (2011) Enabling Greater Penetration of Solar Power via the Use of Thermal Energy Storage. TP-6A20-52978. Golden, CO: National Renewable Energy Laboratory.
Lew, D.; Brinkman, G.; Ibanez, E.; Hodge, B.-M.; Hummon, M.; Florita, A.; Heaney, M.; Stark, G.; King, J.; Kumar, N.; Lefton, S.; Agan, D.; Jordan, G.; Venkataraman, S. (2013). The Western Wind and Solar Integration Study Phase 2. NREL/TP-5500-55588. Golden, CO: National Renewable Energy Laboratory.
GE Energy. (2010). Western Wind and Solar Integration Study. NREL/SR-5500-47434. Work performed by GE Energy, Schenectady, NY. Golden, CO: National Renewable Energy Laboratory. Accessed September 2013: www.nrel.gov/docs/fy10osti/47434.pdf.
Jorgenson, J.; Denholm, P.; Mehos, M.; Turchi, C. (2013). Estimating the Performance and Economic Value of Multiple Concentrating Solar Power Technologies in a Production Cost Model. TP-6A20-58645. Golden, CO: National Renewable Energy Laboratory.
Jorgenson, J.; Denholm, P.; Mehos, M.; (2014). Estimating the Value of Utility-Scale Solar Technologies in California Under a 40% Renewable Portfolio Standard. TP-6A20-61685. Golden, CO: National Renewable Energy Laboratory.
Madaeni, S.; Sioshansi, R.; Denholm, P. (2012). “How Thermal Energy Storage Enhances the Economic Viability of Concentrating Solar Power.” Proceedings of the IEEE (100:2); pp. 335–347.
Madaeni, S. H.; Sioshansi, R.; Denholm, P. (2012). “Estimating the Capacity Value of Concentrating Solar Power Plants: A Case Study of the Southwestern United States.” IEEE Transactions on Power Systems (27:2); pp. 1116–1124.
NERC (North American Electric Reliability Corporation). (2010). “Flexibility Requirements and Metrics for Variable Generation: Implications for System Planning Studies.” Princeton, NJ.
Sioshansi, R.; Denholm, P. (2010). “The Value of Concentrating Solar Power and Thermal Energy Storage.” IEEE Transactions on Sustainable Energy (1:3); pp. 173–183.
Short, W.; Sullivan, P.; Mai, T.; Mowers, M.; Uriarte, C.; Blair, N.; Heimiller, D.; Martinez, A. (2011). Regional Energy Deployment Systems (ReEDS). NREL/TP-6A20-46534. Golden, CO: National Renewable Energy Laboratory.