
[ To “see” declining EROI and the end of cheap energy, check out these photos of The Tallest structure ever moved by Mankind, a Norwegian natural gas offshore platform ]
Murphy, David J. December 2, 2013. The implications of the declining energy return on investment of oil production. Trans. R. Soc. A 2014 372
[This is a great paper on EROI, highly recommended. Without EROI studies, we risk building energy capturing contraptions that end up being useless, consuming more oil than generated, the Easter Island Heads of our former civilization. Alice Friedemann, energyskeptic.com]
Declining production from conventional oil resources has initiated a global transition to unconventional oil, such as tar sands. Unconventional oil is generally harder to extract than conventional oil and is expected to have a (much) lower energy return on (energy) investment (EROI). Recently, there has been a surge in publications estimating the EROI of a number of different sources of oil, and others relating EROI to long-term economic growth, profitability and oil prices. The following points seem clear from a review of the literature: (i) the EROI of global oil production is roughly 17 and declining, while that for the USA is 11 and declining; (ii) the EROI of ultra-deep- water oil and oil sands is below 10; (iii) the relation between the EROI and the price of oil is inverse and exponential; (iv) as EROI declines below 10, a point is reached when the relation between EROI and price becomes highly nonlinear; and (v) the minimum oil price needed to increase the oil supply in the near term is at levels consistent with levels that have induced past economic recessions. From these points, I conclude that, as the EROI of the average barrel of oil declines, long-term economic growth will become harder to achieve and come at an increasingly higher financial, energetic and environmental cost.
Introduction
Today’s oil industry is going through a fundamental change: conventional oil fields are being rapidly depleted and new production is being derived increasingly from unconventional sources, such as tar or oil sands and shale (or tight) oil. Indeed, much of the so-called ‘peak oil debate’ rests on whether or not these sources can be produced at rates comparable to the conventional mega-oil fields of yesterday.
What is less discussed is that the production of unconventional oil most likely has a (much) lower net energy yield than the production of conventional crude oil. Net energy is commonly defined as the difference between the energy acquired from some source and the energy used to obtain and deliver that energy, measured over a full life cycle (net energy=E(out)- E(in)). A related concept is the energy return on investment (EROI), defined as the ratio of the former to the latter (EROI=E(out)/E(in)). The ‘energy used to obtain energy’, E(in), may be measured in a number of different ways. For example, it may include both the energy used directly during the operation of the relevant energy system (e.g. the energy used for water injection in oil wells) as well as the energy used indirectly in various stages of its life cycle (e.g. the energy required to manufacture the oil rig). Owing to these differences, it is necessary to ensure that the EROI estimates have been derived using similar boundaries, i.e. using the same level of specificity for Ein. Murphy et al. [1] suggested a framework for categorizing various EROI estimates, and, where applicable, I will follow this framework in this paper.
Estimates of EROI are important because they provide a measure of the relative ‘efficiency’ of different energy sources and of the energy system as a whole [2,3]. Since it is this net energy that is important for long-term economic growth [3–6], measuring and tracking the changes in EROI over time may allow us to assess the future growth potential of the global economy in ways that data on production and/or prices cannot.
Over the past few years, there has been a surge in research estimating the EROI of a number of different sources of oil, including global oil and gas [7], US oil and gas [8,9], Norwegian oil and gas [10], ultra-deep-water oil and gas [11]and oil shale[12]. In addition, there have been several publications relating EROI to long-term economic growth, firm profitability and oil prices [3, 13–15].
The main objective of this paper is to use this literature to explain the implications that declining EROI may have for long-term economic growth. Specifically, this paper: (i) provides a brief history of the development of EROI and net energy concepts in the academic literature, (ii) summarizes the most recent estimates of the EROI of oil resources, (iii) assesses the importance of EROI and net energy for economic growth and (iv) discusses the implications of these estimates for the future growth of the global economy.
(a) A brief history of energy return on investment
In the late 1960s, Charles Hall studied the energy flows within New Hope Creek, in North Carolina, USA, to understand the migration patterns of the fish within the stream. His conclusions [16] revealed that, by migrating, the fish were able to exploit new sources of food, which, after accounting for the additional energy cost of migration, conferred a large net energy gain upon the fish. In other words, owing to the abundance of food in the new locations, the fish were able to gain enough energy not only to ‘pay’ for the energy expenditure of that migration but also to grow and reproduce. Comparing the energy gained from migration to the energy expended in the migration process was ostensibly the first calculation of EROI.
In the autumn of 1973 the price of oil skyrocketed following the Arab oil embargo (the so-called ‘first oil shock’), which sent most OECD economies tumbling into recession. The apparent vulnerability of OECD nations to spikes in the price of oil led many researchers to focus on the interaction between the economy and energy. Then, in 1974, the journal Energy Policy dedicated a series of articles to the energy costs of production processes. The editor of this series, Peter Chapman, began the series with a paper titled ‘Energy costs: a review of methods’, and observed that ‘this subject is so new and undeveloped that there is no universally agreed label as yet’ [17], and followed up two years later with a second paper [18]. Today this area of research is spread among a number of different disciplines, including, but not limited to, ecological economics, industrial ecology and net energy analysis, and the EROI statistic is just one of many indicators calculated.
Also during this period researchers started using Leontief input–output tables as a way to measure the use of energy within the economy [19–22]. For example, Bullard & Herendeen [23] used a Leontief-type input–output matrix to calculate the energy intensity (in units of joules per dollar) of every major industrial sector of the US economy. Even today this paper serves as a useful model for other net energy analyses [8,24]. In addition, a workshop in Sweden in 1974 and one at Stanford, CA, in 1975 formalized the methodologies and conventions of energy analysis [25,26].
In 1974, the US Congress enacted specific legislation mandating that net energy be accounted for in energy projects. The Nuclear Energy Research and Development Act of 1974 (NERDA) included a provision stating that ‘the potential for production of net energy by the proposed technology at the stage of commercial application shall be analyzed and considered in evaluating proposals’. Further influential papers by the Colorado Energy Research Institute, Bullardet al.and Herendeen followed this requirement [27–29]. Unfortunately, the net energy provision within the NERDA was never adopted and was eventually dropped.
In 1979, the Iranian revolution led to a cessation of their oil exports (the second oil shock), which precipitated another spike in the price of oil and squeezed an already strained US economy. Responding to this, and in an attempt to control deficits and expenditure, President Reagan of the USA enacted Executive Order 12291 in 1980. This order mandated that ‘regulatory action shall not be undertaken unless the potential benefits to society from the regulation outweigh the potential costs to society’.
In other words, all US regulatory action had to show a net monetary benefit to US society, and the idea of measuring benefits in terms of net energy fell even further from the policy arena.
Net energy analysis remained insignificant in US energy policy debates until the dispute over corn ethanol emerged 25 years later [30,31].
Although the political emphasis had now shifted towards economic analysis, the 1980s still provided useful papers on net energy analysis (e.g. [32]). In 1981, Hall published ‘Energy return on investment for United States petroleum, coal, and uranium’, which marked the first time that the acronym EROI was published in the academic literature [33]. Later that year, Hall & Cleveland [34] published ‘Petroleum drilling and production in the United States: yield per effort and net energy analysis’. This paper analyzed the amount of energy being produced per foot drilled and found that the ratio had been declining steadily for 30 years. Further publications by Hall and colleagues then tested hypotheses relating economic growth to energy use, introduced explicitly the concept of energy return on investment and examined the EROI of most major sources of energy [35,36].
Following growing concern about environmental impacts, climate change and sustainability, documented in the Brundtland Report in 1987 [37], emphasis began to shift from energy analysis to greenhouse gas (GHG) emissions and life-cycle analysis. Life-cycle analysis (LCA) itself was born out of the process and input–output analyses codified in the aforementioned energy literature of the 1970s and 1980s, and can be used to calculate EROI and other net energy metrics. Beginning around the turn of the century, researchers began to recognize the complementarity between LCA and net energy and began publishing on the matter [38].
There was another surge in publications in net energy analysis in the 2000s, due mainly to a growing global interest in renewable energy, and therefore an interest in metrics that compare renewable energy technologies. The debate about whether or not corn ethanol has an EROI greater than one is a good example [30,31]. There has also been a number of studies using the input–output techniques developed in the 1970s to track emissions production and/or resource consumption across regions [39].
Today, research within the field of net energy analysis is expanding rapidly. The main renewable energy options, including, but not limited to, solar photovoltaics, concentrating solar, wind power and biofuels, have each been the focus of studies estimating their net energy yield [31,40,41].
Furthermore, with the expansion of oil production into ultra-deep water, tar sands and other unconventional sources, as well as developments with shale gas, there has been a renewed interest in whether or not these sources of energy have EROI ratios similar to conventional oil and gas, and publications are expected to be forthcoming .
Recent estimates of the energy return on (energy) investment for oil and gas production
There has been a recent resurgence in EROI studies for liquid fuels, beginning with Cleveland [ 8], who estimated the EROI for oil and gas extraction in the US, Gagnon et al. [7], who estimated the same EROI for the whole world, and a number of additional studies that were contained in a 2011 special issue of the journal Sustainability. This section reviews the findings of these papers. Unless otherwise noted, all of the oil EROIs reported here are equivalent to the standard EROI (EROIstnd), as reported in Murphy et al. [1], which means that both the indirect and direct costs of energy extraction are included in the EROI calculation, but costs further downstream, such as transportation and refinement, have been omitted.
Cleveland [ 8]estimated two values for the EROI of US oil and gas that differed in the method of aggregating different types of energy carrier. The first method used thermal-equivalent aggregation, i.e. volumes of natural gas and oil are combined in terms of their heat content in joules. The second method uses a Divisia index, developed by Berndt [42], and uses both energy prices and consumption levels to adjust for the ‘quality’ of each energy carrier. Quality corrections are often used in energy analysis to adjust for the varying economic productivity of different energy carriers—for example, since electricity is more valuable, in terms of potential economic productivity, than coal, it is given more weight in the aggregate measure [43]. Quality-corrected measures better reflect the ability of energy carriers to produce marketable goods and services, so are arguably more useful.
The EROI values calculated using the energy quality-corrected data for US oil and gas production are consistently lower than those calculated from the non-quality-corrected data. This reflects the fact that many of the inputs to production are high-quality (i.e. high-priced) energy carriers such as electricity and diesel, while the outputs are unprocessed crude oil and natural gas.
Nevertheless, both estimates show the same trend over time: namely, an increase until the early 1970s, a decline until the mid-1980s, a slight recovery until the mid-1990s, followed again by decline (figure 1).
According to Cleveland, the overall downward trend from the 1970s till the mid-1990s is the result of higher extraction costs due to the depletion of oil in the USA. The up and down fluctuations within this aggregate trend are likely to be linked to changes in oil prices influencing the rate of drilling in the USA, with higher prices encouraging more drilling in less promising areas, which in turn leads to a lower yield and a lower aggregate EROI. Gagnon et al. [7] estimated the EROI for global oil and gas from 1992 to 2006 using the same energy aggregation techniques as Cleveland [8], i.e. both thermal equivalence and Divisia indices. In both cases, the EROI at the wellhead was around 26 in 1992 and increased to 35 in 1999 before declining to 18 in 2006 (figure 1).
It is not surprising that the EROI for global oil and gas is higher than that for the USA considering that oil production peaked in the USA in 1970 due mainly to the depletion of its biggest oil fields, while global production continued to flow and even increase from the mega-oil fields of the Persian Gulf.
US producers are increasingly reliant upon smaller and poorer-quality fields in difficult locations (e.g. deep water) together with the enhanced recovery of oil from existing fields—all of which are relatively energy intensive. In contrast, most OPEC members are still producing oil from high-quality supergiant fields.
The first few years of the Gagnon dataset and the last few years of the Cleveland dataset overlap in the early 1990s and both show a general increasing trend. The results from Gagnon et al. [7] then show that the increase in the early 1990s reaches a maximum in 1999, followed by a monotonic decline through the 2000s. Much like the Cleveland paper, Gagnon et al. assume that the decline is due to the depletion of easy access resources, but, as mentioned earlier, this trend also could be dependent on the trend in oil prices.
In addition to the estimates of Cleveland [ 8] and Gagnon et al. [7], Guilford et al. [9] estimated the non-quality-corrected EROI of conventional oil and gas production for the USA. They found that the EROI of oil production has declined from a peak of 24 in the 1950s to roughly 11 in 2007 (figure 1). By deriving separate estimates for exploration and production, they show how depletion reduces the rate of production from existing fields and gives incentives for increased exploration for new fields, both of which lower the aggregate EROI. They also suggest that natural gas is subsidizing oil production and that the EROI for oil alone is likely to be much lower.
![Figure 1. EROI estimates from three sources, Gagnon et al. [7], Cleveland [8] and Guilford et al. [9]. The Gagnon et al. [7] data represent estimates of the EROI for global oil and gas production using aggregation by Divisia indices. The Cleveland [8] data represent the trend in EROI values for US oil and gas production calculated using the Divisia indices to aggregate energy units. The Guilford et al. [9] data represent estimates of the EROI of US oil production from 1919 to 2007](https://energyskeptic.com/wp-content/uploads/2015/06/murphy-2013-figure-1-EROI-decline-global-oil-prd.jpg)
Figure 1. EROI estimates from three sources, Gagnon et al. [7], Cleveland [8] and Guilford et al. [9]. The Gagnon et al. [7] data represent estimates of the EROI for global oil and gas production using aggregation by Divisia indices. The Cleveland [8] data represent the trend in EROI values for US oil and gas production calculated using the Divisia indices to aggregate energy units. The Guilford et al. [9] data represent estimates of the EROI of US oil production from 1919 to 2007
Despite differences in coverage and approach, the results from these three studies are broadly consistent, namely a general increase in EROI until 1970, then a general decline until the early 1980s, an increase through the mid-1990s and then a decline.
Grandell et al. [10] estimated the EROI of oil production from Norwegian oilfields to be roughly 20 in
- They also note that as the fields deplete they expect the EROI to decline further. Brandt [44] estimatedthattheEROIfromCalifornianoilfieldshasdeclinedfromover50 in the 1950s to under 10 by the mid-2000s. Similarly, Hu et al. [45] estimated that the EROI from the Daqing oil field, the biggest oil field in China, had declined from 10 in 2001 to 6.5 by 2009.
Two other recent EROI estimates of particular importance are those of Moerschbaecher & Day [11], who estimated the EROI of ultra-deep-water (depths greater than 1524 m or 5000 feet) production in the Gulf of Mexico, and Cleveland & O’Connor [12], who estimated the EROI of oil shale production.
Moerschbaecher & Day [11] estimated the EROI for deep-water oil production to be between 7 and 22. The range in EROI values is due to a sensitivity analysis performed by the authors that incorporated three different energy intensity values as proxies for the energy intensity of the ultra-deep-water oil industry. They also noted that, owing to the large infrastructure requirements of the deep-water oil industry, the real value is probably closer to the lower end of the range presented.
Cleveland & O’Connor [12] estimated that the EROI for oil shale production using either surface retorting or in situ methods was roughly 1.5, much lower than for other unconventional resources. Oil shale is the production of oil from kerogen found in sedimentary rock and is distinct from ‘shale oil’ or, preferably, ‘tight oil’, which is oil trapped in shale or other impermeable rock. Oil shale is discussed here because the western USA has vast resources of oil shale, but production costs are much higher than for other forms of unconventional oil [46].
The following summarizes the aforementioned studies:
- EROI 11: average for US oil production today, down from roughly 20 in the early 1970s
- EROI 17: global average, down from EROI of roughly 30 in 2000
- EROI 10: ultra-deep-water oil production is probably less than 10
- EROI 1.5: Oil shale (kerogen), not tight oil (aka ‘shale’ oil)
Energy return on (energy) investment, oil prices, and economic growth
The economic crash of 2008 occurred during the same month that oil prices peaked at an all-time high of $147 per barrel, leading to numerous studies that suggested a causal link between the two [47,48]. In addition, other researchers involved in net energy analysis began examining how EROI relates to both the price of oil and economic growth [3,13,15,49–51].
Murphy & Hall [3] examined the relation between EROI, oil price and economic growth over the past 40 years and found that economic growth occurred during periods that combined low oil prices with an increasing oil supply. They also found that high oil prices led to an increase in energy expenditures as a share of GDP, which has led historically to recessions. Lastly, they found that oil prices and EROI are inversely related (figure 2), which implies that increasing the oil supply by exploiting unconventional and hence lower EROI sources of oil would require high oil prices. This created what Murphy & Hall called the ‘economic growth paradox: increasing the oil supply to support economic growth will require high oil prices that will undermine that economic growth’.
Other researchers have come to similar conclusions to those of Murphy & Hall, most notably economist
James Hamilton [47]. Recently, Kopits [50], and later Nelder & Macdonald [49], reiterated the importance of the relation between oil prices and economic growth in what they describe as a ‘narrow ledge’ of oil prices. This is the idea that the range, or ledge, of oil prices that are profitable for oil producers but not so high as to hinder economic growth is narrowing as newer oil resources require high oil prices for development, and as economies begin to contract due largely to the effects of prolonged periods of high oil prices. In other words, it is becoming increasingly difficult for the oil industry to increase supply at low prices, since most of the new oil being brought online has a low EROI. Therefore, if we can only increase oil supply through low EROI resources, then oil prices must apparently rise to meet the cost, thus restraining economic growth.
Skrebowski [51]provides another interpretation of the relation between oil prices and economic growth in what he calls the ‘effective incremental oil supply cost. It should be noted there are wide divergences in estimates of oil development costs depending on what is included and the treatment of financial costs, profits and overheads. Those used here are estimates of the prices needed to justify a new, large development.’
According to data provided by Skrebowski, developing new unconventional oil production in Canada (i.e. tar sands) requires an oil price between $70 and $90 per barrel. Skrebowski also indicates that new production from ultra-deep-water areas requires prices between $70 and $80 per barrel. In other words, to increase oil production over the next few years from such resources will require oil prices above at least $70 per barrel. These oil prices may seem normal today considering that the market price for reference crude West-Texas Intermediate ranged from $78 to $110 per barrel in 2012 alone, but we should remember that the average oil price during periods of economic growth over the past 40 years was under $40 per barrel, and the average price during economic recessions was under $60 per barrel (dollar values inflation adjusted to 2010) [3]. What these data indicate is that the floor price at which we could increase oil production in the short term would require, at a minimum, prices that are correlated historically with economic recessions.
Heun & de Wit [15] found indicates that the price of oil increases exponentially as EROI declines [equation and explanation snipped, see pdf]. They suggest that the nature of the relation between EROI and the price is such that the effect on price becomes highly nonlinear as EROI declines below 10.
![Figure 2. Relationship between oil prices and EROI. (Adapted from Murphy & Hall [3].)](https://energyskeptic.com/wp-content/uploads/2015/06/murphy-2013-figure-2-relationship-between-oil-prices-and-EROI.jpg)
Figure 2. Relationship between oil prices and EROI. (Adapted from Murphy & Hall [3].)
King & Hall [13] examined the relation between EROI, oil prices and the potential profitability of oil-producing firms, termed energy-producing entities (EPEs). They found that for an EPE to receive a 10% financial rate of return from an energy extraction process, which, for example, has an EROI of 11, would require an oil price of roughly $20 per barrel.3 Alternatively, a 100% financial rate of return for the same extraction project would require $60 per barrel (figure 3). King & Hall also echoed Heun & de Wit, suggesting that the relationship between EROI and profitability becomes nonlinear when the EROI declines below 10.
The pertinent results from the literature summarized in this subsection are as follows:
- there appears to be a negative exponential relationship between the aggregate EROI of oil production and oil prices;
- there appears to be a comparable relationship between EROI and the potential profitability of oil-producing firms;
- the relationship between EROI and profitability appears to become nonlinear as the EROI declines below 10;
- the minimum oil price needed to increase global oil supply in the near-term is comparable to that which has triggered economic recessions in the past.
Understanding the relationship between energy return on (energy) investment and net energy
The mathematical relation between EROI, net energy and gross energy can be used to explain why, at around an EROI of 10, the relation between EROI and most other variables, such as price, economic growth and profitability, becomes nonlinear. The following equation describes the relation between EROI, gross and net energy [3]:
Equation 3.2 net energy = gross energy (1 – 1/ EROI)
![Figure 3. Oil price as a function of EROI. The lines on the figure correspond to various rates of monetary return on investment (MROI). (Adapted from King & Hall [13].)](https://energyskeptic.com/wp-content/uploads/2015/06/murphy-2013-figure-3-oil-price-as-a-function-of-EROI.jpg)
Figure 3. Oil price as a function of EROI. The lines on the figure correspond to various rates of monetary return on investment (MROI). (Adapted from King & Hall [13].)
Using this equation, we can estimate the net energy provided to society from a particular energy source or (rearranging) the amount of gross energy required to provide a certain amount of net energy [52].
We can interpret equation (3.2) as follows:
- an EROI of 10 delivers to society 90% (1 – .2 = 90%) of the gross energy extracted as net energy
- an EROI of 5 will deliver to society 80% (1 – .2 = 80%)
- an EROI of 2 will deliver only 50% (1 – .5 = 50%).
This exponential relation between gross and net energy means that there is little difference in the net energy provided to society by an energy source with an EROI above 10, whether it is 11 or 100, but a very large difference in the net energy provided to society by an energy source with an EROI of 10 and one with an EROI of 5. This exponential relation between gross and net energy flows has been called the ‘net energy cliff’ [53]and it is the main reason why there is a critical point in the relation between EROI and price at an EROI of about 10 (figure 4).
![Figure 4. The 'net energy cliff' graph, showing the relation between net energy and EROI. As EROI declines, the net energy as a percentage of total energy extracted declines exponentially. Note that the x-axis is in reverse order. (Adapted from Mearns [53].)](https://energyskeptic.com/wp-content/uploads/2015/06/murphy-2013-figure-4-Net-Energy-Cliff.jpg)
Figure 4. The ‘net energy cliff’ graph, showing the relation between net energy and EROI. As EROI declines, the net energy as a percentage of total energy extracted declines exponentially. Note that the x-axis is in reverse order. (Adapted from Mearns [53].)
Calculating the minimum energy return on (energy) investment at the point of energy acquisition for a sustainable society
‘The true value of energy to society is the net energy, which is that after the energy costs of getting and concentrating that energy are subtracted.’ H. T. Odum [6]
According to equation (3.2), as EROI declines, the net energy provided to society declines as well, and, at some point, the amount of net energy will be insufficient to meet existing demand.
The point at which the EROI provides just enough net energy to society to sustain current activity represents the minimum EROI for a sustainable society.
But estimating empirically the actual minimum EROI for society is challenging. Hall et al. [24] estimated that the minimum EROI required to sustain the vehicle transportation system of the USA was 3. Since their calculation included only the energy costs of maintaining the transportation system, it is reasonable to expect that the minimum EROI for society as a whole could be much higher.
Exploring the minimum EROI for a sustainable society is beyond the scope of this paper. Instead, I will examine how, in theory, the minimum EROI could be calculated by using some simple models. I will first do this by examining how the idea of net energy grew from analyzing the energy budgets of organisms.
The energy that an organism acquires from its food is its gross energy intake. Let us assume, for simplicity’s sake, that an organism consumed 10 units of gross energy, but to access this food it expended 5 units of energy. Given these parameters, the EROI is 2 (=10/5) and the net energy is 5. It is important to note that the expended energy created an energy deficit (5 units) that must be repaid from the gross energy intake (10 units) before any growth, for example, in the form of building fat reserves or reproduction, can take place.
An economy also must have an influx of net energy to grow. Let us assume that Economy A produces 10,000 units of energy at an EROI of 10, which means that the energy cost of acquisition is 1,000 units and the net energy is 9,000. Like organisms, economies also have energy requirements that must be met before any investments in growth can be made. Indeed, researchers are now measuring the ‘metabolism of society’ by mapping energy consumption and flow patterns over time [54]. For example, economies must invest energy simply to maintain transportation and building infrastructure, to provide food and security, as well as to provide energy for direct consumption in transportation vehicles, households and business, etc. The energy flow to society must first pay all of these metabolic energy costs before enabling growth, such as constructing new buildings, roads, etc.
Building off this idea of societal metabolism, we can gain additional insight into the relationship between EROI and economic growth by differentiating between 3 main uses of energy by society:
- Metabolism, which could be described as the energy and material costs associated with the maintenance and replacement of populations and capital depreciation (examples include food consumption, bridge repair or doctor visits)
- Consumption: the expenditure of energy that does not increase populations or capital accumulation and is not necessary for metabolism (examples include purchasing movie tickets or plane tickets for vacation; in general, items purchased with disposable income)
- Growth, the investment of energy and materials in new populations and capital over and above that necessary for metabolism (examples include building new houses, purchasing new cars, increasing populations).
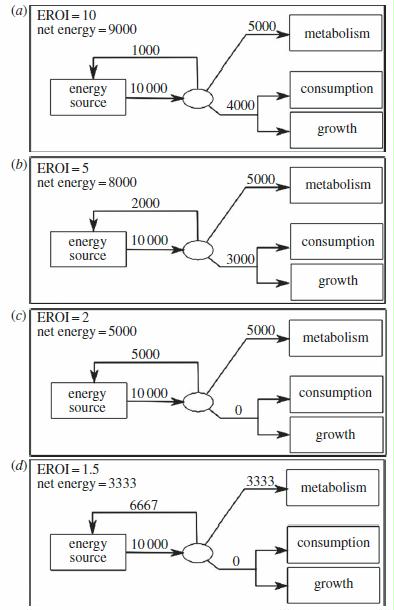
Figure 5. (a-d) Flow diagrams relating net energy, EROI and gross energy production for a hypothetical Economy A. Each diagram describes the energy flows according to a different EROI, where the EROI is (a) 10, (b) 5, (c) 2 and (d) 1.5
Figure 5 (a-d) illustrates how the flows of energy to the three categories change as EROI declines. Let us assume that the metabolism of Economy A requires the consumption of 5000 units of energy per year. So, of the 10,000 units of energy extracted, 1,000 must be reinvested to produce the next 10,000, and another 5,000 are invested to maintain the infrastructure of Economy A. This leaves 4,000 units of net energy that could be invested in either consumption or growth (figure 5a).
As society transitions to lower EROI energy sources, a portion of net energy that was historically used for consumption and/or growth will be transferred to the energy extraction sector. This transfer decreases the growth and consumption potential of the economy. For example, let us assume that, as energy extraction becomes more difficult in Economy A, it requires an additional 1,000 units of energy (2,000 total) to maintain its current production of gross energy, decreasing the EROI from 10 to 5 and the net energy from 9,000 to 8,000. If the metabolism of the economy remains at 5,000 units of energy, Economy A now has only 3,000 units of energy to invest in growth and/or consumption (figure 5b).
If the EROI for society were to decline to 2, the amount of energy that could previously be invested in growth and consumption would be transferred completely to the energy extraction sector. Thus, given the assumed metabolic needs of Economy A in this example, an EROI of 2 would be the minimum EROI needed to provide enough energy to pay for the current infrastructure requirements of Economy A, or, to put it another way, an EROI of 2 would be the minimum EROI for a sustainable Economy A. If the EROI were to decline below 2, for example in some biofuel systems [31], then the net energy provided to society would not be enough to maintain the infrastructure of Economy A, resulting in physical degradation and economic contraction (figure 5d).
There are a few caveats to this discussion of the minimum EROI that need to be addressed. First, it is important to remember that this is a simple example with hypothetical numbers, and, as such, the minimum EROI for our current society is probably, and maybe substantially, higher. Second, over time, efficiency improvements within the economy can mitigate the impact that lower EROI resources have on economic growth by increasing the utility of energy. That said, the exact relation between energy efficiency improvements and declining EROI is yet to be determined. Third, the model assumes that metabolic needs will be met first, then consumption and growth. This may not necessarily be the case.
It is quite possible that there could be growth at the expense of meeting metabolic needs. Likewise, we can consume at the expense of growth or metabolism. Either way, the net energy deficit that results from declining EROI will become apparent in one of the three sectors of energy use.
The gross energy requirement ratio
‘Now, here, you see, it takes all the running you can do, to keep in the same place.’ The Red Queen, in Through the looking-glass [55,p.15]
Another way to explore the impact that a decline in EROI can have on net energy flows to society is to consider the ‘gross energy requirement ratio’ (GERR). The GERR indicates the proportional increase or decrease in gross energy production that is required to maintain the net energy flow to society given a change in the EROI of the energy acquisition process. The GERR is calculated by dividing the gross energy requirement (GER) of the substitute energy source by the GER of the reference energy source.
The GER is the minimum amount of gross energy production required to produce one unit of net energy.
Both of these equations are outlined below [2]:
Equation 5.1 GER(X) = EROI(X) / EROI(X) – 1
Equation 5.2 GERR = GER(X) / GER(REF)
The GERR is most useful when examining how transitioning from high to low EROI energy sources will impact the net energy flow to society. For example, the average barrel of oil in the USA is produced at an EROI of roughly 11 [9]. Using equation (5.1), an EROI of 11 results in a GER of 1.1, i.e. 1.1 units of gross energy must be extracted to deliver 1 unit of net energy to society, with the 0.1 extra being the amount of energy required for the extraction process. For comparison, delivering one unit of net energy from an oil source with an EROI of 5 would require the extraction of 1.25 units of oil. If conventional oil at an EROI of 11 is our reference GER, and our substitute energy resource has an EROI of 5, then the GERR is 1.14. This GERR value indicates that, if society were to transition from an energy source with an EROI of 11 to one with an EROI of 5, then gross energy production would have to increase by 14% simply to maintain the same net energy flow to society. The net effect of declining EROI is to increase the GERR, requiring the extraction of larger quantities of gross energy simply to sustain the same net energy flow to society (figure 6).
Implications for the future of economic growth
The implication of these arguments is that, if we try to pursue growth by using sources of energy of lower EROI, perhaps by transitioning to unconventional fossil fuels, long-term economic growth will become harder to achieve and come at an increasingly higher financial, energetic and environmental cost.
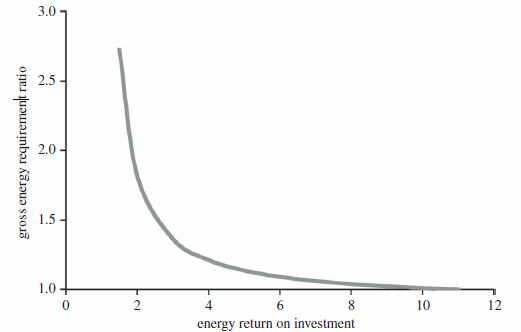
Figure 6. The GERR as a function of declining EROI. In this example, the reference EROI was 11. As such, the GERR value associated with an EROI of 4 represents the proportional increase in gross energy required to deliver one unit of net energy if society transitioned from an energy source with an EROI of 11 to one with an EROI of 4.
Revolutionary technological advancement is really the only way in which unconventional oil can be produced with a high EROI, and thus enhance the prospects for long-term economic growth and reduce the associated financial, energetic and environmental costs. This technological advancement would have to increase the energy efficiency of unconventional oil extraction or allow for increased oil recovery from fields discovered already [56]. Alternatively, there could be massive substitution from oil to high EROI renewables such as wind or hydropower [57].
It is difficult to assess directly how much technological progress is being or will be made by an industry, but we can get a glimpse as to how the oil industry is faring by comparing how production is responding to effort. If new technological advancements, such as hydraulic fracturing and horizontal drilling, represent the types of revolutionary technological breakthroughs that are needed, then we should at least see production increasing relative to effort. The data, however, do not indicate that this is the case. From 1987 to 2000, when the US oil industry increased the number of rigs used to produce oil, there was, as expected, a corresponding increase in the amount of oil produced (figure 7 not shown, see paper). But from 2001 to 2012 the trend shows very little correlation between drilling effort and oil production.
Biofuels are the only currently available non-fossil substitute for oil that is being produced at any sizable scale, but factors such as economic cost, land-use requirements and competition with food production restrict their potential contribution (see [58]). Most importantly, the EROI of most large-scale biofuels5 is between 1 and 3 [30,31], which means that we would be substituting towards a fuel that is even less useful, from a net energy perspective, for long-term economic growth. Others claim that substituting towards renewable electricity is the key; for example, Jacobson & Delucchi [59] argue that wind and solar energy could power global society by 2030. Even if their analysis stands up to scrutiny (and some claim that it does not [60,61]), the high price of oil in the transition period may provide a significant constraint on economic growth. Without high levels of economic growth, the investment capital needed to build, install and operate renewable energy will be hard to acquire.
The other option is to construct coal-to-liquids (CTL) or gas-to-liquids (GTL) operations, but even these solutions have their own difficulties (see [62]). For example, both CTL and GTL operations represent an energy conversion process, not an energy extraction process, which, in terms of EROI, simply adds to the cost of producing the final fuel and lowers the overall EROI. CTL and/or GTL will most probably lead to a significant increase in GHG emissions [63]. For GTL, there is a narrow window of low gas prices and high oil prices in which the GTL process can remain profitable [63]. Achieving profitability is easier in a CTL operation because of cheap coal, but the future availability, quality and cost of that resource is also becoming uncertain [64]. And, again, it will most probably be decades until any sizable portion of global demand for oil is met from a series of GTL or CTL plants, and in the mean-time economies will still be struggling to grow in a high oil price, low oil EROI environment.
Lastly, increasing oil production from low EROI resources is expected to degrade the global environment at an accelerated rate, for two main reasons. First, on average, the environmental impact per unit of energy is larger for unconventional oil than for conventional oil. GHG emissions, for example, are somewhere between 15% and 60% higher for gasoline and diesel produced from tar sands when compared to that produced from conventional petroleum [65,66]. Similarly, the water used per unit of energy produced is also much higher for most low EROI sources of energy [67]. Second, declining EROI increases the GERR. As society switches to lower EROI resources, simply maintaining the flow of net energy to society will require a proportionally larger amount of gross energy extraction, thus increasing the environmental impact associated with that extraction. This evidence indicates that the environmental impacts of energy extraction are most probably related exponentially to EROI, mimicking the relation between EROI and price (figure 8). This relationship holds as long as the flow of net energy to society remains the same or even increases despite a decrease in EROI. The relationship weakens if, when met with lower EROI resources, we simply decrease our effort in energy acquisition, i.e. embrace conservation.
The ecology of societal succession
‘Energy fixed tends to be balanced by the energy cost of maintenance in the mature or “climax” ecosystem.’ E. P. Odum [68]
Societal succession from the beginning of the Industrial Revolution to today mimics ecosystem succession in important and illuminating ways. The early stages of ecosystem development are marked by rapid growth (figure 9a), where the energy fixed through photosynthesis (gross photosynthesis) is greater than the energy consumed through respiration, resulting in a gain of net energy in the ecosystem. This gain in net energy leads to the accumulation of biomass (the energy equivalent of biomass in the context of society is embodied energy). As Odum [68] observed, as succession occurs, the gross photosynthesis of the ecosystem tends to balance with respiration as the steady-state, or ‘climax’, successional stage is reached. In other words, in the climax stage, almost all of the energy fixed by the ecosystem is used in maintenance respiration by the biomass that has accumulated over the years.
The simple diagram of forest succession (figure 9a not shown)is reflected by societal succession (figure 9b not shown)since the beginning of the Industrial Revolution until today. Figure 9 shows how gross photosynthesis is equivalent to humanity’s gross energy production-i.e. the total biomass, coal, oil, natural gas, etc. produced each year. Forest respiration is the equivalent of societal metabolism-i.e. the energy and material costs associated with the maintenance and replacement of populations and capital depreciation. The accumulation of biomass is the equivalent of societal growth-i.e. investments in populations and infrastructure that will increase overall societal metabolism. Lastly, the net energy provided to society is that left after accounting for the metabolic needs of society (i.e. net energy = gross energy production – societal metabolism). Historically, we have simply found and produced more energy as the metabolism (i.e. energy demand) of society grew. Indeed, the exponential increase in global economic output over the past 200 years is highly correlated with the same exponential increase in energy consumption (figure 10).
The question is: can global society continue to produce enough energy to outpace the increased metabolic requirements of a growing, and now very large, built infrastructure? Answering this question for each energy source is clearly beyond the scope of this paper, but the answer for oil seems clear, as the production of conventional oil seems to have peaked in 2008 [71], and both unconventional oil and other feasible substitutes have a much lower EROI. Both of these factors are likely to place contractionary pressure on the global economy by decreasing the flow of net energy to society.
The main difference between society and nature, in terms of figure 9, is in the reason for the peak and initial decline in gross energy acquisition. In forests and other natural ecosystems, the amount of gross photosynthesis declines and reaches parity with respiration as the forces of competition and natural selection create a steady-state, or ‘climax’, ecosystem. These forces exist also for society, but they are in the form of declining EROI, geological depletion, environmental degradation, climate change, water pollution, air pollution, land-cover change and such, and all the other factors that are occurring today that make it harder and harder to produce energy easily. In the end, ecosystems are able to successfully transition from a growth-oriented structure to a steady state; it is unclear whether society will be able to do the same.
![Figure 10. GDP as a function of energy consumption over the past 200 years. (Adapted from Kremmer [69] and Smil [70].)](https://energyskeptic.com/wp-content/uploads/2015/06/murphy-2013-figure10-GDP-as-a-function-of-energy-consumption-1820-2000.jpg)
Figure 10. GDP as a function of energy consumption over the past 200 years. (Adapted from Kremmer [69] and Smil [70].)
Summary
The concept of energy return on investment (EROI) was born out of ecological research in the early 1970s, and has grown over the past 30 years into an area of study that bridges the disciplines of industrial ecology, economics, ecology, geography and geology, just to name a few. The most recent estimates indicate that the EROI of conventional oil is between 10 and 20 globally, with an average of 11 in the USA.
The future of oil production resides in unconventional oil, which has, on average, higher production costs (in terms of both money and energy) than conventional oil, and should prove in time to have a (much) lower EROI than conventional oil. Similar comments apply to other substitutes such as biofuels. The lack of peer-reviewed estimates of the EROI of such resources indicates a clear need for further investigation.
Transitioning to lower EROI energy sources has a number of implications for global society.
- It will reallocate energy that was previously destined for society towards the energy industry alone. This will, over the long run, lower the net energy available to society, creating significant headwinds for economic growth.
- Transitioning to lower EROI oil means that the price of oil will remain high compared to the past, which will also place contractionary pressure on the economy.
- As we try to increase oil supplies from unconventional sources, we will accelerate the resource acquisition rate, and therefore the degradation of our natural environment.
It is important to realize that the problems related to declining EROI are not easily solved. Renewable energy may indeed represent the future of energy development, but renewables are a long time off from displacing oil. Lastly, it seems apparent that the supply-side solutions (more oil, renewable energy, etc.) will not be sufficient to offset the impact that declining EROI has on economic growth. All of this evidence indicates that it is time to re-examine the pursuit of economic growth at all costs, and maybe examine how we can reduce demand for oil while trying to maintain and improve quality of life. A good summary of these problems is also given in Sorrell [72].
For society, we can either dictate our own energy future by enacting smart energy policies that recognize the clear and real limits to our own growth, or we can let those limits be dictated to us by the physical constraints of declining EROI. Either way, both the natural succession of ecosystems on Earth and declining EROI of oil production indicate that we should expect the economic growth rates of the next 100 years to look nothing like those of the last 100 years.
References
- Murphy DJ, Hall CAS, Dale M, Cleveland C. 2011 Order from chaos: a preliminary protocol for determining the EROI of fuels. Sustainability 3, 1888–1907. (doi:10.3390/su3101888)
- Mulder K, Hagens NJ. 2008 Energy return on investment: toward a consistent framework. Ambio 37, 74–79. (doi:10.1579/0044-7447(2008)37[74:EROITA]2.0.CO;2)
- Murphy DJ, Hall CAS. 2011 Energy return on investment, peak oil, and the end of economic growth. Ann. NY Acad. Sci. 1219, 52–72. (doi:10.1111/j.1749-6632.2010.05940.x)
- Hall CAS, Powers R, Schoenberg W. 2008 Peak oil, EROI, investments and the economyin an uncertain future. In Biofuels, solar and wind as renewable energy systems: benefits and risks(ed. D Pimentel). Houten, The Netherlands: Springer Netherlands.
- Odum HT. 1971 Environment, power, and society. New York, NY:Wiley.
- Odum HT. 1973 Energy, ecology, and economics. Ambio 2, 220–227.
- Gagnon N, Hall CAS, Brinker L. 2009 A preliminary investigation of the energy return on energy invested for global oil and gas extraction. Energies 2, 490–503. (doi:10.3390/en20300490)
- Cleveland C. 2005 Net energy from the extraction of oil and gas in the United States. Energy30, 769–782. (doi:10.1016/j.energy.2004.05.023)
- Guilford MC, Hall CAS, O’Connor P, Cleveland CJ. 2011 A new long term assessment of energy return on investment (EROI) for U.S. oil and gas discovery and production. Sustainability 3, 1866–1887. (doi:10.3390/su3101866)
- Grandell L, Hall CAS, Höök M. 2011 Energy return on investment for Norwegian oil and gas from 1991 to 2008. Sustainability 3, 2050–2070. (doi:10.3390/su3112050)
- Moerschbaecher M, Day JW. 2011 Ultra-deepwater Gulf of Mexico oil and gas: energy return on financial investment and preliminary assessment of energy return on energy investment. Sustainability 3, 2009–2026. (doi:10.3390/su3102009)
- Cleveland CJ, O’Connor PA. 2011 Energy return on investment (EROI) of oil shale. Sustainability 3, 2307–2322. (doi:10.3390/su3112307)
- King CW, Hall CAS. 2011 Relating financial and energy return on investment. Sustainability 3, 1810–1832. (doi:10.3390/su3101810)
- Dale M, Krumdieck S, Bodger P. 2012 Global energy modelling—a biophysical approach (GEMBA). II. Methodology. Ecol. Econ. 73, 158–167. (doi:10.1016/j.ecolecon.2011.10.028)
- Heun MK, de Wit M. 2012 Energy return on (energy) invested (EROI), oil prices, and energy transitions. Energy Pol. 40, 147–158. (doi:10.1016/j.enpol.2011.09.008)
- Hall CAS. 1972 Migration and metabolism in a temperate stream ecosystem. Ecology 53, 585–(doi:10.2307/1934773)
- Chapman PF. 1974 Energy costs: a review of methods. Energy Pol. 2, 91–103. (doi:10.1016/0301-4215(74)90002-0)
- Chapman P. 1976 Energy analysis: a review of methods and applications. Omega 4, 19–33.(doi:10.1016/0305-0483(76)90036-0)
- Carter AP. 1974 Applications of input–output analysis to energy problems. Science 184, 325–329. (doi:10.1126/science.184.4134.325)
- Estrup C. 1974 Energy consumption analysis by application of national input–output tables. Ind. Market. Manage. 3, 193–210. (doi:10.1016/0019-8501(74)90007-8)
- Nilsson S. 1974 Energy analysis: a more sensitive instrument for determining costs of goods and services. Ambio 3, 222–224.
- Nilsson S, Kristoferson L. 1976 Energy analysis and economics. Ambio 5, 27–29.
- Bullard C, Herendeen R. 1975 The energy costs of goods and services. Energy Pol. 3, 268–278.(doi:10.1016/0301-4215(75)90035-X)
- Hall CAS, Balogh S, Murphy DJR. 2009 What is the minimum EROI that a sustainable society must have? Energies 2, 25–47. (doi:10.3390/en20100025)
- Slesser M (ed.). 1974 Energy Analysis Workshop on Methodology and Conventions, Guldsmedshyttan, Sweden, 25–30 August 1974. IFIAS Rep. no. 6. Stockholm, Sweden: International Federation of Institutes for Advanced Study.
- Connolly TJ, Spraul JR (eds). 1975 Report of the NSF–Stanford Workshop on Net Energy Analysis, Palo Alto, CA, 25–28 August. Stanford, CA: Institute of Energy Studies, Stanford University.
- CERI. 1976 Net energy analysis: an energy balance study of fossil fuel resources. Golden, CO:Colorado Energy Research Institute.
- Bullard CW, Penner PS, Pilati DA. 1978 Net energy analysis: handbook for combining process and input–output analysis. Resour. Energy 1, 267–313. (doi:10.1016/0165-0572(78)90008-7)
- Herendeen R. 1978 Input–output techniques and energy cost of commodities. Energy Pol. 6, 162–165. (doi:10.1016/0301-4215(78)90039-3)
- Farrell AE, Plevin RJ, Turner BT, Jones AD, O’Hare M, Kammen DM. 2006 Ethanol can contribute to energy and environmental goals. Science 311, 506–508. (doi:10.1126/science. 1121416)
- Murphy DJ, Hall CAS, Powers B. 2011 New perspectives on the energy return on (energy) investment (EROI) of corn ethanol. Environ. Dev. Sustain. 13, 179–202. (doi:10.1007/s10668-010-9255-7)
- Costanza R. 1980 Embodied energy and economic valuation. Science 210, 1219–1224.(doi:10.1126/science.210.4475.1219)
- Hall CAS, Cleveland CJ, Berger M. 1981 Energy return on investment for United States petroleum, coal, and uranium. In Energy and ecological modeling (ed. W Mitsch), pp. 715–724.Amsterdam, The Netherlands: Elsevier.
- Hall CAS, Cleveland CJ. 1981 Petroleum drilling and production in the United States: yieldper effort and net energy analysis. Science 211, 576–579. (doi:10.1126/science.211.4482.576)
- Hall CAS, Kaufmann R, Cleveland CJ. 1986 Energy and resource quality: the ecology of theeconomic process. New York, NY:Wiley.
- Cleveland CJ, Costanza R, Hall CAS, Kaufmann R. 1984 Energy and the U.S. economy: abiophysical perspective. Science 225, 890–897. (doi:10.1126/science.225.4665.890)
- Brundtland GH. 1987 Our common future. New York, NY: United Nations.
- de Haes HAU, Heijungs R. 2007 Life-cycle assessment for energy analysis and management. Appl. Energy 84, 817–827. (doi:10.1016/j.apenergy.2007.01.012)
- Wiedmann TA. 2009 A review of recent multi-region input–output models used forconsumption-based emission and resource accounting. Ecol. Econ. 69, 211–222. (doi:10.1016/j.ecolecon.2009.08.026)
- Raugei M, Fullana-i-Palmer P, Fthenakis V. 2012 The energy return on energy investment (EROI) of photovoltaics: methodology and comparisons with fossil fuel life cycles. Energy Pol. 45, 576–582. (doi:10.1016/j.enpol.2012.03.008)
- Kubiszewski I, Cleveland CJ, Endres PK. 2010 Meta-analysis of net energy return for wind power systems. Renew. Energy 35, 218–225. (doi:10.1016/j.renene.2009.01.012)
- Berndt ER. 1978 Aggregate energy, efficiency and productivity measurement. Annu. Rev.Energy 3, 225–273. (doi:10.1146/annurev.eg.03.110178.001301)
- Cleveland CJ, Kaufmann RK, Stern DI. 2000 Aggregation and the role of energy in theeconomy. Ecol. Econ. 32, 301–317. (doi:10.1016/S0921-8009(99)00113-5)
- Brandt AR. 2011 Oil depletion and the energy efficiency of oil production: the case ofCalifornia. Sustainability 3, 1833–1854. (doi:10.3390/su3101833)
- Hu Y, Feng L, Hall CAS, Tiang D. 2011 Analysis of the energy return on investment (EROI) ofthe huge Daqing oil field in China. Sustainability 3, 2323–2338. (doi:10.3390/su3122323)
- Farrell AE, Brandt AR. 2006 Risks of the oil transition. Environ. Res. Lett. 1, 1–6.(doi:10.1088/1748-9326/1/1/014004)
- Hamilton J. 2009 Causes and consequences of the oil shock of 2007–08. In Brookings Papers on Economic Activity (eds D Romer, J Wolfers), pp. 215–283. Washington, DC: The Brookings Institution.
- Rubin. 2008 Just how big is Cleveland? Toronto, Canada: CIBC World Markets Inc.
- Nelder C, Macdonald G. 2012 There will be oil, but at what price? Harvard Business ReviewBlog Network [Internet]. 1 October 2011.See http://blogs.hbr.org/cs/2011/10/there_will_be_oil_but_can_you.html.
- Kopits S. 2009 A peak oil recession. In ASPO-8: The ASPO 2009 Int. Peak Oil Conf., Denver, CO,11–13 October. Uppsala, Sweden: Association for the Study of Peak Oil & Gas.
- Skrebowski C. 2011 A brief economic explanation of peak oil. In Oil DepletionAnalysis Centre (ODAC) Newsletter, 16 September 2011 [online]. See http://www.odacinfo.org/newsletter/2011/09/16.
- Deng S, Tynan GR. 2011 Implications of energy return on energy invested on future total energy demand. Sustainability 3, 2433–2442. (doi:10.3390/su3122433)
- Mearns E. 2008 The global energy crisis and its role in the pending collapse of the global economy.Presentation to the Royal Society of Chemists, Aberdeen, Scotland, 29 October 2008. Seehttp://www.theoildrum.com/node/4712.
- Giampietro M, Mayumi K, Sorman AH. 2010 Assessing the quality of alternative energysources: energy return on investment (EROI), the metabolic pattern of societies and energystatistics. Institut de Ciencia, Universitat Autonoma de Barcelona.
- Carroll L. 1871 Through the looking-glass. London,UK:Macmillan.
- Muggeridge A, Cockin A, Webb K, Frampton H, Collins I, Moulds T, Salino P. 2014 Recovery rates, enhanced oil recovery and technological limits. Phil. Trans. R. Soc. A 372, 20120320.(doi:10.1098/rsta.2012.0320)
- Murphy DJ,Hall CAS. 2010 Year in review—EROI or energy return on (energy) invested. Ann.NY Acad. Sci. 1185, 102–118. (doi:10.1111/j.1749-6632.2009.05282.x)
- Timilsina GR. 2014 Biofuels in the long-run global energy supply mix for transportation. Phil.Trans. R. Soc. A 372, 20120323. (doi:10.1098/rsta.2012.0323)
- Jacobson MZ, DelucchiMA. 2009 A path to sustainable energy by 2030. Scient. Am. 301, 58–65.(doi:10.1038/scientificamerican1109-58)
- Trainer TA. 2012 A critique of Jacobson and Delucchi’s proposals for a world renewable energy supply. Energy Pol. 44, 476–481. (doi:10.1016/j.enpol.2011.09.037)
- Trainer TA. 2010 Can renewables etc. solve the greenhouse gas problem? The negative case.Energy Pol. 38, 4107–4114. (doi:10.1016/j.enpol.2010.03.037)
- Höök M, Davidsson S, Johansson S, Tang X. 2014 Decline and depletion rates of oilproduction: a comprehensive investigation. Phil. Trans. R. Soc. A 372, 20120448. (doi:10.1098/rsta.2012.0448)
- Jaramillo P, Griffin WM,Matthews HS. 2008 Comparative analysis of the production costs and life-cycle GHG emissions of FT liquid fuels from coal and natural gas. Environ. Sci. Technol. 42, 7559–7565. (doi:10.1021/es8002074)
- National Research Council. 2007 Coal: research and development to support national energy policy. Washington, DC: National Academies Press.
- Brandt AR, Farrell AE. 2007 Scraping the bottom of the barrel: greenhouse gas emissionconsequences of a transition to low-quality and synthetic petroleum resources. Clim. Change 84, 241–263. (doi:10.1007/s10584-007-9275-y)
- CAPP. 2013 The facts on oil sands. Calgary, Canada: Canadian Association of Petroleum Producers. See http://www.capp.ca/UpstreamDialogue/OilSands/Pages/default.aspx.
- Mulder K, Hagens N, Fisher B. 2010 Burning water: a comparative analysis of the energyreturn on water invested. Ambio 39, 30–39. (doi:10.1007/s13280-009-0003-x)
- Odum EP. 1969 The strategy of ecosystem development. Science 164, 262–270. (doi:10.1126/science.164.3877.262)
- Kremmer. 2010 Historic population and GDP data [online]. See http://www.historicalstatistics.org/ (accessed 24 November 2010).
- Smil V. 2010 Energy transitions: history, requirements, prospects. Santa Barbara, CA: Praeger.
- IEA. 2012 World energy outlook 2012. Paris, France: International Energy Agency.
- Sorrell S. 2010 Energy, growth and sustainability: five propositions. Brighton, UK: University of Sussex.
One Response to Implications of declining EROI on oil production 2013 by David J. Murphy