
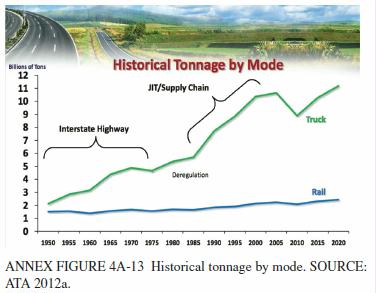
Look at the enormous waste of fuel when JIT supply chain trucks ramped up in the late 70s (page 63).
Excerpts from the 117 page: NRC. 2014. Reducing the Fuel Consumption and Greenhouse Gas Emissions of Medium- and Heavy-Duty Vehicles, Phase Two: First Report. National Research Council.
The fuel consumption and greenhouse gas (GHG) emissions of medium- and heavy-duty vehicles (MHDVs) have become a focus of legislative and regulatory action in the past few years. Section 101 of the Energy Independence and Security Act of 2007 (EISA 2007), Pub. L No. 110-140 §101, mandated the U.S. Department of Transportation to promulgate fuel consumption standards for MHDVs for the first time.
the National Research Council (NRC) in 2010 completed Technologies and Approaches to Reducing the Fuel Consumption of Medium- and Heavy-Duty Vehicles, referred to henceforth as the Phase One Report.
Improving in-use efficiency of fuel use in MHDVs-by driving innovation, advancement, adoption, and in-use balance of technology through regulation. At the same time, the committee seeks to advise on pathways to accomplish this, subject to the following constraints: (a) holding life-cycle cost of technology change or technology addition to an acceptable level; (b) holding capital cost of acquiring required new technology to an acceptable level; (c) acknowledging the importance of employing a balance of energy resources that offers national security; (d) avoiding near-term, precipitous regulatory changes that are disruptive to commercial planning; (e) ensuring that the vehicles offered for sale remain suited to their intended purposes and meet user requirements; (f) ensuring that the process used to demonstrate compliance is accurate, efficient, and not excessively burdensome; and (g) not eroding control of criteria pollutants or unregulated species that may have health effects.
As truck efficiency regulation advances, there are trade-offs that must be addressed. Metrics of interest are fuel efficiency, GHGs, cost, criteria pollutants, and energy security. The primary trade-off is GHGs versus fuel efficiency, when several fuels and their associated technologies are considered.
Natural gas accounts for about 25 percent of all U.S. energy use, yet only 0.1 percent is used in transportation, equivalent to about 0.5 billion gallons per year of petroleum fuel. However, in the short time since the release of the Phase One Report (NRC, 2010), natural gas has emerged as an economically attractive option for commercial vehicles. This has been driven by the rapid development of low-cost production of unconventional natural gas.
In order for medium and heavy trucks to use natural gas fuel rather than diesel, the most significant changes needed are the onboard fuel storage method and the means of introducing and igniting the fuel in the engine. Onboard fuel storage is by high pressure, effected by either compressed natural gas (CNG) cylinders (3,600 pounds per square inch is typical) or cryogenic containers filled with liquefied natural gas (LNG). For using natural gas in place of gasoline, the spark ignition engine carries over with modest changes, but fuel storage is still by one of the above two methods. Natural gas engines are well developed, although improvements can be pursued in
Natural gas’s inherent GHG benefit by virtue of its low carbon content (~28%) is partially negated by lower efficiency in currently available engines and the higher GHG impact of methane emissions. In addition, a natural gas leakage correction to GHG impact could negate the inherent tailpipe CO2 advantage.
Due to the economics-driven rapid adoption of natural gas, there is urgency to develop an optimum solution in Phase II Rule standards for both GHG emissions and fuel consumption (as well as criteria emissions) that will accommodate this fuel without artificially disrupting prevailing commercial transportation business models. As a specific example, the GEM certification tools need to include natural gas engine maps to more accurately quantify the emissions and fuel economy of natural gas vehicles.
There are four regions of the tractor-van trailer combination truck that are amenable to aerodynamic design improvements, including the various tractor details, the tractor-trailer gap, the trailer underbody, and the trailer tail.
The Phase I Rule had the effect of encouraging the adoption of technologies for reducing fuel consumption. Such reductions can be achieved by technological improvements to the vehicle as well as by improvements in operations, changes in behavior of drivers, and so forth. The Phase One Report considered other approaches (referred to, perhaps imprecisely, as nontechnical approaches) such as intelligent transportation systems; construction of lanes exclusively for trucks; congestion pricing; driver training; and intermodal operations (NRC, 2010, pp. 159 et seq.). Also considered were market-based instruments such as fuel taxes. Another viable approach would entail adjusting size and weight restrictions on trucks. For example, this might include greater use of vehicles that have favorable LSFC such as longer combination vehicles, which have greater freight capacity than the notional tractor-trailer, which can have a combined gross vehicle weight of 80,000 lb.5
Regarding the potential for technological change in the MY2019-2022 time frame, the committee, in its investigations to date, has not identified any combustion or other engine technologies beyond those identified in the NRC (2010) Phase One Report that would provide significant further fuel consumption reduction during the Phase II Rule time frame.
A further consideration is the gross vehicle weight assumed in the GHG Emissions Model (GEM) simulation, which for Class 8 vehicles is based on a payload weight of 38,000 lb, an intermediate load value. The Agencies adopted payload values for the GEM simulation calculations that are representative of real-world truck use, instead of merely
using the maximum gross combination vehicle weight rating (GCVWR) for the vehicle weight class. This captures the situation that over half of trucks on the road are volume limited,5 meaning the trailer is filled up with containers without reaching the weight limit. In such a case the combined tractor trailer is not at full GCVW of 80,000 lb, the maximum allowed weight for un-permitted interstate transit.6
Finding 8-1. While it may seem expedient to focus initially on those classes of vehicles with the largest fuel consumption (i.e., Class 8, Class 6, and Class 2b, which together account for approximately 90 percent of fuel consumption of MHDVs), the committee believes that selectively regulating only certain vehicle classes would lead to very serious unintended consequences and would compromise the intent of the regulation. Within vehicle classes, there may be certain subclasses of vehicles (e.g., fire trucks) that could be exempt from the regulation without creating market distortions. (NRC, 2010)
The recommendation that NHTSA conduct a pilot program had two broad purposes: first, the agency would gain experience with certification testing, data gathering, compiling, and reporting. The trial period was envisaged as a means for developing and refining the regulatory processes before the official start date of the program. Second, the pilot program would include gathering data on fuel consumption from several representative fleets of commercial trucks (e.g., long-haul, delivery vans, specialty vehicles, and large pickups). These data would provide a real world check on the effectiveness of the regulatory design on the fuel consumption of trucking fleets in various parts of the marketplace and in various regions of the country (NRC, 2010, p. 188).
[Nobody did their homework assignments from the 2010 study!]
The Agencies, however, declined to undertake a pilot program.9 Data gathering and comparing the performance of vehicles specified via the Phase I Rulemaking process versus current methods of specifying trucks for customers (using OEM specification tools) could nonetheless have begun in 2011 and been continued until now. Data gathering should be ongoing. At least some kind of demonstration programs could have been done, perhaps even with simulations. Omissions that were due to the absence of a demonstration program include the following: 1. The lack of baseline data from a few representative national fleets prior to the rulemaking, such as would enable comparison with post-rulemaking (after 2014) fuel efficiency. This would have also started to facilitate the comparison of real-world test data with compliance data.
Unintended Consequences. Interventions into complex systems inevitably produce unintended consequences. Fuel consumption regulations, in purposely trying to change product characteristics and mixes, could produce incentives and behaviors that may result in unintended consequences, either beneficial or detrimental. For example, some analysts have noted that original equipment manufacturers (OEMs) responded to the Corporate Average Fuel Economy (CAFE) standards by producing vehicles that counted as trucks for regulatory purposes
Two heavy-duty gasoline engine manufacturers (Ford13 and GM14) said that the Phase I Regulations are considerably more difficult to achieve for gasoline engines than they are for diesel engines in vehicle classes where both engine types are available (notably Classes 2b and 3). Both manufacturers have indicated that marginalization or elimination of gasoline engines from this segment is a possible future outcome based on present forecasts, and this feedback should be carefully considered when setting Phase II Regulations applicable to this segment. The Agencies may wish to consider whether such consequences are likely and, if so, to what extent they will be detrimental to the long-run health of the industry and the goals of reduced fuel consumption and GHG reduction, and if such second-order impacts can or should be mitigated.15
Other Recommendations in the NRC Phase One Report That Were Not Addressed by the Agencies
Recommendation 4-2. Because the potential for fuel consumption reduction through dieselization of Class 2b to 7 vehicles is high, the U.S. Department of Transportation/ National Highway Traffic Safety Administration (NHTSA) should conduct a study of Class 2b to 7 vehicles regarding gasoline versus diesel engines considering the incremental fuel consumption reduction of diesels, the price of diesel versus gasoline engines in 2010-2011, especially considering the high cost of diesel emission control systems, and the diesel advantage in durability, with a focus on the costs and benefits of the dieselization of this fleet of vehicles.
Diesel engines present an opportunity for incremental fuel efficiency gains and, for some vehicles, may have the advantage of better durability.
there was already a move from diesel to gasoline direct injection technology at the middle of the MHDV range, as noted in the Phase One Report (NRC, 2010, p. 64). Likewise a shift to more fuel efficient, smaller displacement, greater power-density diesel engines was then becoming apparent and was expected to motivate continued downsizing, as with passenger cars. An analysis by Frost & Sullivan, a consultancy, indicates 15 liter (15 L) engines will continue dominating the Class 8 engine market through 2018 but then are expected to lose market share to 11 L to 12 L and 12 L to 14 L engines.26While the consequences of these moves are reduced fuel consumption and reduced CO2 emissions, they may also have implications for the market as a whole and may influence factors such as supply chain and fuel choice.
The state of the economy will have a significant impact on MHDV vehicle-miles traveled (VMT), fuel consumption, and GHG emissions, particularly as macroeconomic trends affect growth and activity in the construction and manufacturing industry sectors. But in addition to the general economic health condition of the nation, the other potentially relevant factors discussed here include (1) the emergence of natural gas as a significant transportation fuel; (2) the role of biofuels; (3) the growing interest in the United States in dimethyl ether (DME) as a fuel; (4) the viability of electrification of the vehicles; (5) the development of automated and/or connected vehicles; (6) the implementation of green logistics; and (7) background regulatory developments.
Natural Gas The natural-gas-fueled engine, using either liquid natural gas (LNG) or compressed natural gas (CNG), is not a new technology. Natural gas engines were produced as early as 1860 and now power about 120,000 vehicles on U.S. roads.27
Coal to liquid
FIGURE 1-1 Illustrative pathway for vehicle fuels production and use.
The application of natural gas for MHDVs has been more recent, however, and earliest uses were for transit buses and municipal vehicles. Over the past two decades, the natural gas engine has served as a niche technology in the MHDV market, present in mostly urban refuse haulers and transit bus applications. Natural gas is often referred to as a “bridge fuel,” since it is a way to bridge the diesel-fuel dominance of the MHDV market to the next non- petroleum-based fuel-yet to be identified to the point of having a broad consensus. Common production pathways and uses for natural gas and other current and future MHDV fuels are illustrated in Figure 1-1. The MHDV natural gas market developed slowly before circa 2010. Purchasers other than municipal fleets, which are subsidized by the government, had difficulty justifying the higher purchase price of the vehicle despite the lower cost of natural gas compared to diesel fuel. Furthermore, the cost of constructing fueling stations across the country 27 http://www.ngvamerica.org/media_ctr/fact_ngv.html. ranges between $600,000 to over $1,000,000 per station for compressed natural gas and nearly twice that per liquefied natural gas station.28 Municipal vehicles, which run routes during the day and are centrally garaged at night, can be readily refueled at the garage, making them good applications for this niche technology. In recent years, the gap between natural gas and diesel fuel prices has dramatically widened.29 Moreover, advancements in technology have enabled manufacturers to develop more natural gas engine options and attendant vehicle technologies to achieve reliability and durability similar to that of the diesel. Together these circumstances make natural gas a viable choice for future commercial over-the-road fleets. A variety of natural gas engines suited to a wide range of MHDV applications will be available by 2015. As more OEMs are introducing natural gas options to their product line, the share of CNG/LNG MHDVs continues to grow.
ACT Research predicts30 that the natural gas market share of MHDV truck and bus (includes municipal and refuse) could be as high as 36 percent by 2020. For these predictions to play out, the CNG/LNG infrastructure must be expanded.
While there has been a significant increase in the number of natural gas fueling stations over the past years, the infrastructure is still nascent and will require large investments to provide enough stations to prevent disruption in routes and travel times for longer-haul trucks. Another consideration in the future use of natural gas in the MHDV market is the rapid growth and output of hydraulic fracturing (“fracking”) in natural gas drilling. Fracking has greatly increased the supply and availability of natural gas while reducing its cost. EPA and some states are now exploring more rigorous regulation of fracking operations. Regulations are one of several factors that could significantly increase the cost or reduce the availability of natural gas. This would reduce the incentive to move toward natural gas fuels and technologies in the MHDV sector. Affordable fuel prices and a growing infrastructure all bode well for the future of natural gas in MHDVs.
However, if the price of fuel continues to be favorable vis-à-vis diesel, the transportation sector will have to compete with other sectors (e.g., electricity and heating) for domestic natural gas. (The exporting of natural gas could affect prices as well.) Predicting how this might affect the MHDV market is difficult. Analysts predict that as the economy improves, the price of natural gas will increase (AEO, 2013) but so will the price of petroleum-based fuels. Another important issue raised by fuels such as natural gas is, on the one hand. the distinction between vehicle fuel consumption and GHG and, on the other, the life- cycle analysis of the fuel consumption and GHG using natural gas as a fuel (well to wheels).
Biofuels. The current state of biofuel research, development, and production suggests that the biofuels produced in abundance over the next decade will likely be blends containing ethanol, gasoline, or biodiesel. In its 2013 Energy Outlook, the DOE’s Energy Information Administration (EIA) forecasts that the consumption of next-generation biofuels (including pyrolysis oils, biomass-derived Fischer-Tropsch liquids, and fuels derived from renewable feedstocks) by the transportation sector will increase to about 0.4 million barrels per day (BPD) from 2011 to 2040. This compares with 1.6 million BPD of diesel during the same period.
Ethanol has Been used as a blend in gasoline engines for over three decades.
In 2001, the production of ethanol as a share of gasoline volume was only 1 percent. By 2011, the share rose to 10 percent (EIA, 2012). This is largely due to the first Renewable Fuel Standard (RFS) program, which was enacted in 2006 as a part of the Energy Policy Act of 2005. As a result of EISA 2007, the Renewable Fuels Standard “RFS2” mandated renewable fuel consumption of 36 billion gallons (35 billion of ethanol equivalent and 1 billion of biodiesel) by 2022. Although higher blends of ethanol are approved as a transportation fuel by EPA (E15 and E85), the majority of vehicles in the United States use E10. Higher blends can produce fewer GHG, but the higher blends usually exhibit less “tank mileage” (miles per gallon), because of the inherent lower energy content (i.e., enthalpy) of ethanol. Every 10 percent of ethanol in the fuel reduces fuel economy by approximately 3.5 percent (Knoll et al., 2009). Further, distribution infrastructure becomes more difficult at higher blends. Ethanol is a solvent, so its chemistry is prone to dissolving the hydrocarbon residue and water that are often found in the pipeline, which can render the transported fuel out of specification, especially if tanks and pipes are not properly cleaned before switching products.
Biodiesel Studies by EPA and others indicate that the fuel consumption of B5, the most commonly used biodiesel, is about 2 percent worse than that for conventional diesel.31
In 2001 biodiesel production was 9 million gallons. By 2011, it was nearly 100 times higher, at 967 million gallons. While this growth is significant, it represents only 1 percent of the total diesel production by volume. Consumption of biodiesel in 2011 was 878 million gallons (EIA, 2012). Similarly, RFS and EISA 2007 (RFS2) require consumption of 1 billion gallons biomass-based diesel. Tax credits and incentives through the RFS2 have had a positive influence on the production and consumption of biodiesel. Soybeans make up 57 percent of the biodiesel feedstock. Thus, droughts such as that the United States experienced in 2012 can cause the price of biodiesel to vacillate markedly, giving users little reason to purchase the fuel. The use of biofuels is well established in the United States. The growth in production and consumption still relies in a large part on incentives and tax credits. Nonfood-derived cellulosic feedstock is another consideration in the growth of these biofuels, but large-scale production and consumption is years away (NREL, 2012). A further fuel not yet in widespread use is so-called renewable diesel fuel, which is bio-oil refined to remove oxygen and which resembles petrol-derived fuels.
Dimethyl ether (DME) may show promise as an alternative fuel. Synthesized from methanol, it can be produced from biomass, natural gas, or coal. Its thermal efficiency and performance are comparable to those of diesel. DME typically sells at a premium to energy value (i.e., costs more for the same enthalpy). DME is liquefied at 50 pounds per square inch (psi) (or 345 kilopascal (kPa)), so its use requires similar tankage to propane. DME is expected to have the same selling price as a diesel gallon equivalent. 32 As with most alternative fuels, developing engine and vehicle modifications and the distribution infrastructure for the fuel are the most obvious obstacles to widespread use of DME in the near term. DME currently has minimal transportation applications in the United States.
Fischer-Tropsch. Other alternative fuels, known as Fischer-Tropsch (FT) or gas-to-liquid (GTL) fuels, are available in the market but are currently produced in very modest volumes: only about 200,000 barrels a day, which is equal to less than 1 percent of global diesel demand a day (NYT, 2012). These fuels are produced via the FT chemical process, using natural gas, coal, or biomass as feedstock. FT fuels are interesting because they reduce dependency on crude oil and, depending on the feedstock used, may reduce the CO2 footprint as compared with petroleum-based fuels.
These benefits notwithstanding, FT fuels are expensive to produce. Capital costs, the reliability of cost-effective feedstock, and the logistics of sourcing and transporting feedstock are all considerable. Analysts believe that FT fuels will be cost-effective only when natural gas and oil prices are out of balance. As long as natural gas and oil price differentials remain relatively aligned, the large investment in FT technology will be unsustainable (NYT, 2012).
Electrification The electrification of the light-duty fleet appears to be finally achieving traction after many years of false starts and slow progress,33 raising the potential for electric or hybrid medium- and heavy-duty vehicles to reduce CO2 emissions and fuel consumption. There are a number of technology alternatives for incorporating electrification into the MHDV fleet, including (1) hybrid-electric vehicles (HEVs); (2) electrified accessories; (3) fully electric power trains; (4) electrified power take-off (PTO); (5) plug-in hybrid-electric vehicles (PHEVs); (6) external power to electric power train for zero emission vehicle (ZEV) corridors; and (7) alternative fuel/hybrid combinations.34
Sleeper berth. Solutions include battery-operated HVAC and auxiliary power units (APUs), start/stop systems, and truck stop electrification. Of course, given the range limitations of current vehicle battery technology, electrification is more feasible for some types and modes of MHD vehicles than others. For example, battery-powered motors are least feasible for long-haul heavy-duty trucks that usually travel hundreds of miles per day but may be very promising for service fleets where vehicles perform a number of local deliveries or other jobs per day and then are parked overnight at a centralized base, where they can be plugged in and recharged. One estimate is that up to 6.4 percent of power train systems in MHDVs (including buses) will be electric or hybrid by 2020.35 This represents slightly over 130,000 units, of which about two- thirds are projected to be hybrids and one-third pure electrics.36
Other analysts predict that electric and hybrid vehicles will represent only niche markets before 2030, when more significant market penetration is expected.37
Another important alternative-fuel technology involves hydrogen fuel cells as the power plant; such fuel cells are projected to significantly penetrate the MHDV sector by the early 2020s. Several light-duty vehicle manufacturers are developing fuel-cell vehicles (FCVs) for commercial introduction, including Hyundai in 2014 and Honda in 2015, with others planning introductions from 2017 to 2020.38 This will result in technology validation, hydrogen infrastructure development, and cost savings that will eventually benefit the commercialization of FCVs in the MHDV sector. California is supporting the introduction of FCVs through a partnership with vehicle manufacturers and other stakeholders that has developed a roadmap for installing the infrastructure needed for the commercialization of FCVs.39
Fuel cells are also being developed to provide auxiliary power for trailer refrigeration, used in some 300,000 refrigerated trucks.
By replacing the small diesel engines with the more efficient fuel cell, users will see fuel savings of approximately 10 gallons a day per unit,
The carbon dioxide and fuel consumption benefits of both electric and fuel-cell vehicles will depend to a significant degree on the emissions characteristics of the source used to generate the electricity or hydrogen fuel that powers the vehicle (Babaee et al., 2014).
Energy consumption and emissions associated with fuel production, distribution and processing, vehicle efficiency, and end-of-life may contribute to a substantial share of overall vehicle emissions and energy consumption.
Recommendation 1.10: NHTSA, in coordination with EPA, should begin to consider the well-to-wheel, life-cycle energy consumption and greenhouse emissions associated with different vehicle and energy technologies to ensure that future rulemakings best accomplish their overall goals.
Caterpillar Inc. is currently building 45 automated, 240-ton mining trucks to operate at an Australian iron-ore mine without an onboard operator (Berman, 2013).
Optimistic estimates are that the first automated long-haul trucks (ALHTs) may be commercially viable by the mid- to late-2020s, and could decrease fuel consumption by 15 to 20 percent compared to today’s traditional fleets through more
Green Logistics
Examples of such measures that could impact MHDVs are access control (including lane restrictions), urban traffic control measures, road pricing, smart traffic lights that provide more information to drivers on road conditions and traffic, ramp metering, and other fleet and fuel management approaches..
Electrification of accessories provides a 3 to 5 percent fuel consumption reduction if applied as a package on a hybrid vehicle. This benefit is more effective in urban driving conditions and in short-haul use; line-haul applications will benefit less.
It was confirmed by testing that a further reduction of 1 to 1.5% in fuel consumption may be obtained with thinner oils once durability has been confirmed. Thermostatic control of oil cooler-a solution used selectively in the past-can maximize lubricant performance over a broad temperature range. Some testing has reported a reduction in fuel consumption closer to 2%. The effect is more pronounced for cold starts and low-load operation.
o Hybrid power trains, including regenerative braking, engine downsizing, engine shut- off, enabling electrification accessories, plug-in hybrids, etc. No additional new hybrid systems have been identified in the reviews to date. However, given the high duty-cycle dependency, energy storage methods, costs, and relatively large potential fuel consumption reductions projected across most vehicle classes, NHTSA should form a study focused in this area to identify current realistic penetration rates and appropriate simulation and test methodologies to determine the resulting potential for fuel consumption reduction. Several manufacturers pointed out that with the ever more rapid rates at which new energy sources and new energy storage technologies are being adopted, the points of regulation and the certification methodologies need to be examined and potentially modified to more accurately evaluate and credit this trend. Improvements to be evaluated included propulsion system dynamometer certification instead of engine-only certification; more emphasis on transients in modeling, simulation, and testing; and standards and certification only at the vehicle level.
o Vehicle mass; vehicle lightweighting. The truck weight impacts the power needed to move the vehicle through rolling resistance, climbing grades, and accelerations. Use of lightweight materials and structures, such as cab structures, wheels, fifth wheel, bell-housing, etc., have contributed to reducing weight in tractors; additionally, aluminum composite panels have reduced the weight of trailers. A barrier to further reduction is the higher cost of light materials. Lightweighting is simultaneously balanced by the increase in vehicle mass needed to accommodate additional systems and equipment, such as new emission control equipment, aerodynamic improvement equipment, waste heat recovery, and hybrid components. No additional new technologies have been identified to date.
o Fuel efficiency or greenhouse gases versus cost. Reducing fuel use or GHG emissions may not be the most economically attractive scenario. Technology costs in some cases may exceed fuel savings over the vehicle life, and the least expensive fuel and technology combination may not offer the best efficiency or lowest GHG scenario. At a higher level, fuel choices may have substantial economic impacts beyond the trucking industry. For example, an advanced aerodynamic device that offers drag reduction of less than 1 percent is unlikely to offer payback during the first period of ownership if the weight and cost cross a certain threshold.
o Energy security versus efficiency and emissions. The use of alternative energy resources or a balancing of source uses may not yield highest efficiency, lowest GHG, or lowest criteria pollutants, but it may satisfy compelling national needs. For example, natural gas, as a domestic fuel, displaces imported oil. However, a spark- ignited natural gas engine is generally less energy efficient than a diesel engine.
These metrics all have different currencies, and it is impossible to establish exchange rates between them from purely technical arguments. The balancing of these metrics is an issue of policy.
COMMENTS ON THE CALHEAT REPORT FOR THE CALIFORNIA ENERGY COMMISSION
The California Hybrid, Efficient and Advanced Truck Research Center (CalHEAT) recently completed a study of trucks in California (Silver and Brotherton, 2013). The report provides valuable information related to the baseline of vehicles in California. The methodology used may serve as a model for developing a baseline for commercial vehicles in the entire United States. The abstract from that study reads as follows:
The CalHEAT reports also note that . . . as the first step in the development of this Roadmap, CalHEAT performed a California Truck Inventory Study to better understand the various types of trucks used in California, their relative populations, and how they are used. The analysis included nearly 1.5 million commercial medium and heavy-duty trucks, grouped by weight and application, to establish a baseline inventory and determine fuel use and potential for efficiency and emissions improvements. CalHEAT also conducted Phase I research to characterize the California truck population by size, use, and emissions, and prepared a baseline report of available technology and pathways for improvement.
ANNEX FIGURE 4A-7 North American Class 8 production. SOURCE: ACT Research.
FIGURE 4A-5 ATA truck tonnage index and ATA truck loads index NOTE: S.A., seasonally adjusted. SOURCE: ACT Research, copyright 2013. ANNEX FIGURE 4A-8 North American Class 5 thru Class 7 production. SOURCE: ACT Research.
ANNEX FIGURE 4A-10 Average age of active population of U.S. Class 8 vehicles. SOURCE:
fracturing process.5 At the surface, an integrated management plan is needed to address the supply, handling, reuse, and disposal of the fracking fluid to ensure sustainability throughout the production cycle.
In the electric power sector, the low price of NG has directly caused the closure of coal plants, as it has become more economical to use combined-cycle NG plants (with thermal efficiencies up to 65 percent) for electricity production. However, fuel price is the dominant contributor to the cost of electricity (55 percent). One analysis concluded that the break-even fuel price is between $4 and $6 per million British thermal units (mmBTUs). 6 In the heavy-duty transportation sector, price has a less direct effect on the use of NG as a fuel because delivering and compressing (or liquefying) the fuel account for a large share of the price at the pump. The break-even price of NG relative to diesel fuel is around $6 per million BTU (predelivery, not at the pump). If the costs of NG vehicles themselves come down relative to the costs of their diesel counterparts (discussed in the next section), the break-even value could be as high as $9 to $12 per million BTU. If, as projected by the Energy Information Administration (EIA), the price of NG in 2035 is about $7 per million BTU (EIA, 2013a), its use in the transportation sector will likely depend in part on future technological improvements. Currently, the biggest obstacles to NG use for freight transportation are (1) the lack of widespread and dependable infrastructure, (2) the substantial increase in weight and cost of the fuel tanks compared to diesel tanks, and (3) the availability of NG vehicles, although almost all MHDV manufacturers now offer a NG engine. More detailed discussion of infrastructure and technology follows in a later section of this chapter. Pipeline and infrastructure investment in the United States and Canada is likely to exceed $200 billion over the next 25 years (see footnote 2). EIA expects increased production, lower imports, higher exports, and higher prices, as shown in Table 5-1.
NG largely consists of methane, which is a powerful GHG. Leakage, most of which is estimated to come from gas production activities, could negate the hoped for climate benefits of reducing CO2 emissions by replacing other fossil fuels with NG. Methane has a shorter lifetime in the atmosphere than carbon dioxide, but its higher radiative forcing -that is, its ability to redirect heat that would otherwise escape the atmosphere-means that over 100 years it has 20 times the GHG impact of CO2. One analysis concluded that after taking into account current estimates of leakage, converting heavy-duty diesel trucks would have a net negative effect on climate change for centuries.4 One estimate of gas leakage, based on measurements at 190 onshore gas production sites, is 0.42 percent of the total gas production (Allen et al., 2013). Note that this leakage exceeds the amount of NG currently used in transportation. Other estimates of fugitive emissions have been significantly higher (e.g., Howarth et al., 2011).
NATURAL GAS ENGINES AND VEHICLES Technology Overview NG internal combustion engines are a well-developed and established technology. There are over 11 million NG vehicles worldwide, including passenger vehicles. In the United States, NG-fueled MHDVs, especially transit buses, have been incentivized for roughly 20 years in some states as part of emission- reduction programs. For MHDVs to use natural gas fuel, the most significant differences from current vehicles are the onboard fuel storage method and, for compression ignition (diesel-fueled) vehicles, the means of introducing and igniting the fuel in the engine. On-vehicle storage is either by high-pressure (3,600 psi is typical) CNG cylinders or by cryogenic containers filled with LNG. An illustration comparing on-vehicle storage of NG with diesel is shown in Figure 5-3.
Prices are per million BTU in 2012 dollars. Note that a million BTU is equivalent to about 8 gallons of diesel fuel. Thus, natural gas costs on the order of $2.00 per gallon equivalent, much less than diesel fuel. SOURCE: EIA (2013a).
For the same truck mission, the CNG tank plus fuel weighs about four times as much as a diesel tank plus fuel. LNG tanks and fuel weigh about twice as much as diesel. The cost of either CNG or LNG storage adds $40,000 to $50,000 to the cost of a heavy truck, but with the current low price of NG, the payback period for long-haul trucks is on the order of only 2 years. There are three general technical classifications of NG engines, as shown in Table 5-2. Either CNG or LNG can replace gasoline with only modest changes to the spark ignition (SI) engine. Compression ignition (CI) engines are more complicated; NG can be used in combination with diesel fuel (dual-fuel); or it can supply all the energy to a high-pressure direct-injection (HPDI) CI engine, in which a small amount of diesel fuel is needed to achieve ignition.
As of 2010, the number of medium- and heavy-duty NG vehicles in the United States is estimated to have been between 30,000 and 50,000, out of roughly 10 million total MHDVs (TIAX for American Natural Gas Association [ANGA]).
Fuel Consumption and GHG Comparisons of Natural Gas and Diesel Engines
When a fuel is combusted, its CO2 release per unit heat released is a function of its carbon content. Because it has a relatively low carbon content, NG releases about 28 percent less CO2 per BTU of heat than diesel fuel. However, SI engine efficiency is considerably lower than that of mature diesel engines, especially at light loads, partially offsetting the inherent GHG benefit of NG. In addition, unburned methane may be emitted by the vehicle, and upstream emissions from the production and delivery of the NG must be considered in a well-to-wheels comparison. Methane is a very potent GHG, so if these emissions are significant, NG vehicles could contribute more to GHG emissions than diesel vehicles.
While the results differ somewhat, NG engines and vehicles generally emit about 5 to 20 percent less CO2 (Krupnick, 2010; Kamel et al., 2002; Greszler, 2011). The advantage for NG is very dependent on the drive cycle. One estimate of the impact of methane emissions, shown in Figure 5-5, is that they reduce the CO2-equivalent GHG emissions benefit of NG from 13 percent to only 5 percent. This review of the data comparing diesel and NG engines affirms that the chemical advantage of NG for low GHG emissions is largely (but not completely) offset by the lower efficiency of most NG-fueled heavy-duty engines. This will need to be considered in setting specific GHG and fuel consumption standards for medium- and heavy-duty vehicles using NG, as was done in setting different standards for gasoline and diesel engines.
With the recent increase in the availability of low-cost NG, it is anticipated that its use in long-haul Class 7 and Class 8 trucks will increase, especially using LNG as a means of extending vehicle range.
Heavy trucks are 30 to 40 times heavier than passenger vehicles.
Liquefied motor vehicle. NG fuel could allow for the design of more efficient and less costly engines. However, a standard for in-use motor vehicle NG could require further processing of some pipeline gas before compression or liquefaction. Given the limited demand for motor vehicle NG currently envisioned, compared to nationwide consumption for other purposes such as home heating and power generation, it is not clear if suppliers of NG would invest in the gas cleanup needed for motor vehicle fuel. This could result in NG fueling stations being unavailable in certain areas where pipeline gas does not meet motor vehicle fuel specifications. This could impede the increased use of NG as a motor vehicle fuel. Finally, as noted above, the fuel tank, whether for CNG or LNG, accounts for most of the cost increment for NG vehicles over equivalent gasoline or diesel vehicles. In addition to cost, weight can be an issue. The cheapest solid steel (Type 1) cylinders weigh four to five times as much as gasoline or diesel tanks of the same capacity; advanced (Type 3) cylinders with thin metal liners wrapped with composite weigh about half as much as Type 1 tanks, although they cost more. Tanks with polymer liners weigh even less, but are even more expensive. Higher pressure tanks (up to 10,000 psi) could reduce fuel storage space, but at added cost and increased energy required to compress the gas.
FIGURE 5-6 Conceptual diagram of compressed natural gas filling stations. SOURCE:
http://www.afdc.energy.gov/fuels/natural_gas. html.
but diesel fuel still has about 1.7 times the volumetric energy density of LNG. As shown in Figure 5-3, the approximate range per 100 gallons in a long-haul truck is: 650 miles (diesel); 380 miles (LNG); and 170 miles (CNG). LNG fueling stations are similar in configuration and operation to gasoline and diesel fuel retail outlets. LNG is delivered to the fueling station in tanker trucks, stored there, and dispensed into vehicles with cryogenic LNG storage tanks (see Figure 5-7). Many LNG fueling sites supply CNG as well. The main disadvantage of LNG is that it gradually boils off as ambient heat penetrates the tank no matter how well insulated it is.
CNG Infrastructure. NG is moved throughout the United States in an extensive network of pressurized pipelines. According to the American Gas Association (AGA, undated), there are 1.9 million miles of CNG distribution lines and an additional 300,000 miles of transmission lines. The transmission lines are for long distance interstate transport and operate at high pressure, from 200 to 1,500 psi. The distribution and service lines to homes operate at low pressure, approximately 50 psi to less than 1 psi. CNG refueling stations for vehicles are connected to points in the distribution pipeline network. The gas industry spends over $6 billion per year on the transmission lines and $4 billion per year expanding the distribution system. There are 632 public CNG vehicle refueling locations in the United States (AFDC, undated) and around 1,200 including stations for private fleets (Weeks, 2013).
CNG stations are estimated to cost $600,000 to $1 million, with time-fills in the lower part of the range and fast-fills in the upper (ANGA, undated). These costs will be a considerable hindrance to the growth of CNG as a passenger vehicle fuel. One study estimated that between 16,000 and 32,000 stations would be needed to support a thriving NG vehicle population, with a much smaller number of refueling sites needed for heavy trucks (ANGA, undated). Equipping another 9,000 public stations will cost in the range of $5.4 to $9 billion.
LNG use is growing in transportation, especially for trucks that operate almost continually, but it probably precludes the use of LNG in light-duty vehicles. Only about 40 nonprivate LNG fueling stations are in operation in the United States, many of them in California (AFDC, undated; TIAX, 2009). Clean Energy Fuels Corporation has been establishing a cross-country network of LNG fueling stations (“America’s Natural Gas Highway”), with near-term plans for 100 LNG stations. Shell is working with TravelCenters of America to offer LNG for highway trucks and has a joint cooperation agreement on LNG with Volvo. LNG is produced at only about 50 to 60 sites in the United States, and there are a few LNG import terminals, so transport distance to LNG dispensing stations could be a detriment.
NG can be converted to other fuels using well-known processes and technology. Each has advantages and disadvantages for storage, GHG impact, and cost: o Dimethyl ether (DME) o Methanol o Ethanol o Gas-to-liquids (GTL) o Ammonia o Electricity o Hydrogen (for fuel cell vehicles
GTL plants have been established worldwide where low-cost NG is available. To be profitable, the scale of GTL plants is enormous as is the capital investment, and the production of high-value chemicals in addition to fuel is important. Shell and Sasol are the largest GTL producers. Operating since 2011, Shell’s Pearl GTL facility in Qatar is one of the largest such plants in the world (140,000 BPD products),
NG is the source for 95 percent of hydrogen production in the United States, and fuel cells are candidates for certain heavy vehicles such as buses and drayage tractors. In California, fuel cell heavy vehicles are a key option where zero-emission vehicles are needed. There are 10 hydrogen refueling stations in the United States, most of them in California (AFDC, undated).
NG is a feedstock for anhydrous ammonia, a feasible engine fuel that can be stored as a liquid at pressures similar to propane. Although it has been demonstrated in both SI and CI combustion systems, its toxicity and acute incompatibility with the human body make its widespread use as a transportation fuel impractical. About 30 percent of U.S. electricity comes from burning NG (EIA, 2013b), and this fraction is growing rapidly. Combined-cycle (gas turbine/steam turbine) technology can be highly efficient. Some units are over 60 percent efficient, much higher than coal-fired generation. Electric vehicles (battery electric or plug-in hybrids) can take advantage of NG in this path, thereby displacing petroleum.
Only electricity and hydrogen from NG can produce lower GHG emissions than direct combustion of NG in engines due to the inherently high efficiency of battery electric and fuel cell vehicles.
Key factors influencing the decision to purchase a NG vehicle are the fuel cost savings, initial cost premium for the vehicle, and ready access to refueling facilities.
Currently about half of new refuse trucks are NG-fueled, and that is expected to rise to 90 percent soon, in part because of local, state, and national incentives. However, refuse trucks collectively are not large consumers of fuel, so the greater opportunity for NG substitution is in Class 7 and Class 8 tractor-trailer rigs, which use about 20 times as much.
References (very few of them)
6 Revis James, Electric Power Research Institute, “The Role of Natural Gas in the Electricity Sector,” Presentation to the Board on Energy and Environmental Systems, September 11, 2012.
Mark Boling, Southwestern Energy, “Forum on Unconventional Natural Gas Issues: Water Quality,” Presentation to the Board on Energy and Environmental Systems, September 11, 201
Berman, D.K. 2013. Daddy, what was a truck driver? Wall Street Journal, July 23. Broder, J., and C. Krauss. 2012. “A big, and risky, energy bet.” New York Times. December 17.
4 Steven Hamburg, Environmental Defense Fund, “Methane leakage from natural gas production, transport and use- Implications for the climate,” Presentation to the Board on Energy and Environmental Systems, September 11, 2012.
Lempert, R. 2007. Scenario analysis under deep uncertainty. Modeling the Oil Transition: A Summary of the Proceedings of the DOE/EPA Workshop on the Economic and Environmental Implications of Global Energy Transitions, D.L. Greene, ed., ORNL/TM- 2007-014.
North American Council for Freight Efficiency (NACFE) and Cascade Sierra Solutions (CSS). 2013. Barriers to the Increased Adoption of Fuel Efficiency Technologies in the North American On-Road Freight Sector. July
Silver, F., and T. Brotherton. 2013. Research and Market Transformation Roadmap to 2020 for Medium-and Heavy-Duty Trucks. CEC-XXX2013-XXX. Draft Rev # 7 Dated 6-14-2013. Sacramento, Calif.: California Energy Commission.
38A. Webb, 2013, “Auto makers renew interest in fuel-cell vehicles: Despite cost, political hurdles.” Available at http://wardsauto. com/vehicles-amp-technology/auto- makers-renew-interest-fuelcell-vehicles-despite-cost-political-hurdles. 39