
 Book review by Alice Friedemann at energyskeptic of “Spain’s Photovoltaic Revolution. The Energy Return on Investment”, by Pedro Prieto and Charles A.S. Hall. 2013. Springer.
Conclusion: the EROI of solar photovoltaic is only 2.45, very low despite Spain’s ideal sunny climate. Germany’s EROI is probably 20 to 33% less (1.6 to 2), due to less sunlight and less efficient rooftop installations.
This book is the best EROI study that has ever been done. It is based on 3 years of real data from all the PV facilities in Spain. According to Charles Hall: “EROI values in many studies are too high because they used “nameplate” values (1,800 kWh/M2-year) for assessing electricity outputs from PV facilities rather than the actual output. Nameplate is inaccurate since the actual electricity output is reduced by clouds, bird droppings, overheating, dust accumulation, lightning, equipment failures, and degradations over time to less than “Nameplate” value. Also, too much output can fry electrical components at various locations in the grid. We found that the actual output for a facility in Spain with a nominal output of 1,800 kWh/m2-yr was measured at an actual 1,375 kWh/m2-year. Ferroni and Hopkirk (2016) also found measured values considerably less than nameplate values.”
Prieto and Hall didn’t use guesses from models and focus only on the energy to make solar modules that comprise just one third of a solar facility.
It is a model study that all EROI research should strive for, and that the Stanford University’s proposed net energy department should uses as a basis for proper boundaries, with the addition of labor (which Prieto and Hall didn’t use for reasons you’ll see in part 2).
Part 1: introduction, overview, and book review.
Part 2: Tilting at Windmills, Spain’s disastrous attempt to replace fossil fuels with Solar PV, Part 2. Critiques and rebuttals of Prieto & Hall’s “Spain’s Photovoltaic Revolution…”
Alice Friedemann www.energyskeptic.com author of “When Trucks Stop Running: Energy and the Future of Transportation”, 2015, Springer and “Crunch! Whole Grain Artisan Chips and Crackers”. Podcasts: Practical Prepping, KunstlerCast 253, KunstlerCast278, Peak Prosperity , XX2 report ]
Note to readers: Charles Hall is one of the originators of the concept of EROI (along with Howard Odum and many others). As a tenured professor not funded by any special interests, he is one of the most respected, cited, and unbiased scientists writing on EROI. I found this description of Hall at an article about energy storage and EROI by John Morgan:
“…US fisheries ecologist Charles Hall noted that the energy a predator gained from eating prey had to exceed the energy expended in catching it. In 1981, Hall applied this net energy analysis to our own power generation activities, charting the decline of the EROI of US oil as ever more drilling was required to yield a given quantity, and suggesting the possibility that oil may one day take more energy to extract than it yields. Hall and others have since estimated the EROI for various power sources, a difficult analysis that requires identification of all energy inputs to power production. EROI is a fundamental thermodynamic metric on power generation. Net energy analysis affords high-level insights that may not be evident from looking at factors such as energy costs, technological development, efficiency and fuel reserves, and sets real bounds on future energy pathways. It is unfortunately largely absent from energy and climate policy development.”
This is the only solar PV EROI analysis that uses 3 years of real data from hundreds of solar PV facilities, not theoretical values
This is the only estimate of Energy Returned on Invested (EROI) study of solar Photovoltaics (PV) based on real data. Other studies use models, or very limited data further hampered by missing figures about lifespan, performance, and so on that are often unavailable due to the private, proprietary nature of solar PV companies. Since the Spanish government owned these facilities, the data was made public.
And since Prieto built some of them, he also could account for every service and component required to build a solar PV facility.
Models often limit their life cycle or EROI analysis to just the solar panels, which represents only a third of the overall energy embodied in solar PV plants. Other studies leave out dozens of energy inputs, leading to overestimates of energy such as a payback time of 1-2 years (Fthenakis), or exaggerated EROI values of 8.3 (Bankier), and EROIs from 5.9 to 11.8 (Raugei et al).
Prieto and Hall used government data from Spain, the sunniest European country, with accurate measures of generated energy from over 50,000 installations using several years of real-life data from optimized, efficient, multi-megawatt and well-oriented facilities. These large installations are far less expensive and more efficient than rooftop solar-PV.
Prieto and Hall added dozens of energy inputs missing from previous solar PV analyses. Charles A. S. Hall is one of the foremost experts in the world on the calculation of EROI.
A minimum EROI of at least 10 is required to maintain civilization as we know it (Hall et al. 2008). In 2014 Lambert and Hall increased the EROI required to 14.
- If you’ve got an EROI of 1.1:1, you can pump the oil out of the ground and look at it.
- If you’ve got 1.2:1, you can refine it and look at it.
- At 1.3:1, you can move it to where you want it and look at it.
- We looked at the minimum EROI you need to drive a truck, and you need at least 3:1 at the wellhead.
- Now, if you want to put anything in the truck, like grain, you need to have an EROI of 5:1. And that includes the depreciation for the truck.
- But if you want to include the depreciation for the truck driver and the oil worker and the farmer, then you’ve got to support the families. And then you need an EROI of 7:1.
- And if you want education, you need 8:1 or 9:1.
- And if you want health care, you need 10:1 or 11:1.
Spain saw much good coming from promoting solar power. There’d be long-term research and development, a Spanish solar industry, and many high-tech jobs created, since the components for the solar plants would be manufactured locally. Spain imports 90% of its fossil fuels, more than any other European nation, so this would lower expensive oil imports as well.
To kick start the solar revolution, the Spanish government promised massive subsidies to solar PV providers at 5.75 times the cost of fossil fuel generated electricity for 25 years (about a 20% profit), and 4.6 times as much after that. Eventually it was hoped that solar power would be as cheap as power generated by fossil fuels.
Financial Fiasco
The gold rush to get the subsidy of 47 Euro cents per kWh began. Because the subsidy was so high, far too many solar PV plants were built quickly — more than the government could afford. This might not have happened if global banks hadn’t got involved and handed out credit like candy.
Even before the financial crash of 2008 the Spanish government began to balk at paying the full subsidies, and after the 2008 crash (which was partly brought on by this over-investment in solar PV), the government began issuing dozens of decrees lowering the subsidies and allowed profit margins. In addition, utilities were allowed to raise their electric rates by up to 20%.
The end result was a massive transfer of public wealth to private solar PV investors of about $2.33 billion euros per year, and businesses that depended on cheap electricity threatened to leave Spain.
Despite these measures, the government is still spending about $10.5 billion a year on renewable energy subsidies, and the Spanish government has had many lawsuits brought against them for lowering subsidies and profit margins.
Solar companies went bankrupt after the financial crash, including the Chinese company Suntech, which sold 40% of its product to Spain. About 44,000 of the nation’s 57,900 PV installations are almost bankrupt, and companies continue to fail (Cel Celis), or lay off many employees (Spanish photovoltaic module manufacturer T-Solar).
Nor were new jobs, research, and development created, since most of the equipment and solar panels were bought from China. But unlike China, where the government insisted PV manufacturing be supported by massive research and development (and cybertheft of intellectual property from the United States and other nations), the only “innovations” capitalists in Spain sought were the numerous financial instruments they “invented” to make money, such as “solar mutual funds”. Far more money went into promoting and selling solar investments than research and development.
Prieto and Hall believe this fiasco could have been avoided if the Spanish government had invited energy and financial analysts to flow-chart the many costs and energy inputs to have had a more realistic understanding of what the costs would be versus the extremely small amount of electricity added to Spain’s electric supply.
Spain’s largest renewable energy company, Abengoa, could soon become Spain’s largest bankruptcy. Abengoa’s stock price has plunged over 50%, reducing its market value half a billion dollars. As a result, Abengoa began insolvency proceedings that give the firm just four months to find a buyer or reach an agreement with its creditors. Abengoa has invested more than $3 billion in renewable energy projects in the United States, including several utility-scale concentrated solar power projects. Most of Abengoa’s renewable energy assets in the U.S. are owned by Abengoa Yield, the U.S.-based subsidiary of the Spanish renewable energy company. The U.S. Department of Energy provided a federal loan guarantee of $1.45 billion for Abengoa’s 280 megawatt (MW) Solana project in Arizona, the largest parabolic trough plant in the world. Abengoa is also developing the 280 MW Mojave Solar project in California, which also used parabolic trough technology. Abengoa has also invested more than $1.4 billion in more than half a dozen U.S. ethanol and advanced biofuels plants. Although Abengoa owns a 47% equity stake in Abengoa Yield, the subsidiary has thus far managed to limit the financial fallout from the problems at its parent company. That may soon change. Abengoa Yield is tied to Abengoa through a series of cross default clauses included the debt agreements used to finance several projects (Pentland 2015).
Germany’s is having a similar financial solar power fiasco
Germany has spent about $100 billion Euros between 2000-2011 according to Alexander Neubacher’s article in Der Spiegel Solar Subsidy Sinkhole: Re-Evaluating Germany’s Blind Faith in the Sun (some excerpts below):
“For weeks now, the 1.1 million solar power systems in Germany have generated almost no electricity. The days are short, the weather is bad and the sky is overcast. As is so often the case in winter, all solar panels more or less stopped generating electricity at the same time.
To avert power shortages, Germany imports large amounts of electricity generated at nuclear power plants in France and the Czech Republic and powering up an old oil-fired plant in the Austrian city of Graz.
Solar farm operators and homeowners with solar panels on their roofs collected more than €8 billion ($10.2 billion) in subsidies in 2011, but the electricity they generated made up only about 3% of the total power supply at unpredictable times.
The distribution networks are not designed to allow tens of thousands of solar panel owners to switch at will between drawing electricity from the grid and feeding power into it.
Because there are almost no storage options, the excess energy has to be destroyed at substantial cost. German consumers already complain about having to pay the second-highest electricity prices in Europe.
Under Germany’s Renewable Energy Law, each new system qualifies for 20 years of subsidies. A mountain of future payment obligations is beginning to take shape in front of consumers’ eyes.
According to the Rhine-Westphalia Institute for Economic Research (RWI), the solar energy systems connected to the grid in 2011 alone will cost electricity customers about €18 billion in subsidy costs over the next 20 years. The RWI also expects the green energy surcharge on electricity bills to go up again soon. It is currently 3.59 cents per kilowatt hour of electricity, a number the German government had actually pledged to cap at 3.5 cents. But because of the most recent developments, RWI expert Frondel predicts that the surcharge will soon increase to 4.7 cents per kilowatt hour. For the average family, this would amount to an additional charge of about €200 a year, in addition to the actual cost of electricity. Solar energy has the potential to become the most expensive mistake in German environmental policy.
Solar lobbyists like to dazzle the public with impressive figures on the capability of solar energy. For example, they say that all installed systems together could generate a nominal output of more than 20 gigawatts, or twice as much energy as is currently being produced by the remaining German nuclear power plants.
But this is pure theory. The solar energy systems can only operate at this peak capacity when optimally exposed to the sun’s rays (1,000 watts per square meter), at an optimum angle (48.2 degrees) and at the ideal solar module temperature (25 degrees Celsius, or 77 degrees Fahrenheit) — in other words, under conditions that hardly ever exist outside a laboratory.
In fact, all German solar energy systems combined produce less electricity than two nuclear power plants. And even that number is sugarcoated, because solar energy in a relatively cloudy country like Germany has to be backed up with reserve power plants. This leads to a costly, and basically unnecessary, dual structure.
Because of the poor electricity yield, solar energy production also saves little in the way of harmful carbon dioxide emissions, especially compared to other possible subsidization programs. To avoid a ton of CO2 emissions, one can spend €5 on insulating the roof of an old building, invest €20 in a new gas-fired power plant or sink about €500 into a new solar energy system.
Former industry giant Solarworld, based in the western city of Bonn, is having problems. Solon and Solar Millennium, once considered model companies, have gone out of business. Schott Solar shut down a plant that was producing solar cells in Alzenau near Frankfurt, shedding 276 jobs and losing €16 million in government subsidies in the process.”
So is Japan
If every solar plant now on the drawing board were actually to be built in the Japanese region of Kyushu, it would cost users $23 billion, four times the premium they’re paying now. Solar power here is costly for consumers because of high state-mandated prices. Utilities say their infrastructure cannot handle the swelling army of solar entrepreneurs intent on selling their power or handle the fluctuating output of thousands of mostly small solar producers. To do this, utilities need to install more hardware — transmission cables, substations and the like — and develop new kinds of expertise to avoid disruptions. To make renewables work they have to be properly connected to the power system. Installed solar capacity roughly doubled since 2012, when a law took effect requiring utilities to buy renewable energy from outside producers at rates far above market prices. By last summer it stood at 3.4 gigawatts, about equal to the output of three modern nuclear reactors but only when the sun was shining at full strength. An additional 8.4 gigawatts’ worth of projects are planned, more power than the region consumes on some low-demand days — and far too much for Kyushu Electric’s grid to handle without the risk of failures. New transmission cables are being laid but progress is slowed by the expensive task of securing land rights (Soble).
A realistic look at solar PV can give us better ideas of how to cope in the future
Solar advocates can learn from this analysis as well to design solar PV with far less dependency on fossil fuels. That can only be done by realistically looking at all of the inputs required to build a solar PV plant. Narrowing the boundaries to avoid these realities is not good science and leads to wasted money and energy that could have been better spent preparing more wisely for declining fossil fuels in the future such as Heinberg’s “50 Million Farmers“.
Some energy statistics
Oil
- The world burns 400 EJ of power, though after fossil fuels begin their steep decline, there will be 10-20 EJ less per year.
- Very large oil fields provide 80% of global oil, and they’re declining from 2 to 20% per year, on average at 6.7%.
- The exponential decline rate is expected to increase to 9% by 2030 if not enough investments are made – and perhaps 9% or more even with investments
- Oil is the basis of 97% of transportation
Spain’s solar photovoltaic electricity
- It’s the 2nd largest installation of PV on earth
- Produces about 10% of the world’s PV power: 4,237 MW—equal to four large 1000 MW coal or nuclear power plants
- Solar PV would have to cover 2,300 square miles to replace the energy of nuclear and fossil fuel plants. You’d also need the equivalent of 300 billion car batteries to store power for night-time consumers (Nikiforuk).
- In 2009, these plants generated 2.26% of Spain’s electricity, the largest percent of any nation in the world
2009 Types of PV Installations in Spain (ASIF. July 2010 report)
- 63% Fixed plants
- 13% 1-axis trackers
- 24% 2-axis trackers
Types of PV Used
- .6% HCPV
- 2.1% Thin Film
- 97.3% Crystalline silicon
Amount of Power generated
- 36% < 2 MW
- 20% 2-5 MW
- 44% > 5 MW
Where were the PV panels placed
- 2.2 Rooftop
- 97.8 On the ground (far more efficient than rooftop)
Why wasn’t as much power produced as promised?
Only 66% of the nameplate, or peak power, was actually delivered over 2009, 2010, and 2011. The expected amount was 1,717 GWh/MWn but only 1,372 GWh/MWn were produced.
Typical losses in Performance Ration (PR) analysis (see Slide 14)
% Loss is the “loss factor in % over nameplate”
………..% Loss Reason
- 0.6 Mismatch of modules. One bad apple and all the rest are reduced to the lowest common denominator — the least efficient module. Mismatches can occur from irregular shading, ice, dust, and other problems.
- 1.0 Dust losses can be as high as 4 to 6% if washing isn’t done often enough
- 1.0 Angular and Spectral loss of reflection when the PV isn’t directly aimed at the sun
- 5.5 Losses due to temperature
- 1.0 Maximum power point tracker
- 1.0 DC wiring
- 5.4 AC/DC output of inverter
- 0.4 AC wiring within the PV plant
- 2.1 Medium-voltage losses within the plant
- 0.0 Non-fulfillment of nominal power, Shadowing/Shading, voltage sags, swells, etc
Performance Ratio: 82
Other losses beyond the typical Performance Ratio: extended performance ratio factors
- 8.0 Peak versus nominal installed power factoring
- 2.0 Losses in the evacuation/connection line/transformers
- 11.4 Degradation of modules over time
Will PV modules really last for 25 years? If not, the EROI is less than 2.45
Prieto and Hall distributed the Energy Invested across 25 years, but it is not likely that PV (and other manufacturers) will honor their contracts for that long:
- Many manufacturers are already out of business, and many more will go out of business as their level of technology falls behind advancements elsewhere in the world. Companies who took on lots of debt expecting higher subsidies are failing now and will continue to do so.
- Events of Force Majeure, acts of god, wind, lightning, storms, floods, and hail are likely to damage facilities within the next 25 years.
- The degradation of PV modules may be higher than 1%/year up to a maximum of 20% over 25 years. This figure was very hard to come by, since Solar PV manufacturers don’t like to reveal it. Prieto & Hall found out by looking at commercial contracts.
- Any component that degrades or fails, not just the PV itself, will lower the overall EROI.
- As fossil fuels decline, it will be hard to find the resources to maintain society. These plants will not be high priority, since dwindling diesel fuel will be diverted to agriculture, trucks, and other more essential services.
- Once fossil fuels begin their steep decline, social unrest will make it hard for businesses to operate.
Low EROI: The Devil is in the Details
Most of the book explains the methodology and details of how EROI was calculated. The level of detail even extends to each of the three types of facilities (fixed, 1-axis, 2-axis) for many factors. Below is a partial summary of the Energy Invested table 6.18 in the book with the Energy Invested and money-to-energy columns missing. You can also see an older version in slide 18). Economic expenses (not shown) were converted to GWh/year energy equivalents and spread across 25 years. The book goes to great lengths to explain how they converted money to EROI equivalents.
GWh/year Factors
1) Energy used ON-SITE
- 56.6 Foundations, canals, fences, accesses
- 4.7 Evacuation lines and right of way
- 11.2 Module washing and cleaning
- 28.2 Self consumption in plants
- 138.6 Security and surveillance
2) Energy used OFF-SITE to manufacture ingots / wafers / cells/ modules & some equipment
- 608 Modules, inverters, trackers, metallic infrastructure (labor not included)
3) Other energy used ON-SITE and OFF-SITE
- 96 Transportation (locally in Spain, international (i.e. China)
- 148.4 Premature phase out of unamortized manufacturing and other equipment
- 0 Energy costs of injection of intermittent loads; massive storage systems (i.e. pump-up costs)
- 19.9 Insurance
- 26.4 Fairs, exhibitions, promotions, conferences
- 34.3 Administrative expenses
- 14 Municipal taxes etc (2-4% of total project)
- 8.7 Land cost (to rent or own)
- 16 Indirect labor (consultants, notary publics, civil servants, legal costs, etc)
- 6 Market or Agent representative
- 11.9 Equipment theft and vandalism
- 0 Pre-inscription, inscription, registration, bonds & fees
- 178 Electrical network / power line restructuring
- 39.6 Faulty modules, inverters, trackers
- 198 Associated energy costs to injection of intermittent loads; network stabilization associated costs (combined cycles)
- 0 Force majeure: Acts of God, wind, storms, lightning, storms, floods, hail
[ My comment: note that if the energy to construct the necessary storage systems and grid expansion to cope with when the sun isn’t shining at all or much isn’t included. Nor the inevitable damage that will occur someday from natural disasters or other causes, and the energy of the workers. In part 3 Hall (2017) makes the case why labor should be included in EROI]
The 2,065.3 GWe of the above energy inputs used annually to generate electricity is 40.8% of all the electricity generated by the solar PV plants of Spain, resulting in an EROI of 2.45 (1/.408).
Most life-cycle analyses only consider the 608 GWe of the modules, inverters, etc. They also usually ignore some or all of the Balance of System energy expenses (energy used on-site) and the remaining factors.
I can’t resist a few examples to give you an idea of how complex a solar PV plant is. Every factor had complications and nuances that made this book very interesting and entertaining to read.
The access roads from the main highway to the plant, which across all the PV plants in Spain added up to about 300 km (186 miles), used 450,000 m3 or 900,000 tons of gravel. That takes 90,000 truckloads of 10 tons each traveling an average of 60 km round-trip, or 5,400,000 km (3,355,400 miles) at .31 of diesel per km or 1,620,000 liters of diesel. At 10.7 KWh/liter, that’s 17.3 GWh of fuel. Then you need to add the energy used by other equipment, such as road rollers, shovels, pickups, and cars for personnel, and the energy to grind, mix, and prepare the gravel and the machinery required.
There are also service roads onsite to inverters, transformers, and distributed station housings, the control center, and corridors between rows of modules. There are foundations and canals. A total of 1,572,340 tons of concrete was used, requiring 489.3 GWh of energy.
Surrounding all these facilities are fences 2 meters high that used 3,350 tons of galvanized steel, and another 3,350 tons of steel posts, or 385 GWh of energy.
Washing and cleaning Solar Panels
Solar plants tend to be in desert-like surroundings with little water. Spain is so short on water they’ve got the 4th largest desalinization capacity in the world. Solar PV can’t be washed with tap or well water because they leave calcium and mineralized salts which degrade the PV performance, and can even scratch them. So the water has to be de-mineralized, decalcified, and sometimes even de-ionized. Washing might take place on average four times per year, but that’s not nearly enough – dust storms and dust from agriculture plowing can happen any time of the year, perhaps even right after they’ve been washed.
Critics of their book dismiss these issues by mentioning various techno-fixes. Across all technologies, whether it’s biofuels or nuclear power, this is an easy way for pepole who want to believe in something to dismiss criticism. So for the dust problem here’s an example of how the problem has been “solved”. Critics reply that the technology exists to use an electrostatic charge to repel dust and force it to the edges of the panels. But when you look into this, you find that the technology was developed for NASA to use on Mars back in 2010. On earth, this technology has to compete with cheaper technologies such as blowing air or adding a non-stick layer. And on Earth, it doesn’t work if the dust gets wet and turns to mud. Consider how much EROI (and money) it would cost to replace all of Spain’s solar panels to have this feature. The panels can’t be modified because it’s embedded in the panel using “a transparent electrode material such as indium tin oxide to deliver an alternating current to the top surface of the panel.” That will take some EROI as well. Indium is very expensive — it’s a rare earth metal, and the U.S. Department of Energy considers it critically rare for the next 5 years. China has 73% of the world’s Indium reserves, refines half of it, and limits exports. The USA has been 100% dependent on indium imports since 1972. The U.S. DOE says reductions in “non-clean energy demand” will be needed “to prevent shortages and price spikes”. This article also pointed out that dust storms reduced power production by 40 percent at a large, 10-megawatt solar power plant in the United Arab Emirates. I wonder how bad the dust storms are in Spain? Will the 2nd edition of Prieto & Hall’s book reduce the EROI even further? (Bullis).
Cheaper and More Efficient DOESN’T MATTER: PV is only 1/3 of the EROI
Critics of this book will say cheaper and more efficient PV cells are on the way. But as Prieto and Hall point out, the most effect an improved solar PV could have on the overall EROI is a maximum of 1/3 because of all the other factors. Plus EROI goes down every time the oil price goes up, because that causes all of the other factors to increase. Press releases of solar PV breakthroughs can be very exciting, but keep in mind that none of these past improvements could replace fossil fuels: thin-film, nanotechnology PV, cadmium telluride cells, organic cells, flexible cells, rollable sheets of PV for rooftops, slate modules, multi-junction cells, back-junction cells with 20-40% efficiency, PV grapheme, etc.
These improvements have costs, that’s part of what’s meant by the “premature phase out” factor. Solar businesses and PV plants go bankrupt when out-competed if they can’t afford to make expensive alterations and retrofits.
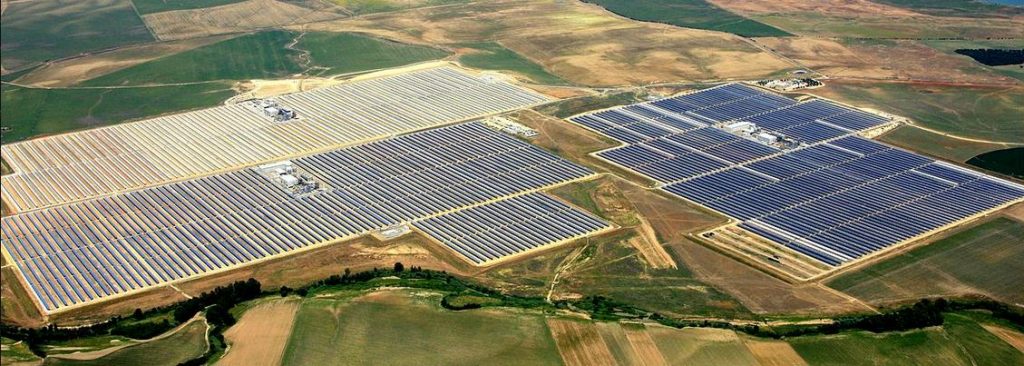
 Two axis tracking PV Plants of 20 MWn and 22.1 MWp. Slide 25 states that to replace a nuclear plant 1/3 that of Fukushima with solar PV, you’d need to expand the area above 430 times to 190 square miles. Photo Source: http://www.flickr.com/photos/87892847@N03
Energy Returned on Energy Invested (EROI)
[Also see pitfall 8 in Gail Tverberg: 8 pitfalls in evaluating green energy solutions]
EROI = Energy returned to society / Energy invested to get that energy
Hall and Prieto believe that solar is a low EROI technology. Solar has too many energy costs and dependencies on fossil fuels throughout the life cycle to produce much energy. It’s more of a “fossil-fuel extender” because PV can’t replicate itself, let alone provide energy beyond that to human society.
Nor is solar PV carbon neutral. Too many of the inputs require fossil fuels.
Solar PV doesn’t come close to providing the 12 or 13 EROI needed to run a complex civilization like ours.
In the introduction, the authors say that “we recognize that some of our inputs will be controversial. We leave it to the reader and to future analysts to make their own decisions about inclusivity and methods in general for a comprehensive analysis of EROI. Whatever your opinion, this study should really open your eyes to the degree to which fossil fuels underlie everything we do in our technological society.”
But I would argue the boundaries can’t possible capture all the oil-based antecedents. Fossil fuels are so embedded in every aspect of our life that we can’t see them. Think about solar PV when you read my summary of Leonard Read’s antecedents of a pencil.
References
Bankier, C.; Gale, S. Energy payback of roof mounted photovoltaic cells. The Env. Eng. 2006, 7, 11-14.
Bullis, K. 26 Aug 2010. Self-Cleaning Solar Panels A technology intended for Mars missions may find use on solar installations in the deserts on Earth. MIT Technology Review.
Colthorpe, Andy. 18 July 2013. Solar Shakeout: Spain’s Cel Celis begins insolvency proceedings PVTech.
Fthenakis, V.H.C. et al. 2011. Life cycle inventories and life cycle assessment of photovoltaic systems. International Energy US Energy Investment Agency (IEA) PVPS Task 12, Report T12-02:2011. Accessed 19 Sep 2012.
Hall, C.A.S., R. Powers, W. Schoenberg. 2008. Peak oil, EROI, investments and the economy in an uncertain future. Pimentel, D. (ed). Renewable Energy Systems: Environmental and Energetic Issues. Elsevier London
Neubacher, A. January 18, 2012. Solar Subsidy Sinkhole: Re-Evaluating Germany’s Blind Faith in the Sun. Der Spiegel.
Nikiforuk,Andrew. 1 May 2013. Solar Dreams, Spanish Realities. TheTyee.ca
Parnell, John. 22 July 2013. Spain’s government accused of killing solar market. PVtech.
Parnell, John. 23 July 2013. Spanish government facing court action over cuts to solar support. PVTech.
Pentland, W. Nov 30, 2015. Spain’s Renewable Energy Powerhouse Abengoa Teeters Toward Bankruptcy. Forbes.
Raugei M., et al., “The energy return on energy investment (EROI) of photovoltaics: Methodology and comparisons with fossil fuel life cycles.” Energy Policy (2012), published on line doi:10.1016/j.enpol.2012.03.00897. See more at: http://www.todaysengineer.org/2013/Jun/book-review.asp#sthash.YsRjuI9R.dpuf
Prieto & Hall, 15 Apr 2011. How Much Net Energy does Spain’s solar PV program deliver? A Case Study. State University of New York 3rd Biophysical Economics Conference. Data sources for Energy Generated and Energy Invested slide 10, How monetary costs were converted to energy units. Slide 12, How the embodied energy costs and boundaries were determined Slides 17, and much more.
Soble, J. March 3, 2015. Japan’s Growth in Solar Power Falters as Utilities Balk. New York Times.
Spanish solar energy: A model for the future? Phys.org
Pingback: OTRA VUELTA DE TUERCA A LA TRE FOTOVOLTAICA | Crisis Energética
Pingback: Elon Musk’s New Battery Will (Not) Save The World From Itself | LiamScheff.com