
September 18, 2013. The Transportation Needs and Impacts of Fracking-Based Energy Extraction. U.S. Department of Transportation, Federal Highway Administration
May 16, 2012. Jack Olson. Impacts of Heavy of Oversize Truck Shipments on the U.S. Highway Network
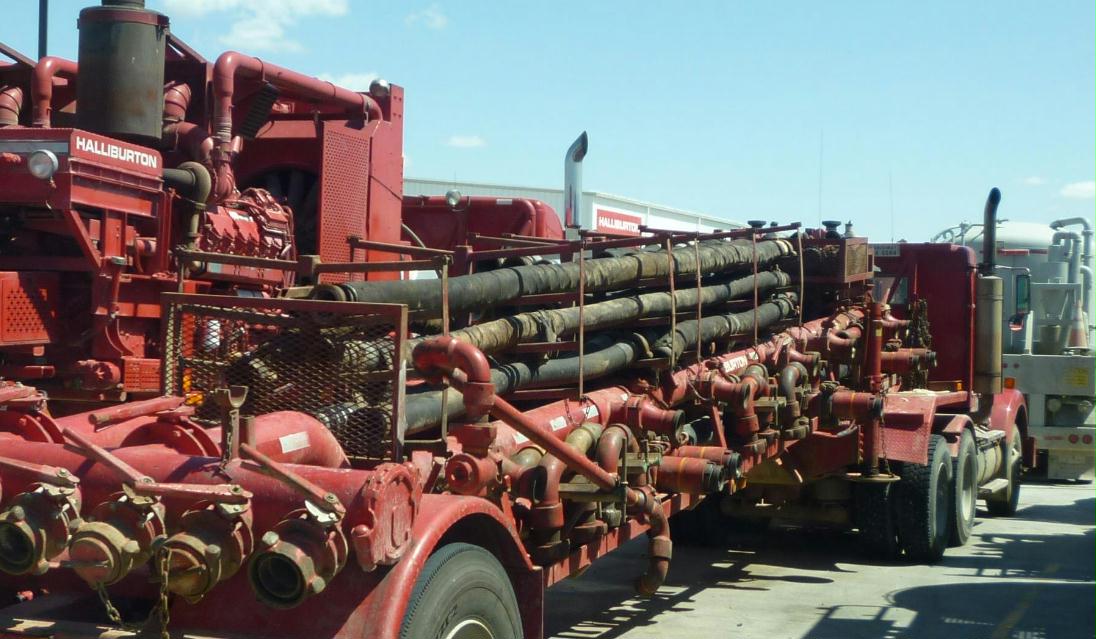
In the early 1990s, these rigs weighed about 90,000 pounds. Today they weigh about 110,000 pounds. This is true for most of the equipment used in the oil industry; it is getting larger. There are many different kinds of equipment necessary to bring an oil well into production, and the number of truckloads that are involved with each of these oil productions is dependent on whether the well is drilled vertically or horizontally. It is also dependent on the depth of the well, the moving efficiencies of the companies that are moving the pieces of equipment, and a variety of other factors that influence the overall figures. A vertical well takes about 400 truckloads one-way, and a horizontal well takes about 1,150 truckloads one-way, or 2,300 truckloads total, inbound outbound.
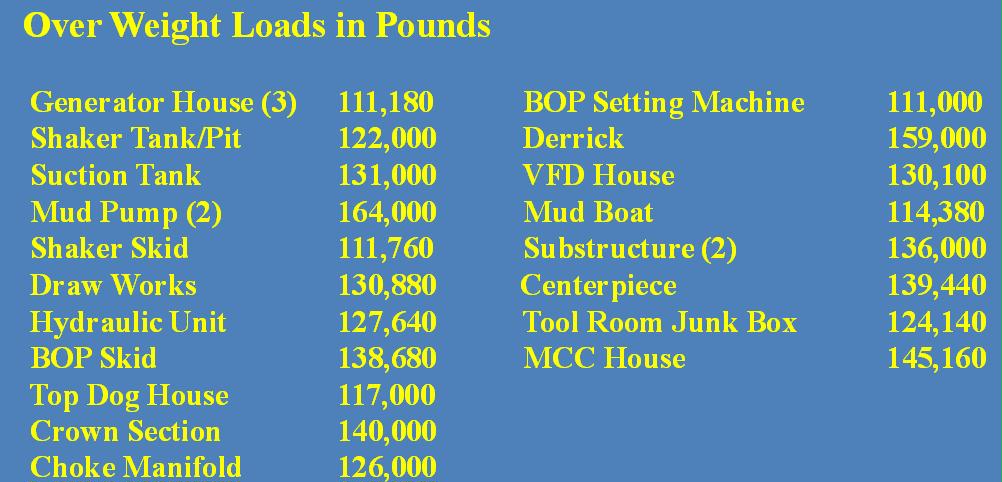
Several of the loads that are used to drill a well are oversized or overweight, many of them exceeding the legal loads in North Dakota of 105,500 pounds on most of our highways. The largest of these is the mud pump, which weighs 164,000 pounds. There are two of those that move into each of the sites. Of the 100 or so loads used to move just the drilling rig portion of the operation when bringing a well into production, 40 to 50 feet are overweight, and 3 out of 4 loads are also oversized.
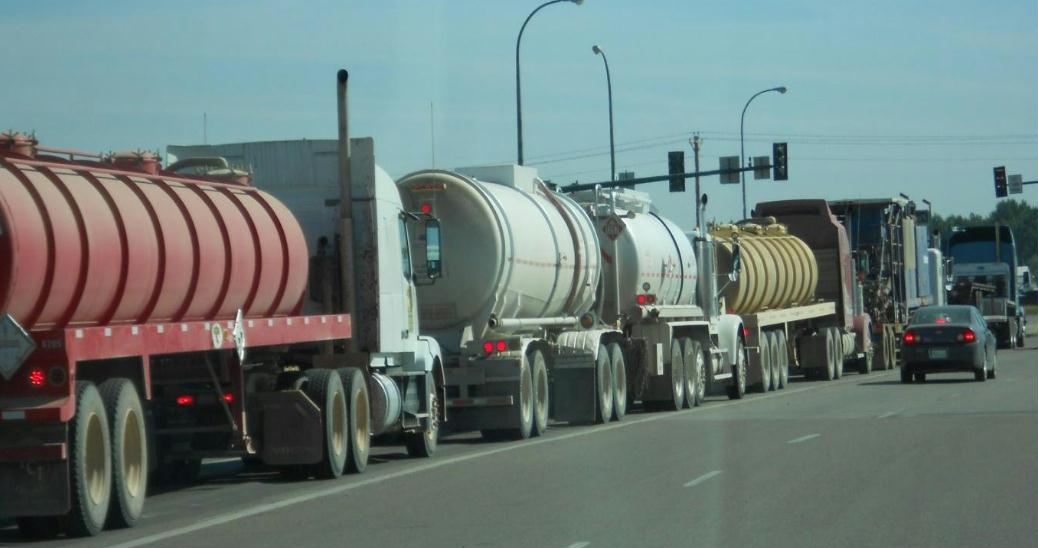
Oil is initially transported to rail facilities or pipeline locations by collection pipelines or trucks – almost exclusively by trucks. About 70% of all oil is currently being trucked from wells to pipelines and transfer locations. On average, a typical Bakken well produces about three truckloads of oil/day during its first year production.
Bakken oil wells produce about one barrel of salt water for every three barrels of oil during the first year of production. Salt water is transported by pipelines in some cases, but most of it is trucked to saltwater disposal sites.
Individual wells are the destination of sand or proppants, which are used to maintain the cracks in the formation so the oil can seep to the well bore.Three years ago, Williston, North Dakota was the only location receiving sand for the fracking process. Today, fracking sand and proppants are shipped to several locations by rail and then by trucks for final delivery to the well sites. The same is true of pipe used in the oil drilling phase. Again, it is brought into the state by rail to several different locations and then transported by truck to the drilling site. In addition to the state’s pipeline infrastructure, which is capable of transporting about 535,000 barrels/day, there are 13 rail facilities capable of transporting about 720,000 barrels/day. Unfortunately, rail and pipeline transportation capacity is not always necessarily available relative to the location of oil production. The typical truck, similar to the one used to transport saltwater, can transport about 220 barrels of oil per load.
The EOG Resources Rail Transload Facility near Stanley, North Dakota currently ships 65,000 barrels/day. Every day, 125 truckloads deliver between 20,000 and 25,000 barrels of oil to the facility.Depending on their size, each of the state’s rail transload facilities have similar truck-generating impacts on the system.
Mark Murawski “Transportation Patterns and Impacts from Marcellus Development”
Each well pad typically uses 3 to 5 acres of land per well and 6-8 wells per pad and developed over 4 to 6 week period. We have 5000 tons of aggregate needed which generates 400 truck trips to do that. That there is actual drilling that occurs that requires more equipment, water and cement that generates another 150-200 truck trips over another 4 to 5 week period.
The third stage is the fracking we actually take the natural gas deposits that takes another 800 and 1000 truck trips transporting 3-6 million gallons of water and frack sand over another 1-2 week period. At the end of the day, per pad, you’re looking 2-3 months of development of today 1250-1600 cumulative truck trips over roads that maybe had 100 or 200 vehicles a day on them previously.
Some roads went from 150 to an additional 700 trucks per day and that has been quite a challenge.
So with the look at is two thirds of our road system and Lycoming County is locally owned by different municipalities and not the state of Pennsylvania. The other third is owned by the state. Another concern we have is the accelerated deterioration to our lifecycle payments on roads that are not bonded. So who’s going to pay that bill? In Pennsylvania basically the transportation funding is derived from the gas tax at the state level. But we have no comprehensive database on the condition of local roads. We do on the state road system.
The railroad impacts have been significant as well. Right not about twenty percent of their rail traffic is gas related and it helps take trucks off the road, but it’s not a substitute but there still needs to be an interface point since the wells are in locations not served by rail, truck traffic still has to happen there. You see a lot of types of Marcellus gas commodities transported by rail such as frack sand and the pipe and other kind of equipment related to make the and they come from a large swath of the United States.
Our main transfer terminal point between rail and truck freight for Marcellus or for anything is the Newberry Rail Yard which is now operating at full capacity
Obviously the siting of the wells being in remote areas that are difficult to access and the trucks going to small communities that have an inadequate capacity to handle all of the sudden traffic at intersections-these have definitely raised public discontent.
Dr. Cesar Quiroga Fracking-based Energy Development and Transportation Impacts and Needs
when we looked at the numbers that we look at fifty to sixty percent of the selected segments which were expected to have less than five years of remaining life. So that’s quite significant. One of the things that we did then was to try to estimate the pavement life. We developed a couple of tools to be able to do this. For those of you familiar with the energy development industry you need to dispose of the saltwater using disposal facilities, typically injection wells.
Many of these injection wells are permitted by the number of the maximum barrels they can receive per day. If you look at any number, for example 20,000, you can translate that into the number of truckloads you receive per day or per year and if you are familiar with the design of the different types of facilities can be designed for different types of ESALs. If you assume a rural road and assuming that it is new, at this rate 20,000 barrels a day in the facility may not have more than four years of life assuming that it was new when the process started.
One other thing that we did as an example was the estimate of impact statewide. We produced a high level estimate for the state of about $1 billion per year on state roads. Taking into consideration that local and county roads account for a roughly the same amount of mileage, we came up with an estimate of about $2 billion a year which is quite significant.
There were some assumptions that we had to make regarding the buffer around which we had some impact within the facilities-we didn’t include U.S. highways– So if anything the impact would be higher than the number I just mentioned. Another important part to keep in mind is that you may have overweight loads.
Just to give you an idea how important the overweight factor is if you look at 80,000 pounds is the reference and if you look to increase the overload to 100,000 pounds, an increase in weight is only twenty percent, but the increase in the impact is 240% which is quite significant, and that is something we should not forget.
It has been documented for example here-I live in San Antonio very close to the Eagle Ford and when the increasing of truck traffic became evident, there were also increases in documented crashes and fatalities. You can document this using other commercial data, for example, commercial vehicle violations, but the impact that I mentioned regarding overweight. Well, it turns out that a significant number of violations pertained to exceeding the maximum tandem axle weight as in this case is that of 34,000 pounds and note that energy-related traffic is ranked higher than non-energy-related traffic.
Let me try to summarize some of these issues in terms of things that are happening right now. I think nationwide there is an increasing amount of awareness When you talk to stakeholders and the county officials, it kind of depends. Most of the focus is related to environmental and water issues. One of the needs that I see is to continue to increase awareness about the impact on transportation and infrastructure with the numbers I mentioned earlier.