
Preface. United States infrastructure was built when the EROI of oil was very high and minerals and metals were cheap due to high ore concentrations. This study was done in 2002, since then, things have gotten much worse (see ASCE 2013 Infrastructure report card). ASCE estimates the bill to fix corrosion is now $3.6 trillion.
Globalization was made possible by really large ships that can be up to 80 times more energy efficient than trucks, and carry up to 90% of internationally traded goods. Yet these behemoths last only 29 years on average before they’re scrapped, and double-hulls have made super-rust possible, accelerating corrosion.
Alice Friedemann www.energyskeptic.com author of “Life After Fossil Fuels: A Reality Check on Alternative Energy”, 2021, Springer; “When Trucks Stop Running: Energy and the Future of Transportation”, 2015, Springer; Barriers to Making Algal Biofuels, and “Crunch! Whole Grain Artisan Chips and Crackers”. Podcasts: Collapse Chronicles, Derrick Jensen, Practical Prepping, KunstlerCast 253, KunstlerCast278, Peak Prosperity , XX2 report
***
USDOT. March 2002. Corrosion cost and preventive strategies in the United States. U.S. Department of transportation, Federal highway administration. 784 pages.
NACE. Corrosion costs and preventive strategies in the United States.
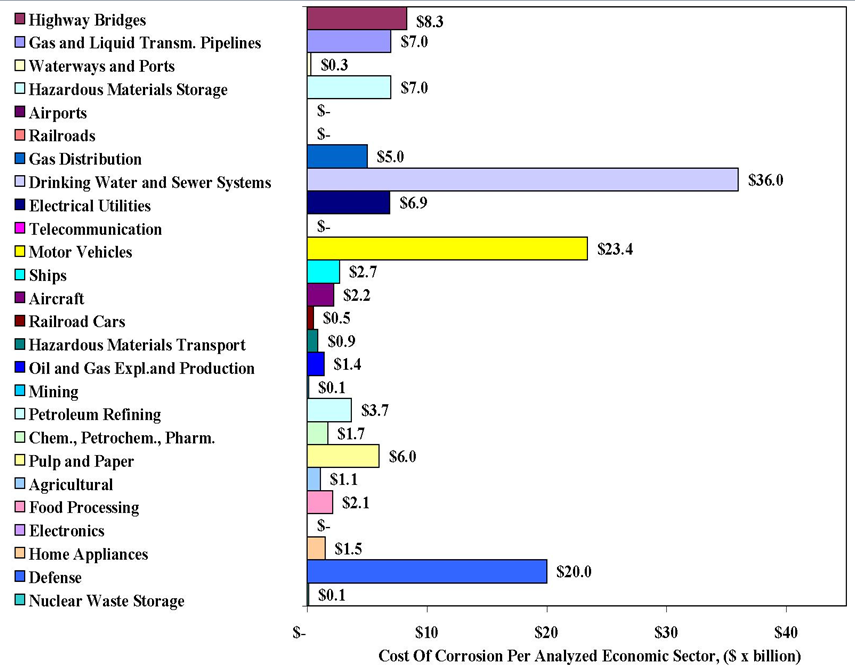
cost of corrosion per economic sector in $ billions
Summary of Total Cost
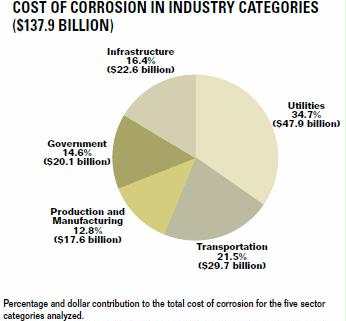
The cost of corrosion was estimated for the individual economic sectors. The total cost due to the impact of corrosion was $137.9 billion per year. Since not all economic sectors were examined, the sum of the estimated costs does not represent the total cost of corrosion to the entire U.S. economy. By estimating the percentage of U.S. GDP of the sectors for which corrosion costs were not determined and extrapolating the cost numbers to the entire U.S. economy, a total cost of corrosion of $276 billion was estimated. This is approximately 3.1 percent of the nation’s GDP. The indirect corrosion costs (i.e., the costs incurred by other than owners and operators as a result of corrosion) are conservatively estimated to be equal to the direct cost; giving a total direct plus indirect cost of $552 billion (6 percent of the GDP). Evidence of the large indirect corrosion costs are: (1) lost productivity because of outages, delays, failures, and litigation; (2) taxes and overhead on the cost of corrosion portion of goods and services; and (3) indirect costs of non-owner/operator activities.
Infrastructure
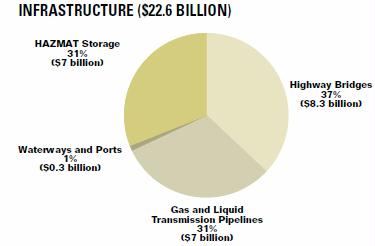
The U.S. infrastructure and transportation system allows for a high level of mobility and freight activity for the nearly 270 million residents and 7 million business establishments. In 1997, more than 230 million motor vehicles, ships, airplanes, and railroad cars were used on 6.4 million km (4 million mi) of highways, railroads, and waterways connecting all parts of the United States. The transportation infrastructure also includes more than 800,000 km (approximately 500,000 mi) of oil and gas transmission pipelines, 8.5 million tanks for hazardous materials storage, and 18,000 public and private airports. The annual direct cost of corrosion in the infrastructure category is estimated at $22.6 billion.
Highway Bridges: Based on the National Bridge Inventory Database, there are 586,000 bridges in the United States, half built between 1950 and 1994. Of this total, 435,000 bridges are made from steel and conventional reinforced concrete, 108,000 bridges are constructed using pre-stressed concrete, and the balance is made using other materials of construction. Approximately 15 percent of the bridges are structurally deficient, primarily due to corrosion of steel and steel reinforcement. The dollar impact of corrosion on highway bridges is considerable. The annual direct cost of corrosion for highway bridges is estimated to be $8.3 billion, consisting of $3.8 billion for the annual cost to replace structurally deficient bridges over the next 10 years, $2.0 billion for maintenance and cost of capital for concrete bridge decks, $2.0 billion for maintenance and cost of capital for concrete substructures (minus decks), and $0.5 billion for maintenance painting of steel bridges. Life-cycle analysis estimates indirect costs to the user due to traffic delays and lost productivity at more than 10 times the direct cost of corrosion.
Conventional Reinforced-Concrete Bridges. The primary cause of reinforced-concrete bridge deterioration is chloride-induced corrosion of the black steel reinforcement, resulting in expansion forces in the concrete that produce cracking and spalling of the concrete. The chloride comes from either marine exposure or the use of deicing salts for snow and ice removal. Because the use of deicing salts is likely to continue, if not increase, little can be done to prevent bridge structures from being exposed to corrosive chloride salts.
The expected service life of a newly constructed bridge is typically 75 years and up to 120 years for stainless steel rebar construction.
Steel Bridges. The primary cause of corrosion of steel bridges is the exposure of the steel to atmospheric conditions. This corrosion is greatly enhanced due to marine (salt spray) exposures and industrial environments. The only corrosion prevention method for these structures is to provide a barrier coating (paint).
Gas and Liquid Transmission Pipelines: There are more than (328,000 mi) of natural gas transmission and gathering pipelines, (74,000 mi) of crude oil transmission and gathering pipelines, and (82,000 mi) of hazardous liquid transmission pipelines. For all natural gas pipeline companies, the total investment in 1998 was $63.1 billion, from which a total revenue of $13.6 billion was generated. For liquid pipeline companies, the investment was $30.2 billion, from which a revenue of $6.9 billion was generated. At an estimated replacement cost of ($1,117,000 per mi), the asset replacement value of the transmission pipeline system in the United States is $541 billion; therefore a significant investment is at risk with corrosion being the primary factor in controlling the life of the asset. The average annual corrosion-related cost is estimated at $7.0 billion, which can be divided into the cost of capital (38 percent), operation and maintenance (52, percent), and failures (10 percent). With a range of corrosion O&M cost of $3,100 to $6,200 per krn ($5,000 to $10,000 per mi), the total corrosion O&M cost ranges from $2.42 billion to $4.84 billion.
If corrosion is allowed to progress unchecked, the integrity of the pipeline will eventually be compromised. Depending on the flaw size, the pipeline material properties, and the pressure, either a leak will form or a rupture will occur. Typically, a rupture of a high-pressure natural gas pipeline results in a sufficient release of stored energy to blow the pipeline out of the ground. An annual direct cost of corrosion-related accidents for both gas and liquid pipelines is estimated to range from $471 million to $875 million.
A liquid (non-compressible) pipeline has less stored energy than a natural gas pipeline; therefore. a rupture does not immediately result in a major explosion. However, once leaked out into the environment, a major explosion can occur upon ignition of an explosive liquid product. For a hazardous liquid product pipeline, the environmental impact can be as significant as the risk of an explosion. The risk of an oil leak from the TransAlaskan pipeline, for example, has continued to be the primary driver for the aggressive corrosion prevention and inspection program maintained by the operator. Of major concern is the risk of product leakage into surface waters, thereby, contaminating water supplies.
Corrosion of the pipe wall can occur either internally or externally. Internal corrosion occurs when corrosive liquids or condensates are transported through the pipelines. Depending on the nature of the corrosive liquid and the transport velocity, different forms of corrosion may occur, including uniform corrosion, pitting/crevice corrosion, and erosion-corrosion. Figure 3 shows an example of internal corrosion that occurred in a crude oil pipeline due to high levels of saltwater and carbon dioxide (CO2).
There are several different modes of external corrosion identified on buried pipelines. The primary mode of corrosion is a macro-cell form of localized corrosion due to the heterogeneous nature of soils, local damage of the external coatings (holidays), and/or the disbandment of external coatings. Figure 4 shows typical external corrosion on a buried pipeline. The 25-mm-(1 -in-) grid pattern was placed on the pipe surface to permit sizing of the corrosion and nondestructive evaluation (NDE) wall thickness measurements.
Stray Current Corrosion. Corrosion can be accelerated through ground currents from dc sources. Electrified railroads, mining operations, and other similar industries that utilize large amounts of dc current sometimes allow a significant portion of current to use a ground path return to their power sources. These currents often utilize metallic structures (pipelines) in close proximity as a part of the return path. This “stray” current can be picked up by the pipeline and discharged back into the soil at some distance down the pipeline close to the current return. Current pick-up on the pipe is the same process as cathodic protection, which tends to mitigate corrosion. The process of current discharge off the pipe and through the soil of a dc current accelerates corrosion of the pipe wall at the discharge point. This type of corrosion is called stray current corrosion.
Microbiologically Influenced Corrosion (MIC). Microbiologically influenced corrosion (MIC) is defined as corrosion that is influenced by the presence and activities of microorganisms, including bacteria and fungi. It has been estimated that 20 to 30 percent of all corrosion on pipelines is MIC-related. MIC can affect either the external or the internal surfaces of a pipeline. Microorganisms located at the metal surface do not directly attack the metal or cause a unique form of corrosion. The byproducts from the organisms promote several forms of corrosion, including pitting, crevice corrosion, and under-deposit corrosion. Typically, the products of a growing microbiological colony accelerate the corrosion process by either: (1) interacting with the corrosion products to prevent natural film-forming characteristics of the corrosion products that would inhibit firther corrosion, or (2) providing an additional reduction reaction that accelerates the corrosion process. A variety of bacteria have been implicated in exacerbating corrosion of underground pipelines and these fall into the broad classifications of aerobic and anaerobic bacteria. Obligate aerobic bacteria can only survive in the presence of oxygen, while obligate anaerobic bacteria can only survive in its absence. A third classification is facultative aerobic bacteria that prefer aerobic conditions, but can live under anaerobic conditions. Common obligate anaerobic bacteria implicated in corrosion include sulfate reducing bacteria (SRB) and metal-reducing bacteria. Common obligate aerobic bacteria include metal-oxidizing bacteria, while acid-producing bacteria are facultative aerobes. The most aggressive attacks generally take place in the presence of microbial communities that contain a variety of types of bacteria. In these communities, the bacteria act cooperatively to produce conditions favorable to the growth of each species. For example, obligate anaerobic bacteria can thrive in aerobic environments when they are present beneath biofilms/deposits in which aerobic bacteria consume the oxygen. In the case of underground pipelines, the most aggressive attack has been associated with acid-producing bacteria in such bacterial communities
Stress Corrosion Cracking. A particularly detrimental form of pipeline corrosion is known as stress corrosion cracking (SCC). SCC is defined as the brittle fracture of a normally ductile metal by the conjoint action of a specific corrosive environment and a tensile stress. On underground pipelines, SCC affects only the external surface of the pipe, which is exposed to soil and groundwater at locations where the coating is disbonded. The primary component of the tensile stress on an underground pipeline is in the hoop direction and results from the operating pressure. Residual stresses from fabrication, installation, and damage in service contribute to the total stress. Individual cracks initiate in the longitudinal direction on the outside surface of the pipe. The cracks typically occur in colonies that may contain hundreds or thousands of individual cracks. Over time, the cracks in the colonies interlink and may cause leaks or ruptures once a critical-size flaw is achieved. Figure 7 shows an SCC hydrostatic test failure on a high-pressure gas pipeline (see later section on hydrostatic testing). The two basic types of SCC on underground pipelines that have been identified are classical or “high pH” cracking (pH 9 to lo), which propagates intergranularly, and “near-neutral pH” cracking, which propagates transgranularly. Each form of SCC initiates and propagates under unique environmental conditions. Near-neutral pH SCC (< pH 8) is most commonly found on pipelines with polyethylene tape coatings that shield the cathodic protection current.(5) The environment that develops beneath the tape coating and causes this form of cracking is dilute carbonic acid. Carbon dioxide from the decay of organic material in the soil dissolves in the electrolyte beneath the disbonded coating to form the carbonic acid solution. High-pH SCC is most commonly found on pipelines with asphalt or coal tar coatings. The high-pH environment is a concentrated carbonate bicarbonate solution that develops as a result of the presence of carbon dioxide in the groundwater and the cathodic protection system.
Fresh Water. Airborne or splash zone attack is normally not a problem at freshwater facilities; however, air pollution can cause potential problems. Under certain flow conditions, such as turbulent flow or cavitation, fresh water can cause severe corrosion to submerged metallic elements. Ice damage also can limit the effectiveness of coatings on bulkhead walls and support piling. Piers and docks, bulkheads and retaining walls, locks. dams, and navigational aids exposed to freshwater environment experience corrosion-related problems. The most common areas of attack include submerged and splash zones on support piles (piers. docks, and navigational aids) and steel sheet piling (bulkheads and retaining walls). These zones are also found on locks (steel gates, hinges. intake’discharge culverts, valves, and sheet pile walls), dams (steel gates, hinges. intakeidischarge culverts. grates, and debris booms). and navigational aids (anchorages).
Hazardous Materials Storage: There are approximately 8.5 million regulated and non-regulated aboveground storage tanks (ASTs) and underground storage tanks (USTs) for hazardous materials (HAZMAT) in the United States. While these tanks represent a large investment, and good maintenance practices would be in the best interest of the owners, federal and state environmental regulators are concerned with the environmental impact of spills from leaking tanks. In 1988, the US. Environmental Protection Agency set a December 1998 deadline for UST owners to comply with the requirement to have corrosion control on all tanks, as well as overfill and spill protection. Thus, tank owners face considerable costs related to clean-up and penalties imposed by the government if they would not be in compliance. It is estimated that the annual cost of corrosion for ASTs is $4.5 billion and for USTs is $2.5 billion per year, resulting in a total annual direct corrosion cost of $7.0 billion.
The largest costs are incurred when leaking USTs must be replaced with new tanks. The soil remediation costs and oil spill clean-up costs are significant as well. In the last 10 years, the most common problem associated with USTs occurred at gasoline service stations that did not have corrosion protection on their USTs.
Utilities
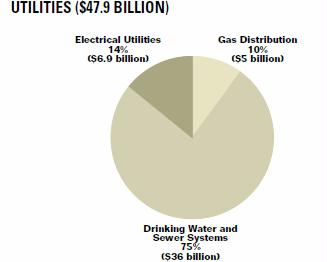
Utilities form an essential part of the US, economy by supplying gas, water, electricity, and communication. All utility companies combined spent $42.3 billion on capital goods in 1998, an increase of 9 3 percent from 1997. Of this total, $22.4 billion was used for structures and $19.9 billion was used for equipment. The total annual direct cost of corrosion in the utility category is estimated to be $47.9 billion.
Gas Distribution: The natural gas distribution system includes 1,730,000 miles of relatively small-diameter, low-pressure piping, which is divided into 1,080,000 miles of distribution main and 650,000 miles of services. There are approximately 55 million services in the distribution system. A large percentage of the mains (57 percent) and services (46 percent) are made of steel, cast iron, or copper, which are subject to corrosion. The total annual direct cost of corrosion was estimated at approximately $5.0 billion.
The typical distribution of piping diameters is between 40 mm and 150 mm (1.5 in and 6 in) for main distribution piping and 13 mm to 20 mm (0.5 in to 0.75 in) for service piping. A small percentage of mains and services is larger diameter pipe, typically for commercial and industrial application. Several different materials have been used for distribution piping. Historically, distribution mains were primarily made of carbon steel pipe; however, since the 1970s, a large portion of the gas distribution main lines have been made of plastic, mostly polyethylene (PE), but sometimes polyvinyl chloride (PVC). A large percentage of mains (57 percent) and services (46 percent) are made of metal (steel, cast iron, or copper). The methods for monitoring corrosion on the lines are the same as those used for transmission pipelines; however, leak detection is the most widely used technique.
Drinking Water and Sewer Svstems: According to the American Waterworks Association (AWWA) industry database, there is approximately 876,000 mi of municipal water piping in the United States. This number is not exact, since most water utilities do not have complete records of their piping system. The sewer system consists of approximately 16,400 publicly owned treatment facilities releasing some 155 million m3 41 billion gallons) of wastewater per day (1995). The total annual direct cost of corrosion for the nation’s drinking water and sewer systems was estimated at $36.0 billion. This cost was contributed to by the cost of replacing aging infrastructure. the cost of unaccounted-for water through leaks, the cost of corrosion inhibitors, the cost of internal mortar linings, and the cost of external coatings and cathodic protection.
Americans consume and use approximately 550 L of drinking water per person per day, for a total annual quantity of approximately 56.7 billion m’. The treated drinking water is transported through 1.4 million km of municipal water piping. The water piping is subject to internal and external corrosion. resulting in pipe leaks and water-main breaks. The total cost of corrosion for the drinking water and sewer systems includes the cost of replacing aging infrastructure. the cost of unaccounted-for water, the cost of corrosion inhibitors, the cost of internal cement mortar linings, the cost of external coatings, and the cost of cathodic protection.
In March 2000, the Water Infrastructure Network WIN) estimated the current annual cost for new investments, maintenance, operation, and financing of the national drinking water system at $38.5 billion per year, and of the sewer system at $27.5 billion per year. The total cost of corrosion was estimated from these numbers by assuming that at least 50 percent of the maintenance and operation costs are for replacing aging (corrosion) infrastructure, while the other 50 percent would be for system expansions. This results in an estimated cost of corrosion for drinking water systems of $19.25 billion per year and for sewer systems of $13.75 billion per year. WIN stated that the current spending levels are insuficient to prevent large failure rates in the next 20 years. The WIN report was presented in response to a 1998 study(”) by AWWA and a 1997 study by the EPA. Those studies had already identified the need for major investments to maintain the aging water infrastructure. In addition to the costs for replacing aging infrastructure, there is the cost for unaccounted-for water. One city reported a constant percentage of unaccounted-for water of 20 percent in the last 25 years, with 89 percent of its main breaks directly related to corrosion. Nationally, it is estimated that approximately 15 percent of the treated water is lost. The treatment of water that never reaches the consumer results in inflated prices (national lost water is estimated at $3.0 billion per year) and extra capacity in treatment facilities to produce the lost water. Adding these three major cost items results in a total annual cost of corrosion of $36.0 billion per year for drinking water and sewer systems combined.
Electrical Utilities: The electrical utility industry is a major provider of energy in the United States. The total amount of electricity sold in the United States in 1998 was 3,240 billion GWh at a cost to the consumers of $218 billion. Electricity generation plants can be divided into seven generic types: fossil fuel, nuclear, hydroelectric, cogeneration, geothermal, solar, and wind. The majority of electric power in the United States is generated by fossil and nuclear supply systems. The total annual direct cost of corrosion in the electrical utility industry in 1998 is estimated at $6.9 billion, with the largest amounts for nuclear power at $4.2 billion and fossil fuel at $1.9 billion, and smaller amounts for hydraulic and other power at $0.15 billion, and transmission and distribution at $0.6 billion.
The fossil fuel sector (including gas turbines and combined cycle plants) is the largest, with a generating capacity of approximately 488 GW, and a total generation of 2.2 million GWh in 1998. In 1998, approximately 102 nuclear stations were operational, with a generating capacity of 97.1 GW, and a total generation of 0.67 million GWh.
The total direct cost of corrosion in the electric utility industry in 1998 is estimated at $6.889 billion per year. In comparison, an Electric Power Research Institute (EPRI) study(“‘ estimated the cost of corrosion to the user/consumer to be $17.27 billion per year.
Because of the complex and often corrosive environments in which power plants operate, corrosion has been a serious problem, with a significant impact on the operation of the plants. In the 1970s and the 1980s, major efforts were spent on understanding and controlling corrosion in both nuclear and fossil fuel steam plants, and significant progress was made. However, with the aging of several plants, old problems persist and new ones appear. For example, corrosion continues to be a problem with electrical generators and with turbines. Specifically, stress corrosion cracking in steam generators in PWR plants and boiler tube failures in fossil fuel plants continue to be problems. There are further indications that aging of buried structures, such as service water piping, has started to result in leaks that cannot be tolerated
Telecommunications: The telecommunications infrastructure includes hardware such as electronics, computers, and data transmitters, as well as equipment shelters and the towers used to mount antennas, transmitters, receivers, and television and telephone systems. According to the U.S. Census Bureau, the total value of shipments for communications equipment in 1999 was $84 billion. An important factor for corrosion cost is the additional cost of protecting towers and shelters, such as painting and galvanizing. In addition, corrosion of buried copper grounding beds, as well as galvanic corrosion of the grounded steel structures, contributes to the corrosion cost. For this sector, no corrosion cost was determined because of the lack of information on this rapidly changing industry. Many components are being replaced before physically failing because the technology has become obsolete in a short period of time.
Transportation
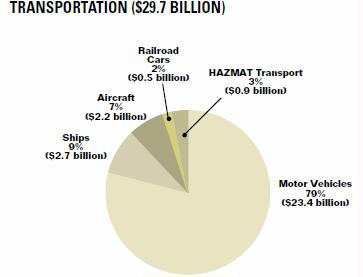
The transportation category includes vehicles and equipment, such as motor vehicles, aircraft. railroad cars, and hazardous materials transport, that make use of the U.S. highways, waterways, railroads, and airports. The annual cost of corrosion in the transportation category is estimated at $29.7 billion.
Motor Vehicles: U.S. consumers, businesses, and government organizations own more than 200 million registered motor vehicles. Assuming an average value of $5,000, the total investment Americans have made in motor vehicles can be estimated at more than $1 trillion. Since the 1980s, car manufacturers have increased the corrosion resistance of vehicles by using corrosion-resistant materials, employing better manufacturing processes, and by designing corrosion-resistant vehicles. Although significant progress has been made, further improvement can be achieved in the corrosion resistance of individual components, such as fuel and brake systems, and electrical and electronic components. The total annual direct cost of corrosion is estimated at $23.4 billion, which is divided into the following three components: (1) increased manufacturing costs due to corrosion engineering and the use of corrosion-resistant materials ($2.56 billion per year), (2) repairs and maintenance necessitated by corrosion ($6.45 billion per year), and (3) corrosion-related depreciation of vehicles ($14.46 billion per year).
The total cost of corrosion to owners of motor vehicles is estimated at $23.4 billion per year or 79 percent of the Transportation category (see figure 13). This cost is divided into the following three components: (1) increased manufacturing costs due to corrosion engineering and the use of corrosion-resistant materials ($2.56 billion per year), (2) repairs and maintenance necessitated by corrosion ($6.45 billion per year), and (3) corrosion-related depreciation of vehicles ($14.46 billion per year).
Ships: The U.S. flag fleet can be divided into several categories as follows: the Great Lakes with 737 vessels at (62 billion ton-mi), inland with 33,668 vessels at (294 billion ton-mi), ocean with 7,014 vessels at (350 billion ton-mi), recreational with 12.3 million boats, and cruise ship with 122 boats serving North American ports (5.4 million passengers). The total annual direct cost of corrosion to the U.S. shipping industry is estimated at $2.7 billion. This cost is divided into costs associated with new construction ($1.1 billion), with maintenance and repairs ($0.8 billion), and with corrosion-related downtime ($0.8 billion).
Railroads: In 1997, there were nine Class I freight railroads (railroads with operating revenues of more than $256.4 million). These railroads accounted for 71 percent of the industry’s (170,508 mi) of railroad. There were 35 regional railroads (those with operating revenues between $40 million and $256.4 million and/or operating at least 560 km (350 mi) of railroad). The regional railroads operated 34,546 km (21,466 mi) of railroad. Finally, there were 5 13 local railroads operating more than 45,300 km (28,149 mi) of railroad. The elements that are subject to corrosion include metal members, such as rail and steel spikes; however, corrosion damage to railroad components are either limited or go unreported. Hence, a corrosion cost could not be determined.
One area where corrosion has been identified is in electrified rail systems, such as those used for local transit authorities. Stray currents from the electrified systems can inflict significant and costly corrosion on non-railroad-related underground structures such as gas pipelines, waterlines, and underground storage tanks.
Railroad Cars: In 1998, 1.47 million freight cars and 1,962 passenger cars were reported to operate in the United States. Covered hoppers at 28 percent make up the largest portion of the freight-car fleet, with tanker cars making up the second largest portion at 18 percent. The type of commodities transported range from coal (largest volume) to chemicals, motor vehicles, farm products, food products, and metallic and non-metallic ores and minerals. Railroad cars suffer from both external and internal corrosion. It is estimated that the total annual direct cost of corrosion is approximately $0.5 billion, divided over external coatings ($0.25 billion) and internal coatings and linings ($0.25 billion).
It is estimated that the total annual corrosion-related maintenance cost for railroad cars is approximately $504 million ($958 million for external coatings and $246 niillion for internal coatings and liners
The rate of corrosion has to be controlled in order to: ( 1) prolong the service life of the car. (2) prevent contamination of the transported product, such as food products or high-purity chemicals, and (3) prevent hazardous spills that could contaminate the environment and pose a public safety hazard. Protection from internal corrosion is achieved by using organic coating systems or rubber linings. As an alternative. cars for certain corrosive cargo services are manufactured from corrosion-resistant materials, such as aluminum or stainless steel. which raises the price of a car twofold.
Waterways and Ports: In the United States, (25,000 mi) of commercial navigable waterways serve 41 states, including all states east of the Mississippi River. Hundreds of locks facilitate travel along these waterways. In January 1999, 135 of the 276 locks had exceeded their 50-year design life. The oldest operating locks in the United States are Kentucky River Locks 1 and 2. U.S. ports play an important role in connecting waterways, railroads, and highways. The nation’s ports include 1,914 deep-water (seacoast and Great Lakes) and 1,812 along inland waterways. Corrosion is typically found in piers and docks. bulkheads and retraining walls, mooring structures, and navigational aids. There is no formal tracking of corrosion-related costs. The U.S. Army Corps of Engineers estimated annual corrosion-related costs for locks and dams to be approximately $70 million at 5 percent of the O&M budget of $1.4 billion.(39′ Because of the aging of the structures however, high replacement costs are anticipated due, in part, to corrosion. The annual corrosion cost of ports and waterways owned and/or operated by public port authorities is estimated at $182 million.’401 The U.S. Coast Guard maintains navigational aids such as light structures, buoys, and other saltwater and freshwater exposed structures. In 1999, the corrosion-related cost for maintaining these structures was estimated at $4 1 million. The total annual cost of corrosion for waterways and ports is $293 million ($70 million + $1 82 million + $4 1 million). This must be a low estimate since the costs of harbor and other marine structures are not included.
The reinforced-concrete structures exposed to the marine environment suffer premature corrosion-induced deterioration by chlorine ions in seawater. Corrosion is typically found in piers and docks, bulkheads and retaining walls, mooring structures, and navigational aids. The marine environment can have varying effects on different materials depending on the specific zones of exposure. Atmosphere, splash, tide, immersion, and subsoil have very different characteristics and, therefore, have different influences on corrosion. Atmospherically exposed submerged zones and splash zones typically experience the most corrosion. These zones are found on piers and docks (ladders, railings, cranes, and steel support piles), bulkheads and retaining walls (steel sheet piling, steel-reinforced concrete elements, backside, and anchors on structures retaining dredged fill), and mooring structures and dams (steel gates, hinges, intakeidischarge culverts, grates, and debris booms). Stationary navigational aids suffer from corrosion of support piles and steel-reinforced concrete pile caps. Floating steel buoys are subject to corrosion as well.
Aircraft: In 1998, the combined aircraft fleet operated by U.S. airlines was more than 7,000, of which approximately 4,000 were turbojets. The fleet includes the Boeing 707, DC-9, Boeing 727, DC-10, and the earlier versions of the Boeing 737 and 747. At the start of the jet age (1950s to 1960s), little or no attention was paid to corrosion and corrosion control. One of the concerns is the continued aging of the airplanes beyond the 20-year design life. Only the most recent designs (Boeing 777 and late version 737) have incorporated significant improvements in corrosion prevention and control in design and manufacturing. The total annual direct cost of corrosion to the U.S. aircraft industry is estimated at $2.2 billion, which includes the cost of design and manufacturing ($0.2 billion), corrosion maintenance ($1.7 billion), and downtime ($0.3 billion).
The annual (1996) corrosion cost to the U.S. aircraft industry is estimated at $2.225 billion, which includes the cost of design and manufacturing at $0.225 billion, corrosion maintenance at $1.7 billion, and downtime due to corrosion at $0.3 billion (see figure 15). With the availability of new corrosion-resistant materials and an increased awareness of the importance of corrosion to the integrity and operation ofjet aircraft, the current design service life of 20 years has been extended to 40 years without jeopardizing structural integrity and significantly increasing the cost of operation.’
Airports: The United States has the world’s most extensive airport system, which is essential to national transportation and the U.S. economy. According to 1999 Bureau of Transportation Statistics figures, there were 5.324 public-use airports and 13,774 private-use airports in the United States. A typical airport infrastructure is complex. and components that might be subject to corrosion include the natural gas distribution system, jet fuel storage and distribution system, deicing storage and distribution system, vehicle fueling systems, natural gas feeders, dry fire lines, parking garages, and runway lighting. Generally, each of these systems is owned or operated by different organizations or companies; therefore, the impact of corrosion on an airport as a whole is not known or documented. However, the airports do not have any specific corrosion-related problems, that have not been described elsewhere in this report.
Hazardous Materials Transport: According to U.S .Department of transportation, there are approximately 300 million hazardous materials shipments of more than 3.1 billion metric tons annually in the United States. Bulk transportation of hazardous materials includes overland shipping by tanker truck and rail car, and by special containers that are loaded onto vehicles. Over water, ships loaded with specialized containers, tanks, and drums are used. In small quantities, hazardous materials require specially designed packaging for truck and air shipment. The total annual direct cost of corrosion for hazardous materials transport is more than $0.9 billion. The elements of the annual corrosion cost include the cost of transporting vehicles ($0.4 billion per year), the cost of specialized packaging (S0.5 billion per year), and the direct and indirect costs ($0.5 million per year and an unknown value, respectively) of accidental releases and corrosion-related transportation incidents.
The total cost of corrosion for HAZMAT transportation is at least $0.887 billion per year (see figure 17). The elements of this cost include the corrosion-related cost of transport vehicles ($400 million per year), the cost of specialized packaging ($487 million per year), and the direct cost of $0.5 million per year of accidental releases and other corrosion-related transportation incidents. The indirect costs of releases are not known.
Production and Manufacturing
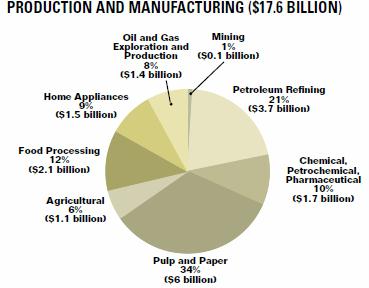
This category includes industries that produce and manufacture products of crucial importance to the U.S. economy and the standard of living in the United States. These include oil production, mining, petroleum refining, chemical and pharmaceutical production, and agricultural and food production. The total annual direct cost of corrosion in this category was estimated to be $17.6 billion.
Oil and Gas Exploration and Production: Domestic oil and gas production can be considered to be a stagnant industry, because most of the significant available onshore oil and gas reserves have been exploited. Oil production in the United States in 1998 consisted of 3.04 billion barrels. The significant recoverable reserves left to be discovered and produced are probably limited to less convenient locations such as in deep water offshore, remote arctic locations, and difficult-to-manage reservoirs with unconsolidated sands. The total annual direct cost of corrosion in the U.S, oil and gas production industry is estimated at $1.4 billion, made up of $0.6 billion for surface piping and facility costs, $0.5 billion in downhole tubing expenses, and $0.3 billion in capital expenditures related to corrosion.
The majority of cost-savings for any oil production facility is in the prevention of failure in one of the production arteries, such as downhole tubing, surface pipelines, and production vessel. Downhole tubing, surface pipelines, pressure vessels, and storage tanks in oil and gas production are subject to internal corrosion by water, which is enhanced by the presence of CO2 and H2S in the gas phase. Internal corrosion control is a major cost item consideration. The total cost of corrosion in the U.S. oil and gas production industry is estimated to be $1.372 billion annually, made up of $589 million for surface piping and facility costs. $463 million in downhole tubing expenses, and $320 million in capital expenditures related to corrosion.
Mining: In the mining industry, corrosion is not considered to be a significant problem. There is a general consensus that the life-limiting factors for mining equipment are wear and mechanical damage rather than corrosion. Maintenance painting, however, is heavily relied upon to prevent corrosion, with an annual estimated expenditure for the coal mining industry of $0.1 billion.
Petroleum Refining: Petroleum is the single largest source of energy for the United States. The nation uses twice as much petroleum as either coal or natural gas. The U.S. refineries represent approximately 23% of the world’s petroleum production, and the United States has the largest refining capacity in the world, with 163 refineries. In 1996, U.S. refineries supplied more than 18 million barrels per day of refined petroleum products. The total annual direct cost of corrosion is estimated at $3.7 billion. Of this total, maintenance-related expenses are estimated at $1.8 billion, vessel turnaround expenses at $1.4 billion, and fouling costs are approximately $0.5 billion annually.
The total annual cost of corrosion for the petroleum refining industry is estimated at $3.692 billion, which is 2 1 percent of the Production and Manufacturing category (see figure 2 1). Of this total, maintenance-related expenses are estimated at $1.767 billion, vessel turnaround expenses at $1.425 billion, and fouling costs are approximately $0.500 billion annually. The costs associated with corrosion control in refineries include both the processing side and water handling. Corrosion-related issues regarding the processing side include the handling of organic acids, referred to as naphthenic corrosion, and sulfur species, particularly at high temperatures, as well as water carryover in processing vessels and pipelines. Water handling includes concerns with corrosives such as H2S, C02, chlorides, and high levels of dissolved solids.
Increasing regulation and pressure from environmental groups have forced the ref neries to implement defensive strategies where little attention is paid to improved corrosion control. This is compounded by overseas market forces, such as OPEC, which control the price of the feedstock oil. In a commodity-driven industry that is struggling to compete in the world market, investment in more effective corrosion control strategies often takes a backseat to across-the-board cost-cutting measures. The majority of pipelines and vessels in refineries are constructed of carbon steel, and opportunities for significant savings exist through the use of low-alloy steels and alloy-clad vessels, particularly as increasingly higher fractions of acidic crude oil are refined.
Chemical, Petrochemical, and Pharmaceutical: The chemical, petrochemical, and pharmaceutical industries play a major role in the U.S. economy by providing a wide range of products. The chemical industry includes those manufacturing facilities that produce bulk or specialty compounds by chemical reactions between organic and/or inorganic materials. The petrochemical industry includes those manufacturing facilities that create substances from raw hydrocarbon materials such as crude oil and natural gas. The pharmaceutical industry formulates, fabricates, and processes medicinal products from raw materials. The total annual direct cost of corrosion for this industry sector is estimated at $1.7 billion per year (8 percent of total capital expenditures). No calculation was made for the indirect costs of production outages or indirect costs related to catastrophic failures. The costs of operation and maintenance related to corrosion were not readily available; estimating these costs would require detailed study of data records of individual companies.
Pulp and Paper: The $165 billion pulp, paper, and allied product industry supplies the United States with approximately 300 kg of paper per person per year. More than 300 pulp mills and more than 550 paper mills support its production. The total annual direct cost of corrosion is estimated at $6.0 billion, with the majority of this cost in the paper and paperboard-making industry, and calculated as a fraction of the maintenance costs. No information was found to estimate the corrosion costs related to the loss of capital.
Agricultural: Agriculture operations are producing livestock, poultry, or other animal specialties and their products, and producing crops, including fruits and greenhouse or nursery products. According to the National Agricultural Statistics Service, there are approximately 1.9 million farms in the United States. Based on a 1997 census, the total value of farm machinery and equipment is approximately $15 billion per year. The two main reasons for replacing machinery or equipment include upgrading old equipment and substituting because of wear and corrosion. Discussions with people in this industrial sector resulted in an estimate of corrosion costs in the range of 5 percent to 10 percent of the value of all new equipment. The total annual direct cost of corrosion in the agricultural production industry is estimated at $1.1 billion.
Food Processing: The food processing industry is one of the largest manufacturing industries in the United States, accounting for approximately 14 percent of the total US, manufacturing output. Sales for food-processing companies totaled $265.5 billion in 1999. Because of quality-of-food requirements, stainless steel is widely used. Assuming that the stainless steel consumption and cost in this industry is entirely attributed to corrosion, a total annual direct cost of corrosion is estimated at 52.1 billion. This cost includes stainless steel usage for beverage production, food machinery, cutlery and utensils, commercial and restaurant equipment, appliances, aluminum cans, and the use of corrosion inhibitors.
Electronics: Corrosion in electronic components manifests itself in several ways. Computers, integrated circuits, and microchips are now an integral part of all technology-intensive industry products, ranging from aerospace and automotive to medical equipment and consumer products, and are therefore exposed to a variety of environmental conditions. Corrosion in electronic components are insidious and cannot be readily detected; therefore, when corrosion failure occurs, it is often dismissed as just a failure and the part or component is replaced. Particularly in the case of consumer electronics, devices would become technologically obsolete long before corrosion-induced failures would occur. However, capital-intensive industries, with significant investment in durable equipment with a considerable number of electronic components, such as the defense industry and the airline industry, tend to keep the equipment for longer periods of time, and corrosion is likely to become an issue. Although the cost of corrosion in the electronics sector could not be estimated, it has been suggested that a significant part of all electronic component failures are caused by corrosion.
Home Appliances The appliance industry is one of the largest consumer product industries. For practical purposes, two categories of appliances are distinguished: “Major Home Appliances” and “Comfort Conditioning Appliances.” In 1999, a total of 70.7 million major home appliances and a total of 49.5 million comfort conditioning appliances were sold in the United States, for a total of 120.2 million appliances. The cost of corrosion in home appliances includes the cost of purchasing replacement appliances because of premature failure due to corrosion. For water heaters alone, the replacement cost was estimated at $460 million per year, using a low estimate of 5 percent of the replacement being corrosion-related. The cost of internal corrosion protection for all appliances includes the use of sacrificial anodes ($780 million per year), corrosion-resistant materials (no cost estimate), and internal coatings (no cost estimate). The cost of external corrosion protection using coatings was estimated at $260 million per year. Therefore, the estimated total annual direct cost of corrosion in home appliances is at least $1.5 billion.
Government. Federal, state, and local governments play important roles in the U.S. economy with a 1998 GDP of approximately $1.1 trillion ($360 billion federal. $745 billion state and local). While the government owns and operates large assets under various departments, the US. Department of Defense (DOD) was selected for analysis because of its significant impact on the U.S. economy. A second government sectors elected is nuclear waste storage under the U.S. Department of Energy (DOE).
Defense: The ability of the DOD to respond rapidly to national security and foreign commitments can be adversely affected by corrosion. Corrosion of military equipment and facilities has been. for many years, a significant and ongoing problem. The corrosion-related problems are becoming more prominent as the acquisition of new equipment is decreasing and a large degree of reliability of aging systems is expected. The data provided by the military services (Army, Air Force, Navy, and Marine Corps) indicate that corrosion is potentially the number one cost driver in life-cycle costs. The total annual direct cost of corrosion incurred by the military services for both systems and infrastructure was estimated at $20 billion.
A considerable portion of the cost of corrosion to the Army is attributed to ground vehicles, including tank systems, fighting vehicle systems, fire support systems, high-mobility multipurpose wheeled vehicles (HMMWV), and light armored vehicles. Other systems that are affected by corrosion include fring platforms and helicopters. Many of the Army systems are well beyond their design service lives and because of generally aggressive operating environments, corrosion is becoming increasingly severe and costly. While often replacement of the aging systems is not budgeted, insufficient use is being made of existing technology to maintain these systems in a cost-effective manner. Even with the procurement of new equipment such as the HMMWV, the use of corrosion-resistant materials and design are often neglected in favor of quantity of procurement and system properties. In recent years, the Air Force has experienced considerable corrosion problems. As with the commercial aircraft industry, corrosion on airframes in the past has not been considered to have a significant impact on structural integrity; therefore, a “find and fix” approach has long been the preferred way to deal with corrosion in aircraft. With no significant hiding available for new system acquisition, the Air Force is forced to extend the operational life of many of the aircraft, such as the KC-135 tanker, far beyond their design service life
Nuclear Waste Storage: Nuclear wastes are generated from spent nuclear fuel, dismantled nuclear weapons, and products such as radio pharmaceuticals. The most important design item for the safe storage of nuclear waste is effective shielding of radiation. Corrosion is not considered a major issue in the transportation of nuclear wastes due to the stringent packaging requirements and the relatively short duration of the transport. However, corrosion is an important issue in the design of the casks used for permanent storage with a design life of several thousand years. A 1998 total life-cycle cost analysis by DOE for the permanent disposal of nuclear waste in Yucca Mountain, Nevada, estimated the total repository cost by the construction phase (2002) at $3.9 billion, with an average annual cost (from 1999 to 21 16) of 920.5 million. Of this cost, S42.2 million is corrosion-related.
NACE has a powerpoint of the 2002 study: http://www.nace.org/Publications/Cost-of-Corrosion-Study/
[ About this report: done from1999 to 2001 by CC Technologies Laboratories, Inc., with support from the FHWA and NACE. Its main activities included determining the cost of corrosion control methods and services, determining the economic impact of corrosion for specific industry sectors, extrapolating individual sector costs to a national total corrosion cost, assessing barriers to effective implementation of optimized corrosion control practices, and developing implementation strategies and cost-saving recommendations. ]
2 Responses to Corrosion eats $552 billion of infrastructure a year (6% of GDP)