
Preface. Although I consider peak oil to be the largest threat, since all other resources and economic activities depend on it, we’re faced with a convergence of hundreds of other problems enabled by fossil fuels, which caused the the huge population explosion of humans. Marine biodiversity is just one of these problems.
Alice Friedemann www.energyskeptic.com author of “When Trucks Stop Running: Energy and the Future of Transportation”, 2015, Springer and “Crunch! Whole Grain Artisan Chips and Crackers”. Podcasts: Derrick Jensen, Practical Prepping, KunstlerCast 253, KunstlerCast278, Peak Prosperity , XX2 report
Sardain, A., et al. 2019. Global forecasts of shipping traffic and biological invasions to 2050. Nature Sustainability.
Rising global maritime traffic could lead to sharp increases in invasive species around the world over the next 30 years, according to a new study by McGill University researchers.
“Biological invasions are believed to be a major driver of biodiversity change, and cause billions of dollars in economic damages annually,” says senior author Brian Leung, an associate professor in McGill’s Department of Biology and School of Environment. “Our models show that the emerging global shipping network could yield a 3 to 20-fold increase in global marine invasion risk between now and 2050.”
Shipping is responsible for over 80% of world trade, and 60-90% of marine bio-invasions, often in their ballast water, or attached to the hulls.
Molnar, J. L., et al. 2008. Assessing the global threat of invasive species to marine biodiversity. Frontiers in ecology and the environment #6
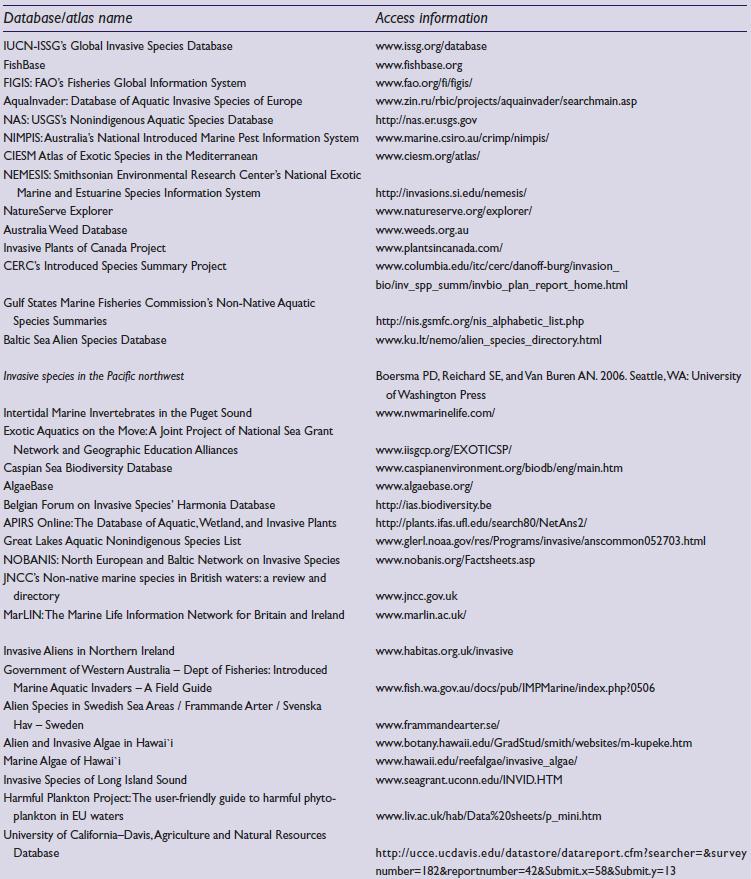
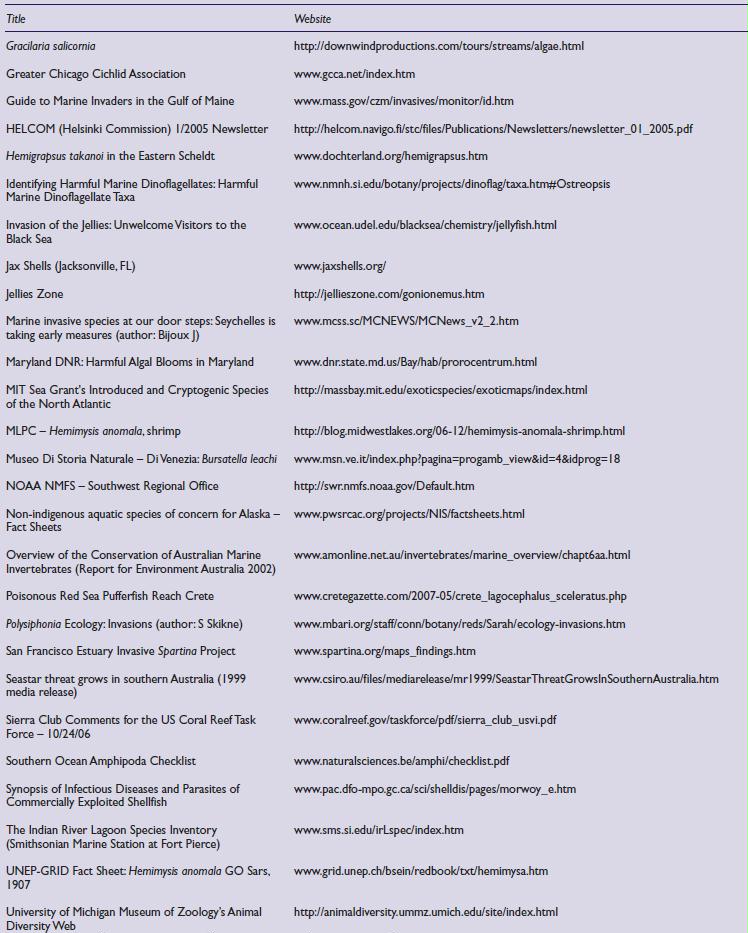
Although invasive species are widely recognized as a major threat to marine biodiversity, there has been no quantitative global assessment of their impacts and routes of introduction. Here, we report initial results from the first such global assessment. Drawing from over 350 databases and other sources, we synthesized information on 329 marine invasive species, including their distribution, impacts on biodiversity, and introduction pathways. Initial analyses show that only 16% of marine ecoregions have no reported marine invasions, and even that figure may be inflated due to under-reporting.
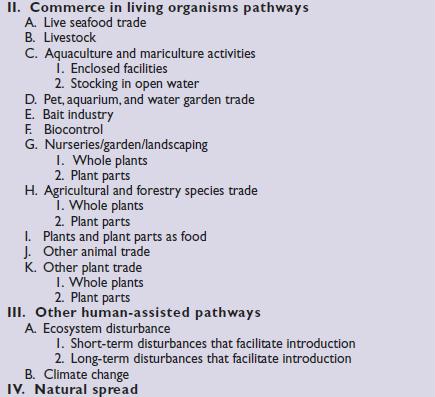
International shipping, followed by aquaculture, represent the major means of introduction.
Invasive species have transformed marine habitats around the world. The most harmful of these invaders displace native species, change community structure and food webs, and alter fundamental processes, such as nutrient cycling and sedimentation.
Alien invasives have damaged economies by diminishing fisheries, fouling ships’ hulls, and clogging intake pipes. Some can even directly impact human health by causing disease.
We defined “harmful” invasive species as those having ecological impact scores of 3 or 4 (disrupting multiple species or wider ecosystems). Using this definition, 57% of species in our database are harmful, ranging from 47% of cnidarians to 84% of plants
Our data reveal high levels of invasion in the following ecoregions:
- Northern California, including San Francisco Bay (n = 85 species, 66% of which are harmful),
- Hawaiian Islands (73, 42%)
- North Sea (73, 64%)
- Levantine Sea in the eastern Mediterranean (72, 50%).
Realms that feature the highest degree of invasion are:
- Temperate Northern Atlantic (240, 57%)
- Temperate Northern Pacific (123, 63%)
- Eastern Indo-Pacific (76, 45%).
The least invaded realms are the Southern and Arctic Oceans (1, 100%, and 9, 56%, respectively).
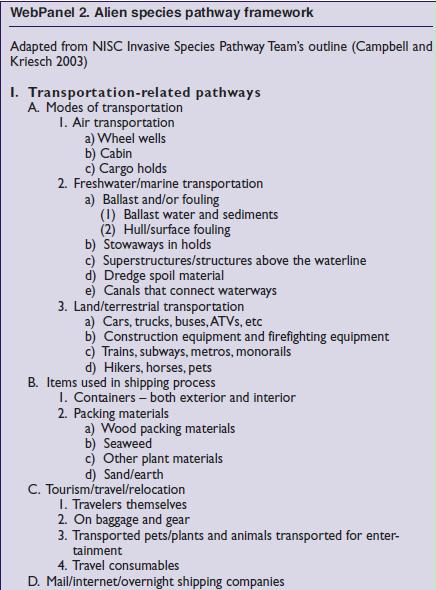
More than 80% of species were introduced unintentionally. The most common pathway for 60 marine species in the database was shipping (ballast and/or fouling; 228 species, 57% of50which are harmful). Of the 205 species with more detailed shipping pathway information, 39% are known to have been, or are likely to have been transported only by ship fouling, 31% are transported only by ballast,30and 31% are transported by either ship foul ing or ballast. The aquaculture industry is the next most common pathway (13420 species, 64% of which are harmful;
Each invasive species was assigned a score (where data allowed) for the following categories: ecological impact, geographic extent, invasive potential, and management difficulty (Panel 1). The “ecological impact” score measures the severity of the impact of a species on the viability and integrity of native species and natural biodiversity. For example, the green alga, Caulerpa taxifolia, was assigned the highest ecological impact score (4), based on its ability to outcompete native species and reduce overall biodiversity (Jousson et al. 2000). The sea slug, Godiva quadricolor, was conservatively assigned a lower score (2), because its only known impact is feeding on one taxon – other sea slugs – with no wider effects documented (Hewitt et al. 2002). The ecological impact score was assigned globally for each species, not for specific occurrences.
Ecological impact:
- 4 – Disrupts entire ecosystem processes with wider abiotic influences
- 3 – Disrupts multiple species, some wider ecosystem function, and/or keystone species or species of high conservation value (eg threatened species)
- 2 – Disrupts single species with little or no wider ecosystem impact
- 1 – Little or no disruption
- U – Unknown or not enough information to determine score
Geographic extent
- 4 – Multi-ecoregion
- 3 – Ecoregion
- 2 – Local ecosystem/sub-ecoregion
- 1 – Single site
- U – Unknown or not enough information to determine score
Invasive potential
- 4 – Currently/recently spreading rapidly (doubling in < 10 years) and/or high potential for future rapid spread
- 3 – Currently/recently spreading less rapidly and/or potential for future less rapid spread 2 – Established/present, but not currently spreading and high potential for future spread
- 1 – Established/present, but not currently spreading and/or low potential for future spread U – Unknown or not enough information to determine score
Management difficulty
- 4 – Irreversible and/or cannot be contained or controlled
- 3 – Reversible with difficulty and/or can be controlled with significant ongoing management
- 2 – Reversible with some difficulty and/or can be controlled with periodic management
- 1 – Easily reversible, with no ongoing management necessary (eradication)
- U – Unknown or not enough information to determine score
We have compiled information from over 350 data sources. The database now includes 329 marine invasive species, with at least one species documented in 194 ecoregions (84% of the world’s 232 marine ecoregions; Figure 1).
The dominant groups of species in our database are crustaceans (59 species), mollusks (54), algae (46), fish (38), annelids (31), plants (19), and cnidarians (17). We scored all 329 species for ecological impact and geographic extent. The mean ecological impact score was 2.55 (SD = 1.04) – halfway between “disrupts single species with little or no wider ecosystem impact” and “disrupts multiple species, some wider ecosystem function. Most species have been found in multiple ecoregions (mean geographic extent score of 3.98, SD = 0.19). We scored 324 species for invasive potential, with a mean score of 2.05 (SD = 1.03; “established/present…high potential for future spread”). The 268 species scored for management difficulty had a mean of 3.56 (SD = 0.71), indicating that most are difficult if not impossible to remove or control.
Do your own research:
University of Tartu: Benthic Invertebrates www.sea.ee/Sektorid/merebioloogia/MASE/Benthic_invertebrates.htm
USGS’s Florida Integrated Science Center – Gainesville http://cars.er.usgs.gov/Nonindigenous_Species/nonindigenous_species.html
USGS’s Marine Nuisance Species http://woodshole.er.usgs.gov/project-pages/stellwagen/didemnum/
WA State Noxious Weed Control Board’s Information www.nwcb.wa.gov/weed_info/Written_findings/Spartina_anglica.html about common cordgrass (Spartina anglica)
Weed Information Sheet: Hygrophila costata www.portstephens.local-e.nsw.gov.au/files/46654/File/Hygrophila_info_sheet.pdf
Why do jellyfish sting? (author: B Galil) www.ocean.org.il/Eng/Focus/Jellyfish.asp
2 Responses to The global threat of invasive species to marine biodiversity